Dynamic Modelling of Refrigerated Truck
Chambers
R.A.Pitarma
1, P.D.Gaspar
2& M.G.Carvalho
3 1Department of Mechanical Engineering, Polytechnic Institute of Guarda, Portugal.
2
Department of Electromechanical Engineering, Beira Interior University, Portugal
3
Department of Mechanical Engineering, Technical University of Lisbon-IST, Portugal.
Abstract
A refrigerated truck chamber is always under variable conditions. Not only weather changes but also loading and unloading processes can make the chamber behaviour dependent on time. A prediction of relevant properties distributions (velocity, temperature and relative humidity) in refrigerated chambers requires the simultaneous solution, by an iteration process, of the three-dimensional non-linear differential equations for the momentum and heat/mass transport. Basically, these two transport phenomena are coupled by the buoyancy force due to natural convection. However, especially for non-steady state thermal conditions, the high computations times become unattractive the simultaneous integration.
For the majority of refrigerated truck chambers, in which the air flow is mainly dominated by forced convection, the equations can be decoupled and the two transport phenomena can be treated separately. Therefore, in the case of dynamic (transient) simulation, this strategy makes the problem much simpler and can strongly reduce the computation time. In this study the simulation method described here was applied in a case study modelling (steady and transient) and was validated by measurements taken from an experimental reduced-scale model.
1 Introduction
The most general purpose of refrigeration is to maintain a controlled atmosphere in confined spaces. This definition includes air conditioning in office and domestic buildings, and frozen or refrigerated storage of perishable products. The world-wide expansion of the frozen food industry and of the commercial exchanges of perishables has given rise to the significant growth of the road transport under controlled temperature, in order to preserve their quality. The energy component of the problem is highly important. The eventual reduction of the energy consumption should not be attained at the expense of quality requirements of the product. Thus, the aim consists of optimizing these two contradictory factors.
Experimental studies in this field are very scarce. Such research is important, but it is extremely expensive. Nieuwenhuizen and Meffert [1] reported an experimental real scale study of refrigerated long road vehicles. The study comprises comparative temperature measurements on three thin-wall and one conventional road refrigerated vehicle. Decreasing costs allied to computer development gave way to numerical methods in modelling of air distribution in ventilated rooms. In fact, mathematical modelling for the prediction of air motion and thermal behaviour is more or less well established in air conditioning. However, in the field of food cold storage, modelling of refrigerated space is not well improved and is generally still in the development stage. This is not surprising, because a refrigerated room (cold store, refrigerated container or a truck) is a space that usually has a complicated shape, without (permanent) occupation, filled with produce, often on pallets or in boxes. In the other hand, a refrigerated truck chamber is always under variable conditions. Not only weather changes but also loading and unloading processes can make the chamber behaviour dependent on time.
Therefore, only a few models relating to refrigerated chambers have appeared to date, and most of these still have limitations because of the assumptions adopted in developing the models, and most are steady-state models. With the help of the advanced computer package Phoenics, Hu et al. [2] accomplished a computational study of convective heat transfer of a closed refrigerated display case to analyse the temperature distribution. Equally with the help of Phoenics code, numerical calculations of velocity and temperature distributions in a 14 m3 refrigerated room were performed by Wang and Touber [3]. The experimental validation has been carried out only for temperature results, showing reasonable agreement. Pitarma [4] presents numerical predictions, obtained by an academic proper code, and experimental validation of the three-dimensional turbulent flow in refrigerated truck chambers to investigate the improper air circulation. Good agreement was found in experimental validation. Gaspar et al. [5] have done by the computer package Phoenics, numerical simulations in an open refrigerated display case to study the turbulent heat transfer and the performance of the air curtain.
A prediction of relevant properties distributions (velocity, temperature and relative humidity) in refrigerated chambers requires the simultaneous solution,
by an iteration process, of the three-dimensional non-linear differential equations for the momentum and heat/mass transport. Especially for non-steady state thermal conditions, the high computations times become unattractive the computer the simultaneous integration. In this study a simulation method for dynamic modelling is described. The model was applied in a case study modelling (steady and transient) and was validated by measurements taken from an experimental reduced-scale model.
2 Dynamic Modelling Methodology
2.1 Airflow Model
Modelling refrigerated chambers requires a prediction, and visualization, of relevant properties - velocity, temperature and relative humidity - distributions in the refrigerated room. Therefore, it is necessary a general computer procedure which solves the three-dimensional non-liner differential equations of the momentum transport and heat and mass transport. Basically, these two transport phenomena – momentum and heat/mass - are coupled by the buoyancy force due to natural convection, which requires the simultaneous solution of a set of partial differential equations. This type of mathematical model has high computation cost which turns it unattractive, especially when transient modelling is required, because long calculation times are not practical for parametric (optimization) studies, where many runs are necessary.
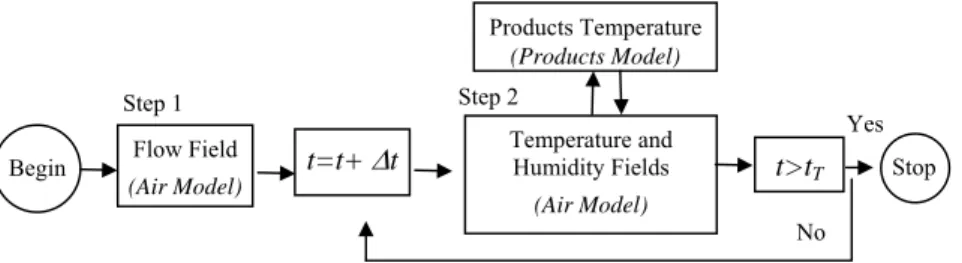
For the majority of refrigerated truck chambers, in which the air flow is mainly dominated by forced convection (i.e. the airflow is largely determined by the inertia forces in detriment of the buoyancy forces), the buoyancy force due to natural convection can be neglected. Thus, the equations can be decoupled and the two transport phenomena can be treated separately. Therefore, in the case of dynamic (transient) simulation, this strategy makes the problem much simpler and can strongly reduce the computation time. Actually, for transient simulation the non-linear momentum equation only needs to be solved once during the simulation, as first step of this modelling strategy is to model the flow pattern without considering any heat/mass transfer. Notice that, while the fans are in movement the airflow pattern can be considered as no time dependent. Second step is to model the heat and mass transfer based on the calculated flow pattern. Figure 1 shows a schematic flow diagram of the simulation procedure for both steps. In conclusion, in this strategy the flow pattern is modelled as steady state while the heat/mass transfer is considered dynamically. After the flow pattern has been calculated (first step), the velocity field is known so the heat/mass transport equations (second step) become linear. The solution is now much simpler, because it does not need iteration procedure.
t=t+ ∆t Temperature and Humidity Fields (Air Model) Step 2 t>tT No Yes Stop Products Temperature (Products Model) Flow Field (Air Model) Begin Step 1
Figure 1. Schematic flow diagram of the simulation procedure 2.2 Products Model
For predicting the temperature profiles and temperature history in cold storage, the computational model was extended to model (unsteady) heat transfer in the products. The numerical treatment of the time-dependent heat diffusion in the products (and walls) is, with reasonable assumptions, particularly simplified. It is enough to adapt the energy balance equation to the three-dimensional (unidirectional for walls) time-dependent conduction. The major problem is related to the boundary conditions, particularly for the coupled boundary air-products. In this case, due to its interdependence, it was considered an iteration procedure in which the two temperature fields are calculated and corrected, successively and alternately, using the solution of the first as the boundary condition to the other.
3 Mathematical
Modelling
The equations that describe the airflow, heat transfer and humidity distribution in a refrigerated room are all based on the conservation of mass, momentum, thermal energy and concentration of species within the room. The indoor airflow encountered in rooms is often turbulent. Among the turbulent models, the k-ε two-equation turbulence model, based on eddy-viscosity/eddy-diffusivity concepts (Launder and Spalding [6]), seems most widely used for airflow studies in rooms.
The governing equations are represented by the continuity equation, the incompressible Navier-Stokes equations, the energy conservation equation, the species conservation equation, the turbulence energy conservation and the dissipation rate of turbulence energy. The governing equations for the averaged flow can be written in the general form for an incompressible fluid as:
(
j)
j j ju
S
t
x
x
x
φφ
φ
∂
⎛
φ
φ
⎞
∂
∂
∂
+
−
⎜
⎜
Γ
⎟
⎟
=
∂
∂
∂
⎝
∂
⎠
(1)where φ represents the dependent variable (=1 for the continuity equation; = U, V, W, h and ω for momentum, energy and moisture equations). Γφ is the diffusion coefficient and Sφ represents the source term (see, for example, Pitarma [4]). Following the modelling strategy described above, (i) in the airflow modelling (first step) the unsteady and diffusion terms are neglected and (ii) in the modelling of heat/mass transport (second step) the diffusion term is neglected (convection term is neglected for the case of products and walls).
Because of the damping effect of the wall, the transport equation for the turbulence quantities does not apply close to the wall. The alternative is to extend the Couette flow analysis and apply algebraic relations, the so-called logarithmic laws or wall functions for momentum and heat fluxes (Launder and Spalding [6]), for the calculation of the velocity parallel to the boundary components and the heat flux through the boundary.
The general partial differential eqn (1) has been discretized by means of a finite volume method, i.e., by integration of the equations over a control volume on a mesh to yield finite difference equations (see Patankar [7]). Fully implicit method was used for time discretization. A staggered non-uniform grid with velocity nodes offset from scalar nodes is used in the present computations. The continuity equation is rewritten into an equation for the pressure correction and the pressure-momentum linked equations are solved by a method based on the SIMPLE algorithm (Patankar [7]).
4 Experimental Validation and Results
4.1 Laboratory Model and Measurements
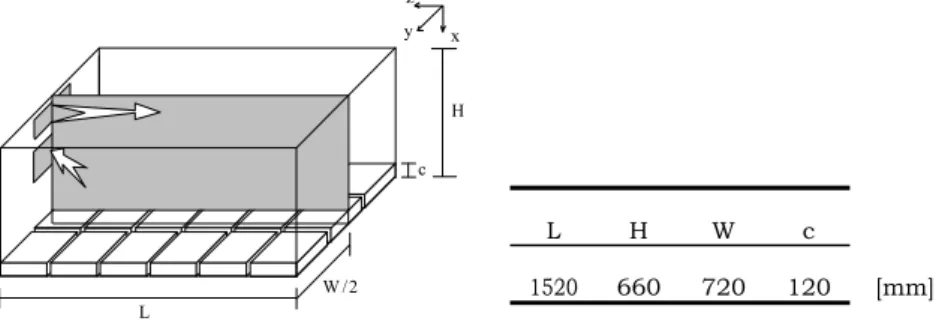
To validate the computational model, experiments have been conducted on a reduced-scale model. The laboratory model is based on a prototype refrigerated truck chamber with 3,80x1,80x1,65 m3 ventilated by the common method of air distribution in truck chambers. A simple physical modelling technique, based on dimensional analysis, was used to derive the physical properties of the experimental (reduced) model, which consists of 1,52x0,72x0,66 m3 box with 6mm thick “Perspex” glass walls, schematic shown in Fig. 2.
H L z y x W /2 c L H W c 1520 660 720 120 [mm]
The entire apparatus is insulated with 100mm thick expanded polystyrene. The inlet and the outside air temperatures, was To=5,0ºC and Te=25ºC, respectively. The mean inlet velocity was Vo=3,1m/s, but velocity measurements were made to characterize the velocity distribution at the inlet section. The stored products (cold store) were simulated by paraffin blocks disposed on the floor (Fig. 2). The internal room load was produced by electrically heated tapes laid over the floor area to produce a uniform thermal load distribution. Thermocouples (T type, 200 µm wire diameter) and a hot-wire anemometer system (Dantec StreamLine) with an omnidirectional hot-film sensor (Dantec 55R49) were used for temperature and air velocity magnitude measurements. A complete description of the experimental installation can be found in Pitarma [4].
4.2 Computer Implementation and Results
The computational model was used to predict the velocity, temperature and humidity fields in the reduced-scale model, described above. For the validation procedure, both velocities and temperatures are measured for both steady-state and dynamic cases. The computations were performed using an 11x9x19 (airflow model) and 8x9x19 (products model) control volumes grids. In accordance with the symmetry of the experimental chamber and their operating conditions, only half of the flowfield was covered by computational domain. Grid-dependence tests were carried out indicating that the differences between the results in this grid and a 22x18x38 control volumes grid are not significant. The sums of the absolute residuals of mean field variables were used for monitoring convergence. The iterative process was terminated after the normalized residuals had fallen below 0,05% (air flow model). For the air-products iterative procedure, the convergence was achieved when the temperature difference of any control volume of the boundary (air-product), in two consecutive iterations, it was less than 0.2ºC. The computations were performed on a HP Apollo 720 workstation, and the required times of CPU to achieve convergence were 39 minutes and 5h12m, for steady-state condition and dynamic simulation of real time of 20 h, respectively.
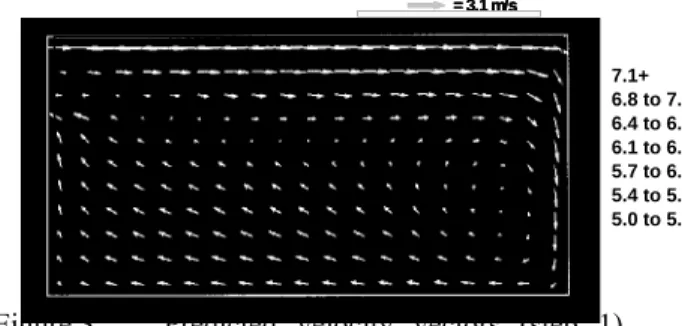
Figure 3 shows an example of a calculated flow field (first step) in the symmetry plane.
Figure 3. Predicted velocity vectors (step 1) and distribution temperature contours (step 2) in the symmetry plane.
= 3.1 m/s = 3.1 m/s = 3.1 m/s 7.1+ 6.8 to 7.1 6.4 to 6.8 6.1 to 6.4 5.7 to 6.1 5.4 to 5.7 5.0 to 5.4
The figure gives also predictions of the temperature contours (second step) in the same plane. Figure 4 shows a comparison of calculated and measured velocity and temperature profiles. In Figure 5 the calculated temperatures are compared with experimental results for steady and dynamic cases.
0.5 0.8 1.0 1.3 1.5 1.8 2.0 T / To 0.00 0.20 0.40 0.60 0.80 1.00 y / ( W *0 .5 ) x / H = 0.045 z / L = 0.237 0.0 0.2 0.4 0.6 0.8 1.0 V / V o 0.00 0.20 0.40 0.60 0.80 1.00 y / (W*0.5) x / H = 0.045 z / L = 0.132 o exp -+- num o exp -+- num a) b) 1.0 1.3 1.5 1.8 2.0 2.3 2.5 2.8 3.0 T/ To 0.00 0.20 0.40 0.60 0.80 1.00 z / L x / H = 0,920 y / (W*0.5) = 0.50 0 200 400 600 800 1000 1200 Time (min) 9 12 15 18 21 24 27 T e m p e ra tu re ( º C ) Products Temperature num (A) exp (A) num (B) exp (B) Figure 4. Comparison of calculated and measured non-dimensional
velocity (step 1) and temperature profiles (step 2).
a) b) A (x/H=0.86m) B (x/H=0.96m) y/(W/.5)=0.5 z/L=0.974 o exp -+- num
Figure 5. Comparison of calculated and measured products temperature. (a) Steady-state; (b) Dynamic.
5 Conclusions
The main objectives of this work were: (i) to develop a computer model to predict and visualize the airflow, temperature profiles and temperature history in refrigerated truck chambers subjected to fluctuating environmental temperatures; (ii) to validate the simulation model by comparison of calculated and measured
results. The experimental results of air and products temperatures, in both cases (steady-state and dynamic), were satisfactorily predicted by the computational model. The good agreement obtained suggests that the two objectives were reasonably achieved and, because of the lower costs, the model can be conveniently used in practice for engineering purposes. In fact, the dynamic simulation of the truck chambers is essential for studying the energy performance and the cold quality offered by the system under real (variable) conditions. The result can be used by operators to decide when and how products must be load.
There are, however, several remaining problems which should be gradually solved in future investigations. Generally products are constituted by small pieces (as apples or strawberries) and therefore it is obvious they should be treated as porous solid. The experiment was made only for temperature and velocity measurements. Due to several difficulties, humidity was not measured. In future investigations it is also important to consider more complexes shapes of the stored products.
References
[1] Nieuwenhuizen, G.H. & Meffert, H.F. Comparative experiments on three thin-wall and one conventional road vehicle, International Journal of Refrigeration, vol. 9, pp. 303-309, 1996.
[2] Hu, S.C., Fan, N.W. & Hu, R. Optimization of the display design using numerical models. Phoenix Jounal of CFD &its applications, vol.7, nº1, 1994.
[3] Wang, H. & Touber, S. Distributed dynamic modelling of a refrigerated room, International Journal of Refrigeration, vol. 13, July, 1990.
[4] Pitarma, R.A. Modelação Matemática e Experimental de Câmaras Frigoríficas de Veículos, Ph.D. Thesis, Technical University of Lisbon, Portugal, 1998.
[5] Gaspar, P.D., Miranda, A.B. & Pitarma, R.A. Estudo Numérico do Escoamento de Ar e do Desempenho Térmico de Equipamentos Expositores Refrigerados. V Congreso de Métodos Numéricos en la Ingeniería Y Ciencias Aplicadas, Madrid, Junio, 2002.
[6] Launder, B.E. & Spalding, D.B. The Numerical Computation of Turbulent Flows. Compt. Methods Applied Mech. & Eng .; 3; pp. 269-289, 1984. [7] Patankar, S.V. Numerical heat transfer & fluid flow, Hemisphere Publishing
Corporation, Washington, 1980.
[8] Awbi, H. B. Ventilation of buildings, E. & F.N. Spoon Press, Second Edition, London, 1995.
[9] Pitarma, R. A., Ramos, J. E. & Carvalho, M. G. Computational and Experimental Reduced-Scale Modelling of Air-Conditioned Rooms, Building Simulation 2003, Eindhoven, Holland, 2003.