Original paper Open Access
Maydica
IntroductionMaize (Zea mays L.) is one of the world’s major cereal crops, substantially contributing to the global cereal production, and takes a dominant place in the agricultural economy and trade as food, animal feed (Holding and Larkins, 2009) and commodities manufacture (White and Johnson, 2003). Similarly, in Portugal, maize is one of the most important cereal crops, with its production in mainland currently ensured principally by high yielding hybrids or genetically modified organisms (GMOs) (Pinheiro de Carvalho et al., 2008; Skevas et al., 2010). Until the mid-twentieth century, maize cultivation was based mainly on farmer’s local varieties, the so-called landraces (LRs) (Pinheiro de Carvalho et al., 2008). Since then, due to intense commercial pressures, maize LRs were replaced. Field observations allow hypothesizing a considerable loss of crop diversity as a result of this replacement (Pinheiro de Carvalho et al., 2008; Pinheiro de Carvalho et al., 2013). The diversity loss was reviewed by Pollack
(2003) and Eschholz et al. (2008), and references therein. LRs are populations, or group of populations, occurring in a specific geographical region that share common key agronomic or other traits, although they are characterized by heterogeneity (Camacho Villa et al., 2006; Pinheiro de Carvalho et al., 2008; Pinheiro de Carvalho et al., 2013). Maize LRs show high genetic variability and fitness to the anthropological habitats where they have developed (Brandolini, 1969). Since they can be composed of several populations, an ideal population (ideotype) representing these landraces can be identified.
Moreover, LRs are a vital source of genetic variability and potentially useful traits, such as resistance or tolerance to biotic and abiotic stresses. They can be useful for breeding, agriculture sustainability and adaptation to global changes (Pinheiro de Carvalho et al., 2004; Newton et al., 2010; Pinheiro de Carvalho et al., 2013), but they are also an unrecoverable bank of highly co-adapted genotypes. Previous studies have
Phenotyping the ideotypes of two maize
landraces from Madeira archipelago
using morpho-agronomic traits and zein
pattern
Miguel ÂA Pinheiro de Carvalho1*, Carmen MS Sardinha1, Carla SS Gouveia1, Emanuel M da Silva1, Humberto GM Nóbrega1, José FT Ganança1, Sónia R Nóbrega1, Teresa MM dos Santos1
1 Banco de Germoplasma ISOPlexis. Campus da Penteada. Universidade da Madeira. 9020-105 Funchal, Portugal *Corresponding author : E-mail: [email protected]
KeyWords chip electrophoresis; genotype; landraces; Zea mays L.; zein pattern. Abstract
Madeira Archipelago holds specific maize genetic resources whose populations, representing field diversity, were previously classified into four main landrace groups. The ISOPs 0061 and 0070, with common names of “Milho Sequeiro” and “Milho Branco” yellow and white maize, respectively, represent the ideotypes of two of these lan-draces. These ideotypes have now been analyzed using morpho-agronomic and biochemical traits, to phenotype these landraces. The variation of nine of the ten morpho-agronomic traits was used to separate the landraces ideotypes. However, the seven traits of seed biochemical composition did not allow to segregate the landraces ideotypes. This is not the case of zein pattern, which polymorphism shows to be specific for each ideotype. The original ideotypes populations were regenerated twice under low input conditions. Zein patterns of the original and regenerated accessions were compared, using two electrophoresis techniques. The lab-on-a-chip electropho-resis showed that the standard SDS-PAGE zein pattern with six fractions could be separated into eighteen (ISOP 0061) and twenty (ISOP 0070) protein bands. In contrast, no significant changes were detected in the zein pattern structure of the initial and regenerated accessions of both landraces ideotypes. The chip electrophoresis showed to be a suitable technique to screen and characterize a large number of individuals and accessions of the germ-plasm collections, due to its reproducibility. In particular, the zein patterns can be used to phenotype ideotypes and establish a formula representing their structure, allowing to detect changes in landrace structure, occurring as a result of gene bank management actions.
shown that breeding mainly leads to a qualitative shift rather than quantitative, followed by the loss of genetic diversity in registered cultivars (Pollack, 2003, and references therein). Thereby, maize breeders have become aware of the necessity to maintain genetic diversity beyond elite varieties and hybrids through the conservation and sustainable use in breeding programs of the LRs genetic resources.
In this respect, the study of the introduction and dispersion of maize into Europe provided the evidence that North American flint populations played a crucial role in the maize adaptation to cultivation in temperate environments, by contributing with needed alleles (Rebourg et al., 2003). In Madeira’s archipelago, maize was introduced in 1760 and became the 2nd most crucial cereal. Currently, maize is cultivated from sea level until 950 m asl, under low input and rainfed conditions, using open pollinated LRs (Pinheiro de Carvalho et al., 2008). The local grain production is mainly used for preparing traditional foods, and the remaining biomass is used for animal feeding.
An early morphological and agronomic study carried on 43 local populations, representing the crop after diversity has indicated the presence of 4 flint LRs groups that mostly were separated by six morphological and three agronomic traits (Pinheiro de Carvalho et al., 2008). This maize diversity was sampled and included in the ISOPlexis Genebank collection, whereas 180 unique accessions are presently stored (http://isoplexis.uma. pt/gringlobal/search.aspx). Moreover, each LRs group possess a significant variation on the analyzed traits (i.e., grain and plant traits), having complex population structures (Pinheiro de Carvalho et al., 2008). The multivariate analysis allowed to identify the LRs ideotypes that are represented by centroid populations of LRs groups. Although it is a common observation that LRs are less productive than elite hybrids (Perales et al., 2003), from experimental trials carried out in Madeira, it can be concluded that these LRs can compete in yields with modern varieties when grown under local Madeiran agroecological conditions. This is apparently due to their agronomic performance and excellent adaptation to these environments. Notably, Madeiran maize LRs also revealed to be more adapted to soil acidity and aluminum toxicity in comparison with commercial hybrids (Pinheiro de Carvalho et al., 2004), and likely to drought conditions, two features that often are coevolving with the adaption to soil acidity (Yang et al., 2013). These studies provided evidence that Madeira’s maize showed all features of LRs, e.a. higher adaptation to local agro-ecological conditions and farming management systems (Pinheiro de Carvalho et al., 2004), agronomic and historical use, ethnographic
value (Bellon et al., 2003) and good nutritional quality (Holding and Larkins, 2009).
Biochemical composition and grain quality are important specific traits in LRs phenotyping, and its variability can help to identify germplasm suitable for the development of new cultivars or food applications. Among most perspective traits are total mineral, protein, starch, and crude fiber content (Motto et al., 2011; Scorb et al., 2014). The maize kernel accumulates storage proteins, being the most substantial fraction composed by prolamins, collectively known as zeins (for reviews see Boston and Larkins, 2009; Motto et al., 2011). Its relative amounts can be influenced by grain related traits, such as grain type, size, texture, and hardness (Li and Vasal, 2004; Holding and Larkins, 2009). Zeins have been classified into four subfamilies of α- (60 to 70% of all zeins), β- (5 to 10% of all zeins), γ- (20 to 25% of all zeins) and δ-zein (<5% of all zeins), based on their primary structure and different solubility (Boston and Larkins, 2009; Motto et al., 2011). The exceeding large proportion of codons for hydrophobic amino acids in α-zeins is mostly responsible for the imbalance of maize protein reserves (Motto et al., 2011) since they are practically free of essential amino acids, e.g., lysine and tryptophan. The zein polymorphism, structure, and solubility are also relevant for flour features, food processing and manufacturing a variety of industrial products, as well as varietal identification. Zeins are encoded by a single (γ-, and δ- zeins), 2 (β-zein) or several (α-zein) genes and its loci (Boston and Larkins, 2009). The α-zein fraction is encoded by four different gene sub-families (Z1A, Z1B, Z1C, and Z1D) that in the B73 reference line contain up to 50 genes displayed in six chromosomal locations (Boston and Larkins, 2009; Feng et al., 2009).
The use of zein polymorphism in maize samples identification implies their separation and classification, using appropriate techniques and nomenclature systems (Konarev et al., 1979; Esen, 1986; Esen, 1987; Wilson, 1991; Sidorova et al., 2000; Wu et al., 2012). Notably, zeins are useful markers used in taxonomy, evaluation of genetic resources diversity, varieties identification, population, and LRs structure analysis (Nucca et al., 1978; Sidorova et al., 2000; Freitas et al., 2004). The analysis of 43 Madeiran maize populations allowed to detect 16 or 20 zeins, separated by SDS-PAGE or Acid-SDS-PAGE electrophoresis, allowing to explain the crop diversity in 6 population groups (Freitas et al., 2004). They are genotype specific, with genetic control, polymorphic, reliable, stable and less influenced by external environmental factors (reviewed in Motto et al., 2011), providing less expensive and time-consuming analysis than for example isoenzymatic
analysis (Geric et al., 1989; Sidorova et al., 2000). However, the work with a high number of genebank samples requires fast and sensitive techniques, able to detect the less common fractions, separate close related bands (alleles), with secure data acquisition and analysis. The lab-on-a-chip electrophoresis can provide such solutions, having 10 to 100-fold higher sensitivity than traditional SDS-PAGE electrophoresis. It accomplishes protein separation and generates composite electrophoregrams in 30 minutes with the obtained data compatible with specific software’s for similarity analysis, such as FingerprintingTM (Bradová and Matějová, 2008; da Silva et al., 2013).
The aim of this work was to characterize the ideotypes of Madeiran “Milho Santana” and “Milho da Terra” LRs using morpho-agronomic and seed traits, to analyze the LRs zein pattern and to evaluate its use in assessment of changes in accessions genetic structure, during management actions, using for the first time lab-on-a-chip electrophoresis.
Materials and Methods
Plant material
The maize populations named “Milho Sequeiro” (ISOP 0061) yellow flint and “Milho Branco” (ISOP 0070) white flint and its multiplications were used in this work. Early they have been identified as ideotypes of “Milho da Terra” and “Milho Santana” landraces (Pinheiro de Carvalho et al., 2008), respectively. These initial populations were grown in a 2-year assay, in 16 m2 plots, with replicates, at the University of Madeira (Madeira Island – Portugal) experimental field, under low input conditions, with a minimum safety distance of 60 m and using cloth net to avoid undesired cross-pollination. In each assay, about 200 plants per plot were grown. Thirty to fifty seeds from each accession or multiplication were randomly chosen and compared for grain quality traits and analyzed for their zein pattern.
Morpho-agronomic characterization
Both LRs ideotypes were characterized by a set of 10 morphological and agronomic traits, using the methodology described by Pinheiro de Carvalho et al. (2008). These traits were related with plant architecture and yield, and included plant height (PH), plant height index (PHI), number of leafs (NL), leaf area (LA), ear length (EL), ear central diameter (ECD), number of kernels per row (NKR), kernel size (KS), kernel volume (KV), 100-kernels weight (KW), kernel specific mass (KSM) and specific weight (KSW). Morphometric indexes were calculated from raw traits to mean values according to Brandolini and Brandolini (2001).
Biochemical composition
Five-grain quality-related traits were analyzed by Near Infra-Red Spectroscopy (NIRS) technique, namely kernel organic matter (KOM), total minerals (KTM), fibers (KF), starch (KSt), total lipids (KTL) and total proteins (KTP). The centesimal analysis of the flour was predicted according to Gouveia (2011), using the WinISI II (v.1.5) software, in a FOSS NIRSystems 5000. A calibration model was previously built from 100 maize samples by NIR spectrum with absorbance values as log1/R (where R is the reflectance of the sample, in a spectral range from 1,100 to 2,500 nm), and lab centesimal composition reference values. It was applied a spectral pre-treatment based on Standard Normal Variate (SNV), Multiplicative Scatter Correction (MSC), and detrend corrections, with a prediction model by a PLS regression corrected with the first derivative (D=1,
G=4, S1=4, S2=1). Full cross-validation by leave-one-out was repeated until all the 100 samples are predicted. The centesimal parameters were then analyzed on flour obtained from a bulk of random seed-sample from each LR accession, by making nine prediction readings per accession with the above PLS model, and the results were represented as g/100 g of dry weight (DW).
Zein extraction
A random sample of 50 seeds per each accession was selected and individual seeds used for zein extraction, according to Righetti et al. (1977). The zein content was determined using Experion automated electrophoresis system (Caliper Life Sciences Inc. and Bio-Rad Laboratories). Calculations of zein percentage in grain total protein or storage protein were made based on Holdings and Larkins (2009) and Pratt et al. (1995) assumptions.
SDS-PAGE and chip electrophoresis
Zeins were separated using SDS-PAGE and Experion chip electrophoresis. SDS-PAGE electrophoresis was carried out in 12% polyacrylamide gels, prepared with PlusOne 40% Acrylamide (GE Healthcare, ref. 17-1303-01), according to Laemmli and Favre (1973) with modifications, using a Hoefer SE 600 system. Amersham Low Molecular Weight (ref.17-0446-01) markers were used to calibrate the gel run and to determine apparent MW of zein fractions (GE Healthcare, 2006). The proteins were fixed in a solution with 30% of ethanol and 10% of acetic acid and stained in Coomassie solution with 0.02% Brilliant Blue R, 30% methanol and 10% acetic acid. Chip electrophoresis was performed using the Experion automated electrophoresis system. Zein extracts were prepared using the Experion Pro260
analysis kit. The Pro260 ladder with internal lower and upper markers was used to calibrate experion virtual gels (Bio-Rad, 2010).
Experion method validation
Validation of the zein pattern separation by chip electrophoresis was carried out through the comparison of the SDS-PAGE and chip electrophoregrams using commercial zein extract (Sigma, product number Z3625), establishing a correspondence between their proteins apparent MW. The reproducibility and accuracy of chip electrophoresis separations were evaluated according to da Silva et al. (2013), by measuring the variation in zeins weight and mobility of the same sample when separated in 5 different microchip positions or successive runs.
Data treatment and statistical analysis
The measurements of morphological and biochemical parameters were used to obtain mean values and their standard deviation (SD). The mean and standard deviations of zeins MW were calculated using the values obtained for the same band in method reproducibility evaluation or different sample separations. ANOVA, t-Student tests, and parametric correlations using Pearson coefficient were performed to detect significant variations or trait correlations (p < 0.05). The zein fractions in the SDS-PAGE and chip electrophoregrams were analyzed, according to Wilson (1991) classification reviewed by Wu et al. (2012), based on their mobility and MW. The analysis of SDS-PAGE electrophoregrams was achieved with the assistance of Fingerprinting II Informatix TM Software, version 3.0 (Bio-Rad, 2002), and the chip electrophoregrams, using the Experion software. The zein patterns of an accession individual’s seeds were clustered for similarity, using the Jaccard coefficient in the Fingerprinting II Informatix TM Software, version 3.0 and Polymorphism Information Content (PIC) determined. PIC, allele’s frequency and zein polymorphism were used to analyze LRs ideotypes genetic structure using the methodology proposed by Sidorova et al. (2000).
Results and Discussion
Morpho-agronomic and biochemical phenotyping of landraces ideotypes
A previous evaluation of 43 open-pollinated populations representing the diversity of yellow and white flint maize from Madeira, allowed the identification of 4 LRs groups (Pinheiro de Carvalho et al., 2008). These LRs were distinct from the races identified by Costa-Rodrigues (1971) for Portuguese maize germplasm, and their closest relationship could be with “eight rows” types. However, the joint analysis of available morphometric data does not support this hypothesis (unpublished data). The multivariate analysis allowed the identification of “Milho Sequeiro” (ISOP 0061) and “Milho Branco” (ISOP 0070) as ideotypes of “Milho da Terra” and “Milho Santana” LRs, respectively. The segregation of these ideotypes is ensured by four morphological and six agronomic from a total of 18 traits used in their morpho-agronomic phenotyping (Table 1). The data shows that ISOP 0070 produces more biomass and has a higher yield than ISOP 0061. Also, ISOP 0070 also has the bigger KS, KV, and KW, with the two last traits showing twice the values of ISOP 0061. The KW of ISOP 0070 and ISOP 0061 was on average, 1.7 folds heavier and 30% lighter than grain produced by hybrids from ARDS Turda, Romania (Scorb et al., 2014). At the same time, both ideotypes do not differ and have the same KSM and KSW, showing that ISOP 0070 grains are less dense than those from ISOP 0061 (Table 1). Seven compositional quality-related traits related to grains biochemical composition were also analyzed and used to compare the grain ideotypes. The ideotypes biochemical traits showed differences smaller than 10% (not significant), except starch, where ISOP 0061 has 15.5% higher content. Overall, the variation of biochemical traits between accessions (initial population and multiplications) of the ideotypes is also non-significant, showing the profound influence of management actions on these accessions traits (data not shown). The “Santana” and “Milho da Terra” ideotypes have in average slightly more total protein content than 13 LRs, and 12 introduced (IP) maize from former Yugoslavia (Ignjatovic-Micic et al., 2013) and 19 ARDS hybrids from Romania (Scorb et al., 2014). At the same time, the KSt content of ISOP 0061 and ISOP 0070 is in average less 15 to 32% than Yugoslavia and Romania maizes (Ignjatovic-Micic et al., 2013; Scorb et al., 2014). The contents of KTM, KTL, and KF was also determined (Table 2), with ideotypes showing similar values to Romanian hybrids (Scorb et al., 2014).
Table 1. Table shows the landraces identification, geographical origin, values of morphological and agronomic traits significantly (*) contri-buting for “Milho da Terra” (ISOP 0061) and “Milho Santana” (ISOP 0070) landraces separation, and specific grain mass and weights. The values are represented as “mean ± standard deviation
Accessions ISOP 0061 ISOP 0070
Landrace Group Yellow flint White Flint
Landrace “Milho da Terra” “Milho Santana”
Cultivar, vernacular name “Amarelo Sequeiro” “Branco”
Geographical origin Santa Cruz Faial
Altitude, m 236 420
Plant height (PH), cm * 172.10 ± 4.65 297.70 ± 40.28
Plant height index (PHI), cm * 0.44 ± 0.03 0.71 ± 0.11
Number of leafs (NL) * 8.10 ± 0.88 8.50 ± 3.11
Leaf area (LA), cm2 * 497.58 ± 82.41 851.82 ± 44.12
Ear length (EL), cm * 15.53 ± 1.37 20.89 ± 2.11
Ear central diameter (ECD), cm * 3.39 ± 0.01 4.49 ± 0.13
Number of kernels per row (NKR) * 26.00 ± 2.48 40.85 ± 6.99
Kernel size (KS), cm * 0.86 ± 0.01 1.01 ± 0.01
Kernel volume (KV), cm3 * 21.00 ± 3.47 39.00 ± 5.10
Dry kernels’ weight (DW), g * 20.20 ± 6.55 48.53 ± 5.77
Specific mass (KSM) g/cm 1.01 ± 0.00 1.01 ± 0.01
Specific weight (KSW) KN/m 9.93 ± 0.05 9.90 ± 0.07
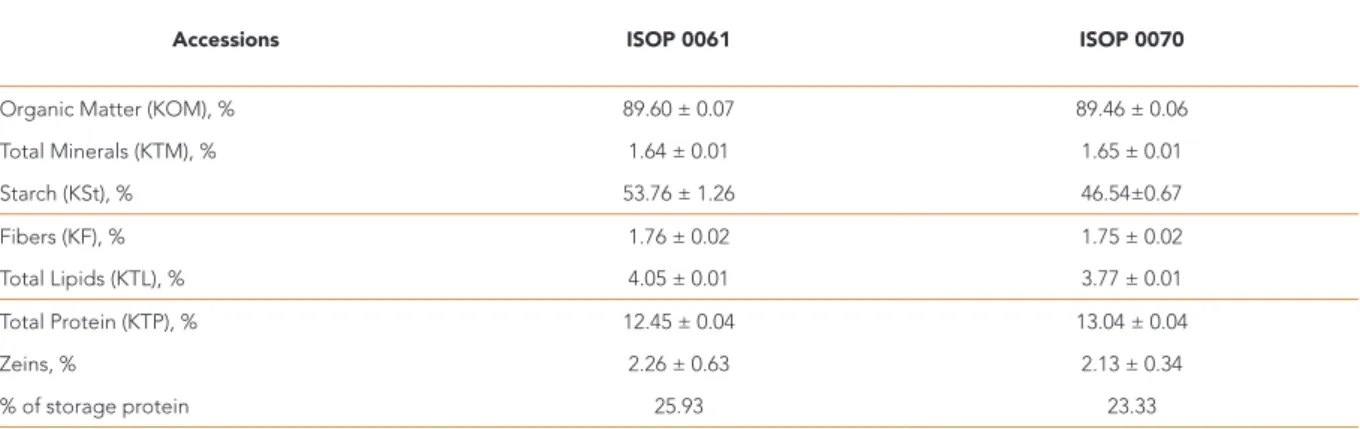
Table 2. Overall mean value (% DW) and standard deviation for each of the quality-related traits of maize kernels determined from “Milho da Terra” (ISOP 0061) and “Milho Santana” (ISOP 0070) landraces. Calculations of zein (%) in grain total protein or storage protein were made based on Holdings and Larkins (2009) and Pratt et al. (1995) assumptions.
Experion method validation
To perform the zein pattern analysis using the chip electrophoresis, the method was optimized and validated, by comparison with SDS-PAGE electrophoresis, using a commercial zein extract. This extract was separated into 4 zein (with MWs of 14.0, 23.2, 25.2 and 31.9 kDa) and 10 zein bands (with MWs of 12.8, 19.8, 23.2, 33.7, 39.5, 43.9, 47.4, 54.3, 64.6 and 68.8 kDa) by SDS-PAGE and chip electrophoresis, respectively (Figure 1). The SDS-PAGE zein pattern agrees with Sigma product description (product number Z3625), except the 31.9
kDa band, that can result from zeins’ oligomerization (Cabra et al., 2006). These results show that chip electrophoresis is more sensitive, detecting additional six bands by comparison with SDS-PAGE electrophoregram. The essay also shows that chip electrophoresis (using 24.7 µg of protein) has a 5-fold higher resolution than the SDS-PAGE (using 123.5 µg of protein) and allows band detection with a minimum of 10 ng of protein (da Silva et al., 2013), which is reflected in the higher number of bands. The linearity of MWs of typical zein bands between both techniques was compared and used to estimate
Accessions ISOP 0061 ISOP 0070
Organic Matter (KOM), % 89.60 ± 0.07 89.46 ± 0.06
Total Minerals (KTM), % 1.64 ± 0.01 1.65 ± 0.01 Starch (KSt), % 53.76 ± 1.26 46.54±0.67 Fibers (KF), % 1.76 ± 0.02 1.75 ± 0.02 Total Lipids (KTL), % 4.05 ± 0.01 3.77 ± 0.01 Total Protein (KTP), % 12.45 ± 0.04 13.04 ± 0.04 Zeins, % 2.26 ± 0.63 2.13 ± 0.34 % of storage protein 25.93 23.33
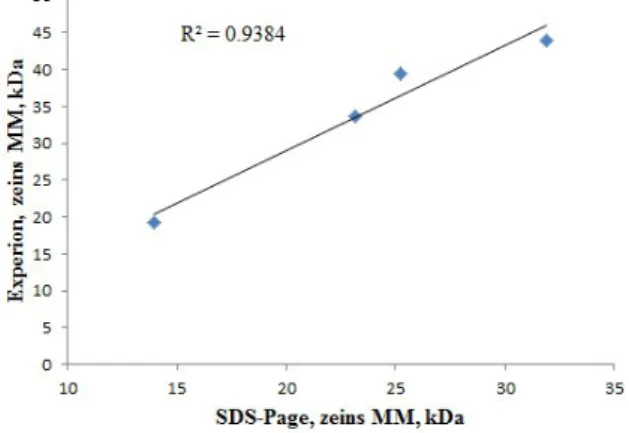
the zeins’ positions in chip electrophoresis (Figure 2). It is evident that MWs is a relative measure, and zeins apparent MWs in chip electrophoresis are heavier in average 10.5 kDa (between 5.3 and 14.3 kDa). These discrepancies are explained by the absence of solid matrix (gel) and its resistance in chip electrophoresis (Brandová and Matejová, 2008; da Silva et al., 2013). Besides, Esen (1986) and Cabra et al. (2006) consider that zeins’ MWs can be influenced by gel matrix, molecular markers used, and technique resolution in SDS-PAGE electrophoresis.
The use of chip electrophoresis in zeins separation was validated through the analysis of sample separation reproducibility, showing the method’s high sensitivity and accuracy, R2 = 0.99 (Figure 3), and allowing us to use the technique in the analysis of zein polymorphism. Chip electrophoresis presents over SDS-PAGE other advantages, like the quantitative interpretation of results, which can be displayed in a virtual
electrophoregram or chromatogram (Bio-Rad, 2010; da Silva et al., 2013). Previously mentioned advantages motivated us to use this technique for the first time in the analysis of LRs zein patterns.
Analysis of ideotype population structure using zein polymorphism
Zeins were extracted according to Righetti et al. (1977), from 50 kernels per accession, to obtain the specific zein patterns for analyzes of ideotypes structure. In all the analysis, Wilson’s (1991, 1992) zein nomenclature system improved by Wu et al. (2012) was used, classifying zeins according to its relative MW. This zeins’ classification system allows patterns comparison, obtained through both electrophoresis techniques (Figure 4).
Figure 1. Comparison of zein pattern obtained from commercial extract (Sigma), using SDS-PAGE 12% gel and chip electrophoresis. M - LMW Marker (SDS-PAGE); L - Ladder Pro260 (chip electropho-resis); 1 - commercial zein.
Figure 2. The linearity of zein fractions relative molecular weights determined by SDS-PAGE and Experion chip electrophoresis, using commercial Zein extracts (Sigma). Four and ten zein bands were detected by each method, respectively. SDS-PAGE gel uses 123.5 μg and Experion microchip use 24.7 μg of zein.
Figure 3. Evaluation of the reproducibility of chip electrophore-sis using the zein extract of one individual seed from the initial population of ISOP 0061. The variation of molecular weights of 6 original zein bands in 5 electrophoretic runs is presented and used to evaluate method sensitivity and reproducibility.
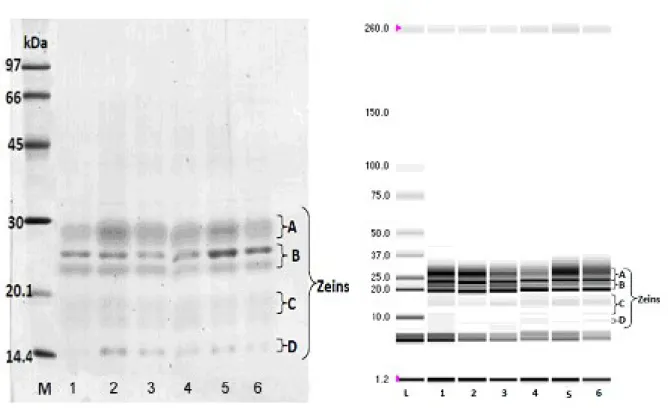
Figure 4. Separation of zein and identification of zein fractions using SDS-PAGE 12% gel (left image) and Chip electrophoresis virtual gel (right image). M – LMW Marker (SDS-PAGE); L – Ladder pro260 (chip electrophoresis); 1 – ISOP 0070.10; 2 - ISOP 0070.1.12; 3 – ISOP 0070.2.12; 4 – ISOP 0061.97; 5 – ISOP 0061.03 and 6 – ISOP 0061.13.
Electrophoregrams were used to determine the number of fractions and composition of zein patterns present in the initial population of ideotypes (ISOP 0070 and ISOP 0061), and their accessions obtained by field multiplication (ISOP 0070.1.12; ISOP 0070.2.12; ISOP 0061.03 and ISOP 0061.13). SDS-PAGE electrophoresis separated 14 and 16 bands, composing the zein patterns of ISOP 0061 and ISOP 0070 populations, respectively, showing a range of MWs between 13.5 and 31.1 kDa. According to their MWs and electrophoretic mobility, these bands belong to δ- zeins (2 bands each), β- zeins (2 and three bands for ISOP 0061 and ISOP 0070, respectively), α- bands (4 and five bands) and γ- bands (6 bands each). Sidorova et al. (2000), using a similar technique, identified between 12 and 22 leading bands in the zein pattern of random samples from inbred maize lines and local cultivars.
The chip electrophoresis detected a wider than in the SDS-PAGE electrophoresis, zein polymorphism, with the identification of 28 and 32 zeins bands in the zein patterns of ISOP 0061 and ISOP 0070, respectively. The absolute variation of MWs range between 9.5 to 45.1 kDa. The overall MWs differences of common zeins’ between SDS-PAGE and chip electrophoresis ranges, between 1.8 and 8.9 kDa (ISOP 0061) or 3.0 and 7.2 kDa (ISOP 0070). These differences in the
MWs of individual zeins are shown in table 3. The bands composing zein patterns have been preliminary classified as δ- zeins (5 bands in both ideotypes), β- zeins (4 bands in both ideotypes), α- bands (6 and 8 bands, in the ISOPs 0061 and 0070, respectively) and γ- bands (11 and 14 bands, in the ISOPs 0061 and 0070, respectively). Higher zein polymorphism detected by chip electrophoresis can be explained by the method’s higher resolution, allowing the detection of several bands expressed in low protein quantity by minor zein alleles, and the separation of proteins with low MWs variation, for example, zeins with 18.3 and 18.9 kDa in the ISOP 0061. The chip electrophoresis allowed detecting 6 γ-bands that we consider to be close to SDS-PAGE 50 kDa γ- zein described by Wu et al. (2012). The observed polymorphism of the zeins patterns have the same dimension as the polymorphism (30 zeins bands) detected using isoelectrofocusing electrophoresis (Sidorova et al., 2000), but less than the 41 isoforms or 59 isoforms detected by chromatography or 2D electrophoresis (Wilson 1986; Consoli and Damerval, 2001). Also, other zeins patterns analysis, using isoelectrofocusing (Righetti et al., 1997), liquid chromatography (Wilson, 1991), or capillary electrophoresis (Olivieri et al., 1999), allowed to split
the six Wilsons’ zein classes or Wu fractions into 31 protein bands. Early, Freitas et al. (2004) identified 16 zeins, with MW ranging from 10 to 28 kDa, using SDS-PAGE, or 20 zein by acid separation (Acid-PAGE) among 43 maize populations of Madeira.
The PIC values, alleles’ weight and frequency of zein patterns initial populations, and their progenies
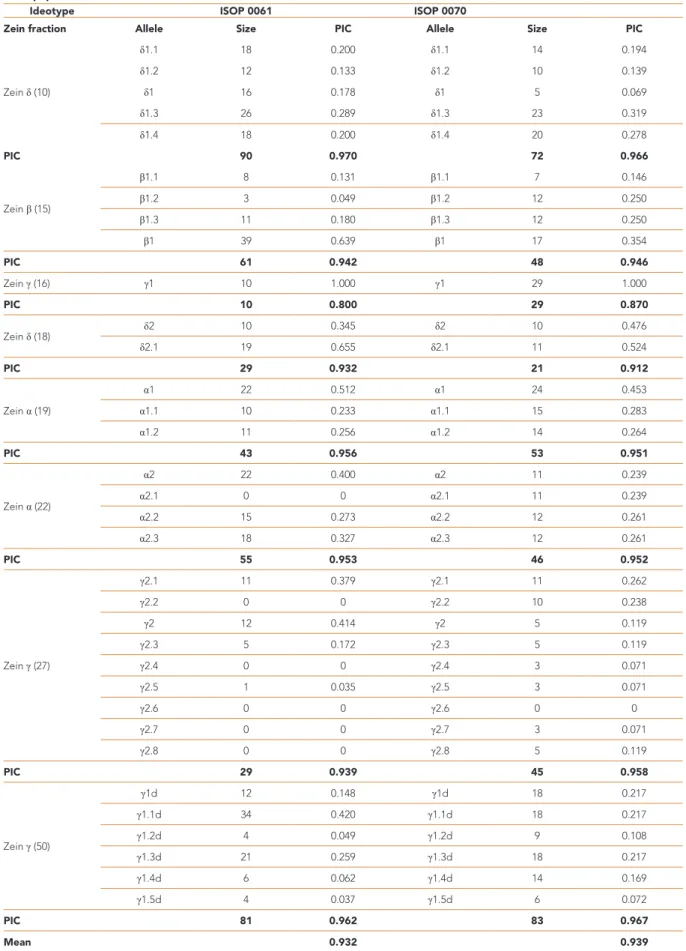
derived from multiplication were used to analyze the LR ideotypes’ genetic structure (Table 4). The summary PIC value for the ISOP 0061 initial population was 0.932 and 0.940 for the ISOP 0070, showing a high polymorphism and agreeing with these populations open-pollination and landrace nature. Zein pattern of ideotypes shows to be composed by the same zein fractions (δ-, β-,
Table 3. The ISOPs 0061 and 0070 zein patterns, based on the analysis of their initial population. The table shows zein fractions, alleles, and molecular weights (MWs), and MWs differences between lab-on-a-chip Experion and SDS-PAGE electrophoresis. Zein fractions were classified according to Wilson (1991) nomenclature system, modified by Wu et al. 2012.
Zein
fraction ISOP 0061 N# alleles alleles
Experion: MW, kDa MW differences, kDa ISOP 0070 N# alleles alleles Experion: MW, kDa MW differences, kDa Zein δ (10) 5 δ1.1 9.5±0.3 – 5 δ1.1 9.6±0.3 – δ1.2 10.5±0.2 – δ1.2 10.7±0.4 – δ1 12.1±0.3 – δ1 11.9±0.3 – δ1.3 13.3±0.3 – δ1.3 13.3±0.3 – δ1.4 14.1±0.3 – δ1.4 14.2±0.3 – Zein β (15) 4 β1.1 15.3±0.4 1.8 4 β1.1 15.4±0.3 – β1.2 16.5±0.2 – β1.2 16.6±0.3 3.0 β1.3 18.0±0.3 – β1.3 18.2±0.3 3.4 β1 18.8±0.3 4.1 β1 18.6±0.2 3.7 Zein γ (16) 1 γ1 19.6±0.25 – 1 γ1 19.3±0.3 – Zein δ (18) 2 δ2 20.9±0.4 3.2 2 δ2 20.7±0.4 3.2 δ2.1 22.0±0.3 3.5 δ2.1 21.7±0.3 3.0 Zein α (19) 3 α1 23.0±0.4 4.0 3 α1 22.9±0.3 – α1.1 24.1±0.2 4.1 α1.1 23.8±0.3 4.6 α1.2 25.3±0.4 3.5 α1.2 24.8±0.3 – Zein α (22) 3 α2 26.6±0.3 4.2 4 α2 26.1±0.2 4.3 α2.1 – – α2.1 26.9±0.3 4.5 α2.2 27.7±0.2 4.0 α2.2 27.8±0,3 4.3 α2.3 28.9±0.4 – α2.3 28.8±0.3 – Zein γ (27) 4 γ2.1 30.0±0.4 4.8 7 γ2.1 29.8±0.3 – γ2.2 – – γ2.2 30.8±0.3 5.4 γ2 31.2±0.4 5.1 γ2 31.8±0.2 – γ2.3 32.3±0.2 4.7 γ2.3 – – γ2.4 – – γ2.4 32.9±0.2 5.2 γ2.5 34.6±0.4 5.8 γ2.5 34.1±0.3 5.9 γ2.6 – – γ2.6 – – γ2.7 – – γ2.7 36.3±0.5 6.3 γ2.8 – – γ2.8 38.2±0.5 7.2 Zein γ (50) 6 γ1d 39.3±0.4 8.9 6 γ1d 39.7±0.4 – γ1.1d 40.3±0.3 – γ1.1d 40.7±0.2 – γ1.2d 41.2±0.2 – γ1.2d 41.7±0.3 – γ1.3d 43.0±0.4 – γ1.3d 43.0±0.4 – γ1.4d 43.8±0.2 – γ1.4d 44.2±0.4 – γ1.5d 44.6±0.4 – γ1.5d 45.1±0.3 –
Table 4. Summary of polymorphic information content and allelic weight (frequencies) of zein pattern of ISOPs 0061 and 0070 ideotypes initial populations.
Ideotype ISOP 0061 ISOP 0070
Zein fraction Allele Size PIC Allele Size PIC
Zein δ (10) δ1.1 18 0.200 δ1.1 14 0.194 δ1.2 12 0.133 δ1.2 10 0.139 δ1 16 0.178 δ1 5 0.069 δ1.3 26 0.289 δ1.3 23 0.319 δ1.4 18 0.200 δ1.4 20 0.278 PIC 90 0.970 72 0.966 Zein β (15) β1.1 8 0.131 β1.1 7 0.146 β1.2 3 0.049 β1.2 12 0.250 β1.3 11 0.180 β1.3 12 0.250 β1 39 0.639 β1 17 0.354 PIC 61 0.942 48 0.946 Zein γ (16) γ1 10 1.000 γ1 29 1.000 PIC 10 0.800 29 0.870 Zein δ (18) δ2 10 0.345 δ2 10 0.476 δ2.1 19 0.655 δ2.1 11 0.524 PIC 29 0.932 21 0.912 Zein α (19) α1 22 0.512 α1 24 0.453 α1.1 10 0.233 α1.1 15 0.283 α1.2 11 0.256 α1.2 14 0.264 PIC 43 0.956 53 0.951 Zein α (22) α2 22 0.400 α2 11 0.239 α2.1 0 0 α2.1 11 0.239 α2.2 15 0.273 α2.2 12 0.261 α2.3 18 0.327 α2.3 12 0.261 PIC 55 0.953 46 0.952 Zein γ (27) γ2.1 11 0.379 γ2.1 11 0.262 γ2.2 0 0 γ2.2 10 0.238 γ2 12 0.414 γ2 5 0.119 γ2.3 5 0.172 γ2.3 5 0.119 γ2.4 0 0 γ2.4 3 0.071 γ2.5 1 0.035 γ2.5 3 0.071 γ2.6 0 0 γ2.6 0 0 γ2.7 0 0 γ2.7 3 0.071 γ2.8 0 0 γ2.8 5 0.119 PIC 29 0.939 45 0.958 Zein γ (50) γ1d 12 0.148 γ1d 18 0.217 γ1.1d 34 0.420 γ1.1d 18 0.217 γ1.2d 4 0.049 γ1.2d 9 0.108 γ1.3d 21 0.259 γ1.3d 18 0.217 γ1.4d 6 0.062 γ1.4d 14 0.169 γ1.5d 4 0.037 γ1.5d 6 0.072 PIC 81 0.962 83 0.967 Mean 0.932 0.939
α- and γ- zeins), but with different zeins’ frequencies (Table 4). The ISOP 0061 zein pattern differs from ISOP 0070 in 7 zein bands (2 specific and five absent zein). Specific bands for ISOP 0061 ideotype pattern seem to be banded with MWs of 32.3 and 35.7 kDa, when ISOP 0070 showed five specific zeins, with MWs of 26.9, 30.8, 32.9, 36.3 and 38.2 kDa. The proportion between specific and leading zein bands allow us to establish a specific zein pattern for each LR ideotype that can be used in their recognition. In this sense, the comparison of both ideotypes patterns shows that zein fractions with higher variability were α- and γ- zeins. Variation in the expression of several zein alleles was detected in both ideotypes (Tables 3 and 4). Multiplied accessions presented a slightly decrease of PIC values (< 0.010), showing that high polymorphism of zein fractions and their weight or frequency of alleles was not compromised by genebank management actions (data not shown).
These features of zein patterns of accessions’ individual seeds were used to estimate the number of genotypes in LRs ideotypes and detect changes that could occur on their zein and genotype frequency, during genebank management actions. The initial populations of ISOP 0061 and ISOP 0070 were composed of 14 and 18 different genotypes, respectively. The genotypes identification was performed, based on the set of common zeins present in individual seeds (see Sidorova et al., 2000). The high number of genotypes composing the ideotypes genetic background agrees with the LRs and open-pollination status of these populations. Large genotype numbers were also detected in other crop local populations or cultivars (Sidorova et al., 2000). The ISOP 0061 shows less genotype heterogeneity than ISOP 0070, whereas genotypes with higher frequency were detected. The frequency of the primary genotype was present in 15.7% (ISOP 0061) and 17.3% of the seeds (ISOP 0070), respectively. However, the five more frequent genotypes can be detected in 66.7% of the seeds in ISOP 0061, while in ISOP 0070 reaches only 57.7% (data not shown). The data summarized in Tables 3 and 4 show that the genetic structure of both LR ideotypes is quite distinct (Table 5). These zein pattern features allow us to propose a specific LRs genotype formula that can be used in accessions identification and quality control. Overall, the results confirm that the ideotype of “Milho Santana” (ISOP 0070) is more polymorphic than the ideotype of “Milho da Terra” (ISOP 0061). This polymorphism can be explained by the distinct origin and evolution of these LRs (Pinheiro de Carvalho et al., 2008) and has resulted from the multiple zein structural genes expression (Boston and Larkins, 2009;
Feng et al., 2009). The similarity between zein pattern and genotype frequency variation in initial populations and multiplication accessions was also analyzed. The cluster analysis using Pearson’s correlation coefficient showed that 54% of the individual seeds have a similarity higher than 85% in both ideotypes, with the lower limit of similarity reaching 71.2 and 60.5% in the ISOPs 0061 and 0070, respectively. The comparison of zein patterns of multiplication accessions and initial population shows that total number of genotypes decreases (see above), and the lower limit similarity of analyzed individual seeds decreases to 46 and 44% in ISOP 0061 and 0070, respectively. The decrease in the number of genotypes results from the disappearance of genotypes with the lowest frequency (2 to 5%) detected in initial populations and the increase in weight of most representative genotypes. These results seem to be contradictory, pointing out to the decrease of the heterogeneity of zein pattern and the introduction of some bottleneck in the accessions genetic variability. On the other hand, the increase of dissimilarity between individual seeds was observed. The obtained data shows that management actions introduce some drift in the genetic structure of LRs accessions, which need to be deeper evaluated and understood. However, the overall results prove that the accessions in the genebank were correctly sampled and maintained.
Conclusions
The present work provides a morphological and biochemical characterization of the ideotypes of maize landraces from Madeira, e.g., “Milho Santana” (ISOP 0070) and “Milho da Terra” (ISOP 0061). The results show that LRs can be segregated by ten morpho-agronomic traits and have different grain features, but similar grain mass and weight. On the grain biochemical composition significant differences were detected in starch, but lower than expected in total zein content, that has not varied and is not influenced by the genebank management actions. The zein pattern electrophoretic analysis was validated for microchip techniques by comparison with the standard SDS-PAGE and showed to have good reproducibility, higher sensitivity and resolution. The high polymorphism of
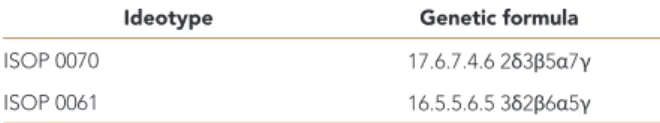
Table 5. The genotype formula determined for “Milho da Terra” (ISOP 0061) and “Milho Santana” (ISOP 0070) LRs ideotypes. The formula includes a numeric code, with the number of major and specific zein bands present in the ideotypes’ genotypes, its three levels of frequencies, and several alleles by zein fraction.
Ideotype Genetic formula
ISOP 0070 17.6.7.4.6 2δ3β5α7γ
zein pattern was demonstrated and is composed of four fractions and 28 (ISOP 0061) or 32 (ISOP 0070) zein alleles. The genotype frequency allowed to determine LRs structure and establish their genetic formula based on zein pattern specificity. The method allows us to analyze random samples of accessions, composed of 50 and more individual’s seeds, which is useful to screen genebank accessions, facilitating their recognition and quality control, during management actions
Acknowledgments
The authors are grateful to all staff of ISOPlexis Gene bank for support and access to laboratory facilities. This work got the funding support from the Programa Operacional da Região Autónoma da Madeira (PO Madeira) 14-20, contract CASBio, refª. M1420-01-0145-FEDER-000011.
References
Bellon MR, Berthaud J, Smale M, Aguirre JA, Taba S, Aragón F, Díaz J, Castro H, 2003. Participatory landrace selection for on-farm conservation: An example from the Central Valleys of Oaxaca, Mexico. Genet Resour Crop Ev 50: 401–416 Bio-Rad, 2002. Fingerprinting II Informatix TM
software: User guide, version 3.0
Bio-Rad 2010. Experion TM Pro260 analysis kit: Instruction manual
Bradová J, Matějová E, 2008. Comparison of the results of SDS PAGE and chip electrophoresis of wheat storage proteins. Chromatographia 67: S83-S88
Boston RS, Larkins BA, 2009. The Genetics and Biochemistry of Maize Zein Storage Proteins. “Maize Handbook. Genetics and Genomics”, pp715-730 Bennetzen JL, Hake S. Springer Science, New York
Brandolini A, 1969. Maize. In Frankel OH, Bennett E, eds, Genetic Resources in Plants: Their Exploration and Conservation. Blackwell Scientific Publications, Oxford, UK, pp 273–309 Brandolini A, Brandolini A, 2001. Classification
of Italian maize (Zea mays L.) germplasm. Plant Genet Resour Newsl 126: 1–11
Cabra V, Arreguin R, Vazquez-Duhalt R, Farres A, 2006. Effect of temperature and pH on the secondary structure and processes of oligomerization of 19 kDa alpa-zein. Biochim Biophys Acta 1764: 1110-1118
Camacho Villa TC, Maxted N, Scholten M, Ford-Lloyd B, 2006. Defining and identifying crop landraces. Plant Genetic Resour 3(3): 373–384 Consoli L, Damerval C, 2001. Quantification
of individual zein isoforms resolved by two-dimensional electrophoresis: Genetic variability in 45 inbred maize lines. Electrophoresis 22: 2983–2989
Costa-Rodrigues L, 1971. Races of maize in Portugal. Agron Lusit 31: 239–248
da Silva EM, dos Santos TMM, Ganança JFT, Slaski JJ, Pinheiro de Carvalho MÂA, 2013. Microchip electrophoretic analysis of phaseolin patterns and its comparison with currently used SDS-PAGE techniques. Chromatographia 76: 1163–1169
Eschholz TW, Stamp P, Peter R, Leipner J, Hund A, 2008. Genetic structure and history of Swiss maize (Zea mays L. ssp. mays) landraces. Genet Resour Crop Ev 55: 971-983
Esen A, 1986. Separation of Alcohol-Soluble Proteins (Zeins) from Maize into Three Fractions by Differential Solubility. Plant Physiol 80: 623-627
Esen A, 1987. Proposed nomenclature for the alcohol-soluble proteins (zeins) of maize (Zea
mays L.). J Cereal Sci 5: 117-128
Feng L, Zhu J, Wang G, Tang Y, Chen H, Jin W, Wang F, Mei B, Xu Z, Song R, 2009. Expressional profiling study revealed unique expressional patterns and dramatic expressional divergence of maize a-zein supergene family. Plant Mol Biol 69: 649–659
Freitas LR, Ganança F, dos Santos TMM, Pinheiro de Carvalho MÂA, Motto M, Clemente Vieira MR, 2004. Evaluation of maize germplasm based on zein protein polymorphism from the Archipelago of Madeira. Maydica 50: 105-112 GE Healthcare, 2006. Amersham low molecular
weight calibration kit for SDS electrophoresis Geric I, Zlokolica M, Geric C, Stuber CW, 1989.
Isoenzyme variation and genetic diversity. Races and populations of maize in Yugoslavia. IBPGR. Rome: 1-108
Gouveia CSS. Avaliação de Recursos Genéticos Agrícolas: Análise nutricional e anti-nutricional de variedades regionais de feijão (Phaseolus
vulgaris L.). Tese de Mestrado. Universidade da
Madeira, Funchal, 2011
Holding DR, Larkins BA, 2009. Zein storage proteins, V63 Molecular Genetic Approaches to Maize Improvement. Kriz AL, Larkins BA eds. Springer-Verlag Berlin Heidelberg, Germany Ignjatovic-Micic D, Kostadinovic M, Bozinovic S,
Andjelkovic V, Vancetovic J, 2013. High grain quality accessions within a maize drought tolerant core collection. Sci Agric 71(5): 345-355
Konarev VG, Gavrolyuk IP, Gubareva NK, Peneva TI, 1979. Seed proteins in genome analysis, cultivar identification, and documentation of cereal genetic resources: A review. Cereal Chem 56(4): 272-278
Laemmli UK, Favre M, 1973. Maturation of the head of bacteriophage T4-I.DNA packaging events. J Mol Biol 80: 575-599
Li JS, Vasal SK, 2004. “Maize: quality protein maize,” Encyclopedia of Grain Science. Wrigley C, Corke H, Walker CE eds. Elsevier Academic Press, New South Wales, Australia
Motto M, Hartings H, Fracassetti M, Consonni G, 2011. Grain quality-related traits in maize: gene identification and exploitation. Maydica 56: 291-314
Newton AC, Akar T, Baresel JP, Bebeli PJ, Bettencourt E, Bladenopoulos KV, Czembor JH, Fasoula DA, Katsiotis A, Koutis K, Koutsika-Sotiriou M, Kovacs G, Larsson H, Pinheiro de Carvalho MAA, Rubiales D, Russell J, dos Santos TMM, Vaz Patto MC, 2010. Cereal landraces for sustainable agriculture. A review. Agron Sustain Dev 30: 237–269
Nucca R, Soave C, Motto M, Salamini F, 1978. Taxonomic significance of the zein isoelectric focusing pattern. Maydica 23: 239-249
Olivieri E, Viotti A, Lauria M, Simò-Alfonso E, Righetti PG, 1999. Variety identification in maize lines via capillary electrophoresis of zeins in isoelectric acidic buffers. Electrophoresis 20: 1595-1604
Perales HR, Brush SB, Qualset CO, 2003. Landraces of maize in central Mexico: An altitudinal transect. Econ Bot 57(1): 7–20
Pinheiro de Carvalho MÂA, Slaski JJ, Abreu I, Ganança FT, dos Santos TMM, Freitas L, Clemente Vieira MR, Nunes A, Domingues A, Taylor GJ, 2004. Factors contributing to the development of aluminum resistance in the Madeiran maize germplasm. J Plant Nutr Soil Sc 167: 93-98
Pinheiro de Carvalho MÂA, Ganança JFT, Abreu I, Sousa NF, dos Santos TMM, Clemente Vieira MR, Motto M, 2008. Evaluation of the maize (Zea mays L.) diversity on the Archipelago of Madeira. Genet Resour Crop Ev 55: 221-233 Pinheiro de Carvalho MÂA, Bebeli PJ, Bettencourt
E, Costa G, Dias S, dos Santos TMM, Slaski JJ, 2013. Cereal landraces genetic resources in worldwide GeneBanks. Agron Sustain Dev 33(1): 177-203
Pollak, LM, 2003. The history and success of the public-private project on Germplasm
Enhancement of Maize GEM. Adv Agron. 78:45–87
Pratt RC, Paulis JW, Miller K, Nelsen T, Bietz JA, 1995. Association of zeins classes with kernel hardness. Cereal Chem 70(2): 162-167
Rebourg C, Gouesnard B, Welcker C, Dubreuil P, Chastanet M, Charcosset A, 2003. Maize introduction into Europe: the history reviewed in the light of molecular data. Theor Appl Genet 106: 895–903
Righetti PG, Gianazza E, Viotti A, Soave C, 1977. Heterogeneity of storage proteins in maize. Planta 136: 115-123
Scrob S, Muste S, Has I, Muresan C, Socaci S, Farcas A, 2014. The Biochemical Composition and Correlation Estimates for Grain Quality In Maize. J Agroaliment Proc Technol 20(2): 150-155
Sidorova VV, Matveeva GV, Timofeeva GI, 2000. Identification, analysis, and registration of maize varieties, lines, and hybrids by electrophoresis and isoelectrofocusing of zein. “Identification of Varieties and Registration of the Genefond of Cultivated Plants by Seed Proteins,” pp 73-89 Konarev VG eds. Russian Academy of Agricultural Sciences, NI Vavilov VIR All-Russian Institute of Plant Genetic Resources, St. Petersburg
Skevas T, Fevereiro P, Wesseler J, 2010. Coexistence regulations and agriculture production: A case study of five Bt maize producers in Portugal. Ecol Econ 69: 2402-2408 White PJ, Johnson, LA, 2003. Corn: chemistry and technology. American Association of Cereal Chemists
Wilson CM, 1991. Multiple zeins from maize endosperms characterized by reversed-phase high-performance liquid chromatography. Plant Physiol 95: 777-786
Wilson CM, 1992. Zein diversity in Reid, Lancaster, and Illinois chemical corn strains revealed by isoelectric focusing. Crop Sci 32: 869-873 Wu Y, Wang W, Messing J, 2012. Balancing of
sulfur storage in maize seed. BMC Plant Biol 12: 77
Yang Z, Rao IM, Horst WJ, 2013. Interaction of aluminum and drought stress on root growth and crop yield on acid soils. Plant Soil 372: 3–25.
Abbreviations asl – above sea level; DW – dry weight
ECD – ear central diameter EL – ear length
GMOs – genetically modified organisms ISOP – accession number
KF – kernel fibers
KOM – kernel organic matter KS – kernel size
KSM – kernel specific mass KSt – kernel starc
KSW – kernel specific weight KTL – kernel total lipids KTM – kernel total minerals
KTP – kernel total proteins KV – kernel volume KW – weight of 100 kernels LA – leaf area
LRs – landraces
MSC – Multiplicative Scatter Correction MW – molecular weights
NIRS – Near Infra-Red Spectroscopy NKR – number of kernels per row NL – number of leafs
PH – plant height PHI – plant height index
PIC – Polymorphism Information Content SNV – Standard Normal Variate