PAPER accepted for publication in the Deep Sea Research II issue on the “US GEOTRACES North Atlantic Transect”
Oxygen and Hydrogen isotope signatures of Northeast Atlantic Water Masses
Antje H. L. Voelker1,2*, Albert Colman3, Gerard Olack3, Joanna J. Waniek4, David Hodell5 1: Divisão de Geologia e Georecursos Marinhos, Instituto Português do Mar e da Atmosfera (IPMA), Avenida de Brasília 6, 1449-006 Lisboa, Portugal2: CIMAR Associated Laboratory, Rua dos Bragas 289, 4050-123 Porto, Portugal 3: Department of the Geophysical Sciences, The University of Chicago, Chicago, USA
4: Leibniz-Institut für Ostseeforschung Warnemünde, Seestrasse 15, 18119 Rostock, Germany 5: Godwin Laboratory for Palaeoclimate Research, Department of Earth Sciences, University of Cambridge, Cambridge, UK
* corresponding author: [email protected]
Abstract
Only a few studies have examined the variation of oxygen and hydrogen isotopes of seawater in NE Atlantic water masses, and data are especially sparse for intermediate and deep-water masses. The current study greatly expands this record with 527 δ18O values from 47 stations located
throughout the mid- to low-latitude NE Atlantic. In addition, δD was analyzed in the 192 samples collected along the GEOTRACES North Atlantic Transect GA03 (GA03_e = KN199-4) and the 115 Iberia-Forams cruise samples from the western and southern Iberian margin. An intercomparison study between the two stable isotope measurement techniques (cavity ring-down laser spectroscopy and magnetic-sector isotope ratio mass spectrometry) used to analyze GA03_e samples reveals relatively good agreement for both hydrogen and oxygen isotope ratios. The surface (0-100 m) and central (100-500 m) water isotope data show the typical, evaporation related trend of increasing values equatorward with the exception for the zonal transect off Cape Blanc, NW Africa. Off Cape Blanc, surface water isotope signatures are modified by the upwelling of fresher Antarctic Intermediate Water (AAIW) that generally has isotopic values of 0.0 to 0.5‰ for δ18O and 0 to 2‰ for δD. Along the Iberian margin the Mediterranean Outflow Water (MOW) is clearly distinguished by its high δ18O (0.5-1.1‰) and δD (3-6‰) values that can be traced into the open Atlantic. Isotopic values in the NE Atlantic Deep Water (NEADW) are relatively low (δ18O: –0.1 to 0.5‰; δD: –1 to 4‰) and show a broader range than observed previously in the northern and southern convection areas. The NEADW is best observed at GA03_e Stations 5 and 7 in the central NE Atlantic basin. Antarctic Bottom Water isotope values are relatively high indicating modification of the original Antarctic source water along the flow path. The reconstructed δ18O-salinity relationship for the complete data set has a slope of 0.51, i.e. slightly steeper than the 0.46 described previously by Pierre et al. (1994) for the tropical to subtropical Northeast Atlantic. This slope decreases to 0.46 for the subtropical North Atlantic Central Water (NACW) and the MOW and to 0.32 for the surface waters of the upper 50 m. The δD-salinity mixing lines have estimated slopes of 3.01 for the complete data, 1.26 for the MOW, 3.47 for the NACW, and 2.63 for the surface waters. The slopes of the δ18O-δD relationship are
significantly lower than the one for the Global Meteoric Water Line with 5.6 for the complete data set, 2.30 for the MOW, 4.79 for the NACW, and 3.99 for the surface waters. The lower
slopes in all the relationships clearly reflect the impact of the evaporation surplus in the subtropics.
Keywords: oxygen isotopes, hydrogen isotopes, NE Atlantic, Mediterranean Outflow Water, GEOTRACES
1. Introduction
High precision stable isotope (δ18O, δD) analyses of fresh and ocean water were first discussed by Epstein and Mayeda (1953) and Friedman (1953). Craig and Gordon (1965) later showed that δ18O can be used as a water mass tracer and that the δ18O-salinity relationship follows a slope of 0.61 in the surface waters of the high-latitude North Atlantic and thus the North Atlantic Deep Water (NADW) but changes to a slope of 0.22 in the surface waters of the subtropical North Atlantic or even 0.11 in the Atlantic’s equatorial trough. Subsequent studies focused on specific regions (e.g., Fairbanks, 1982; Van Donk and Mathieu, 1969; Weiss et al., 1979) and a global study of seawater stable isotope transects and vertical profiles was made by the GEOSECS program (Östlund et al., 1987). Although the GEOSECS program provided the first global data set, the spatial coverage was limited. In the North Atlantic south of the Greenland-Iceland-Scotland ridge, six vertical stations covered the complete water column, but only Station 115 at 28°N and 26°W was located in the eastern basin. After the GEOSECS program a major gap followed in seawater stable isotope studies. In the last two decades, however, various studies provided new δ18O data that focused on high latitude regions and the influence of meltwater in the Atlantic sector (e.g., Azetsu-Scott and Tan, 1997; Bauch et al., 1995; Cox et al., 2010; Mackensen, 2001; Meredith et al., 1999a; Meredith et al., 1999b), the NW African upwelling region off Cape Blanc (Pierre et al., 1994: Fig. 1b) and the Mediterranean Sea (Pierre, 1999). Pierre et al. (1994) proposed a slope of 0.46 for the δ18O-salinity mixing line
for the waters of the tropical to mid-latitude North Atlantic. In the Mediterranean Sea basin with its excess evaporation the slope is lower varying from 0.25 to 0.27 (Pierre, 1999).
Data on the intermediate to deep waters in the North Atlantic remained sparse until the study of Frew et al. (2000) who analyzed vertical δ18O profiles from stations in the North Atlantic’s subpolar gyre. The authors found a mixing slope of 0.62 that matches the one of Craig and Gordon (1965), but could also show that Northeast Atlantic Deep Water (NEADW; 0.22‰) can be distinguished isotopically from the bottom waters in the Northwest Atlantic (0.13‰) owing to different formation and mixing processes. Furthermore, they were able to trace the signature of the more saline Mediterranean Outflow Water (MOW) as an isotopically relative higher value (0.3‰) at a water depth of 800 m in their easternmost station at 51.75°N 20°W. Bigg and Rohling (2000) used the global data base compiled by Schmidt et al. (1999) and related a break in the slope of the mixing line at 36.5 to the high salinity waters of the Mediterranean Sea with the slope above this salinity value being less steep.
In regions with excess evaporation the slope of the δ18O (or δD)-salinity mixing line or the δ18O-δD relationship strongly diverges from the global slope (Bigg and Rohling, 2000) or the Global Meteoric Water Line (Craig and Gordon, 1965) as clearly demonstrated by Gat et al. (1996) for the eastern Mediterranean Sea. Gat et al. (1996) showed that is important to understand the regional mixing lines because the isotopic signals observed in the surface waters impact the isotopic range of the marine moisture and the subsequent precipitation over the sea and land (e.g., Gat, 1996; Benetti et al., 2014). Conditions in the Mediterranean Sea are highly relevant for our study because deep convection, in particular in the eastern basin, form the intermediate to deep-water masses that contribute to the deep outflow from the Mediterranean
Sea feeding into the MOW. The MOW plays an important role for the North Atlantic’s overturning circulation because the excess salt it exports into the North Atlantic contributes to increase the density in the convection areas of deep-water formation (Bigg et al., 2003).
In the last six decades, the world oceans experienced changes that also affect the hydrological cycle. As a consequence of the increased salinity in the surface waters of evaporation dominated regions, such as the Atlantic’s subtropical gyres, and enhanced freshening in precipitation dominated regions the global hydrological cycle was intensified (Durack et al., 2012). Salinity changes were not restricted only to the surface ocean but also affected deeper levels. In the northeastern Atlantic higher salinities at the 1000-dbar level are linked to MOW enhancement and spreading along the southern pathways (Curry et al., 2003; Durack and Wijffels, 2010). Freshening and equatorward spreading of this signal is observed in the Antarctic Intermediate Water (AAIW) and Upper Circumpolar Deep Water (UCDW) (Curry et al., 2003). Likewise, deep waters formed in the northern hemisphere, such as the Central Labrador Sea Water (CLSW), are freshening (Durack and Wijffels, 2010).
Changes in the hydrological cycle are also relevant for paleoclimate studies. In the last years, δ18O and δD data have gained increasing importance in paleoclimate studies, in particular
for the hydrological cycle, and have been incorporated into global climate models (LeGrande and Schmidt, 2009; Roche and Caley, 2013; Schmidt, 1998; Schmidt et al., 2007). Understanding isotopic changes in precipitation is particularly relevant for ice core and speleothem studies (e.g., Masson-Delmotte et al., 2005, 2010; Cai et al., 2010; Cheng et al., 2013). Furthermore, seawater δ18O data are essential for the calibration of the δ18O signal of foraminiferal calcite (e.g., Kohfeld
et al., 1996; Mulitza et al., 2003; Ortiz et al., 1996; Peeters et al., 2002; Wilke et al., 2009) that is
used extensively in paleoceanographic studies. Ecological or climate models evaluating the relationship between foraminiferal calcite and water isotopes rely on seawater isotope data as input or for comparison (Caley and Roche, 2013; Paul et al., 1999; Schmidt, 1999; Schmidt and Mulitza, 2002).
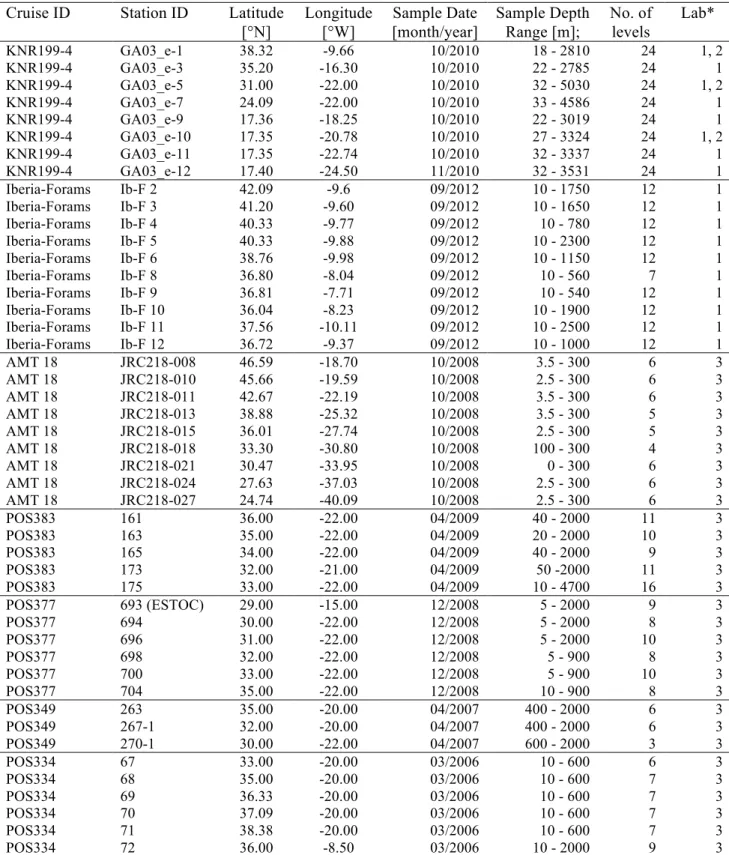
In the Northeast Atlantic most water masses have been altered by mixing, especially in the depths below the permanent thermocline, and isotopic values likely diverge from the ones found at the source of a particular water mass. Given the dearth of stable isotope data for NE Atlantic water masses and the MOW we analyzed seawater samples collected during several cruises occurring during the years from 2006 to 2012 (Table 1). The data set presented here includes stable isotope data for 527 levels from 47 stations (Fig. 1, Table 1), of which only 41 data points have been published previously (Voelker et al., 2009).
2. Sample Stations and Hydrographic Setting
Corresponding δ18O and δD profiles are available for the 18 stations sampled during the
GA03_e and the Iberia-Forams (Ib-F) cruise. The GA03_e transect (US GEOTRACES Meridional and Zonal transect) was sampled during the KN199-4 cruise on R/V Knorr in October 2010 in a profile from Lisbon to the Cape Verde Islands (Fig. 1b). Because the cruise is related to the international GEOTRACES program (www.geotraces.org) and involved multi-parameter analyses (see related publications in this issue) samples were collected at 24 levels. The Iberia-Forams cruise on R/V Garcia del Cid took place in September 2012 and collected water samples at 9 stations along the western and 3 stations along the southern Iberian margin sampling up to 12 levels at each station (Voelker, 2012). The British Atlantic Meridional Transect (AMT; www.amt-uk.org) program conducts an annual cruise from the UK to the South Atlantic undertaking biological, chemical and physical oceanographic research. Samples for the seawater stable isotope study (Fig. 1b, Table 1) were gathered during the AMT-18 cruise on RRS James
Additional water samples were collected during various cruises on the German R/V Poseidon (Table 1). Most of these cruises were part of a recurring sampling program across the Azores Front in meridional transects along the longitudes of 22°W or 20°W (Fig. 1). Reoccupation of stations during different years and seasons allows the comparison of interannual and seasonal δ18O variations.
From a hydrographic point of view the study region belongs to the transitional waters and subtropical gyre of the NE Atlantic (Fig. 1a). The dominant surface-water currents are the North Atlantic Current (NAC) in the north, the Azores Current (AzC), which separates from the NAC near the Grant Banks and flows towards the east, and the Portugal (PC) and Canary Currents (CC) as the recirculating eastern boundary currents. The typically 150 km wide AzC crosses the Atlantic in large meanders between 31 and 37°N and is on its northern boundary associated with the subtropical front, the Azores Front, that reaches at least 500 m deep and is often defined by the 15°C isotherm (Klein and Siedler, 1989; Pingree, 1997; Pingree et al., 1999; Siedler and Onken, 1996; Fründt and Waniek, 2012). In the eastern basin the AzC splits into different branches, most of which recirculate equatorward and feed the CC (Siedler and Onken, 1996; Fig. 1a). The eastern branch of the AzC flows, however, into the Gulf of Cadiz (Johnson and Stevens, 2000; Peliz et al., 2005; Vargas et al., 2003) and, especially during the non-upwelling season (October-March), waters from this branch flow also along the western Iberian margin as the Iberian Poleward Current (Peliz et al., 2005). The subsurface component of the Iberian Poleward Current conveys eastern North Atlantic Central Water (NACW) of subtropical origin poleward that is formed by strong evaporation and winter cooling along the Azores Front (Rios et al., 1992). The PC, centered west of 10°W off Portugal, advects freshly ventilated surface and subsurface waters southward (Perez et al., 2001; van Aken, 2001) with the subsurface component being eastern NACW of subpolar origin (Brambilla et al., 2008; McCartney and Talley, 1982). The CC, at 500 m deep on average, flows along the NW African margin and the AzC waters are modified by the entrainment of the colder AAIW upwelled along the African margin all year-round (Knoll et al., 2002; Wooster et al., 1976).
In the intermediate depth range (500-1600 m), i.e. below the permanent thermocline formed by the NACW (van Aken, 2001), the most important water masses are the MOW and the AAIW. The warm, salty MOW is formed in the Gulf of Cadiz by mixing of Mediterranean Sea with Atlantic central and surface water. As a result of mixing the MOW splits into two cores centered at about 800 and 1200 m (Ambar and Howe, 1979) that flow as poleward undercurrents along the western Iberian margin. Facilitated by the topography (canyons, capes, seamounts) the MOW sheds many eddies (Richardson et al., 2000; Serra and Ambar, 2002). These so-called meddies greatly contribute to the MOW’s admixing into the wider North Atlantic basin and can be traced throughout the eastern North Atlantic basin (Richardson et al., 2000). Only north of 40.5°N and at depths around 1600 m can CLSW, the uppermost component of the NADW, be observed along the Iberian margin (Alvarez et al., 2004; Fiuza et al., 1998). Along the NW African margin AAIW, a relatively fresh water mass of Antarctic origin, is generally encountered between 700 and 1000 m and is the water mass upwelled in the filaments formed off Cape Ghir or Cape Blanc (Knoll et al., 2002; Mittelstaedt, 1989; Tsuchiya, 1989). Knoll et al. (2002) observed that AAIW influence is strongest during the autumn. Small amounts of AAIW have been traced as far north as the southwestern Iberian margin (Cabeçadas et al., 2003; van Aken, 2001).
Deeper in the water column NEADW and Lower Deep Water (LDW) are encountered. LDW (> 4000 m) is warmed Antarctic Bottom Water (AABW) that enters the eastern Atlantic basin through the Vema fracture zone at 11°N and the Iberian and Tagus abyssal plains partly as an intensified current through the Discovery Gap near 37°N (Saunders, 1987). The NEADW is a
mixture between Iceland-Scotland Overflow Water (ISOW), CLSW, LDW, and MOW with the contributions of LDW and MOW increasing to the south (van Aken, 2000).
Jenkins et al. (this volume) performed an Optimum MultiParameter Analysis (OMPA) water mass analysis for the stations along the GA03 transect. OMPA assesses the relative contributions of endmember water masses that have mixed to form each water sample collected. This analysis employs a least-square optimization using input values for the concentrations of a suite of conservative properties measured on the sample and defined for the endmembers (Tomczak, 1981; Jenkins et al., this volume). The OMPA data revealed that NACW occupied the depth interval between 50 and 500 m at all stations (Fig. 2 a, b) and as deep as 600 m at Station 5, i.e. within the Azores Front region. Atlantic Equatorial Water (AEW) had the strongest signal along the zonal transect through the Cape Blanc upwelling system (Stations 9-12; Fig. 1b) and was identified at water depths from 100 to 600 m (Fig. 3 a, b; Jenkins et al., this volume). Salinity profiles indicate MOW was present between 500 and 1600 m as hardly modified water mass at Station 1 on the Portuguese margin and slightly diluted at Station 3 (Fig. 2b). At Station 5 MOW contributed more than 50% to the waters around 800 m and a diluted signal can be traced south to the zonal transect stations (Jenkins et al., this volume). AAIW was encountered between 600 and 1000 m, in particular at Stations 7 to 12 (Fig. 2, 3). Minor influence is also observed between 800 and 1000 m at Station 5. All three major NADW water masses could be identified in the eastern basin as well (Jenkins et al., this volume). CLSW contributed 50-80% to the waters in the depth range of 1900 – 2500 m. Between 2500 and 3500 m, ISOW contributed 20% to the water mass signal and Denmark Strait Overflow Water (DSOW) 20% below 3500 m, in particular at Stations 5 and 7 (Fig. 2 a, b). AABW contributed 30-40% to the water masses below 4000 m at Stations 5 to 12 but less than 20% at Stations 3 and 1 (Jenkins et al., this volume).
With the absence of upwelling prior to and during the Iberia-Forams cruise (Voelker, 2012) subtropical surface and subsurface (NACW) waters were encountered along the southern and western Iberian margin down to 250 m (Fig. 4, 5). Below the subtropical NACW the lower salinities clearly depict the fresher subpolar NACW between depths of 250 to 500 m along the southwestern margin, deepening to 750 m at the northernmost station (Ib-F 2). MOW occupied the water depths between 500 and 1500 m along the western margin but reached as deep as 1600 m at Station Ib-F 11 that is located in the vicinity of GA03_e Station 1 (Fig. 1). Along the southern margin the uppermost MOW core was observed at the two eastern stations (Ib-F 8 and 9; Fig. 5). The AMT-18 hydrographic sections place the Azores Front at about 36°N based on the 15°C thermocline and steep salinity gradient (Fig. 6).
3. Methods 3.1 Sampling
During the KN199-4 cruise, samples were collected from the Niskin bottles on the ship’s CTD rosette as described in Colman and Olack (in preparation). Samples were collected into 20 ml borosilicate glass vials with polyethylene-seal, conical-insert screw caps (Kimble, no. 74516-20). Vials were stored dark and at room temperature or 4°C. Samples from GA03_e Stations 1, 5 and 10, used for the intercomparison, were split in the laboratory at U. Chicago into multiple 4 ml borosilicate vials with polyseal caps, using a pipette and minimizing the time that each sample was uncapped. The Iberia-Forams samples were filled into 10 cc glass vials that were closed with a rubber septum and a crimped aluminum cap. All samples were stored at 4°C and shipped to Cambridge within a few months after the cruise. AMT-18 and POS cruise samples were collected into 100 cc glass flasks. The flasks were sealed with ground glass stoppers after applying a thin layer of silicone grease to enable a tight fit. Stoppers were furthermore fixed with tape to avoid loosening during transport. Samples were stored in aluminum boxes at 4°C.
3.2 Stable Isotope Analyses
The samples from the KN199-4 and Iberia-Forams cruises were analyzed at the Godwin Laboratory for Palaeoclimate Research in the Department of Earth Sciences at the University of Cambridge (UK). Water oxygen and hydrogen isotopes were measured simultaneously by cavity ring-down laser spectroscopy (CRDS) using a L1102-i Picarro water isotope analyzer and A0211 high-precision vaporizer. Each sample was injected nine times into the vaporizer. Memory effects from previous samples were avoided by rejecting the first three analyses. Values for the final six injections were averaged with in-run precision of less than ±0.1‰ for δ18O and ±1‰ for δD (1-standard deviation). Calibration of results to VSMOW was achieved by analyzing internal standards before and after each set of 7 or 8 samples. The instrument was calibrated at the start and during each run using three working standards from the University of Cambridge (Delta, Botty, SPIT) with known values calibrated against VSMOW, GISP, and SLAP. An internal seawater standard (SPIT) was analyzed after every three samples to correct for instrument drift.
At the Department of the Geophysical Sciences of the University of Chicago (USA) all seawater samples were processed on a GasBench II (Thermo, Bremen, Germany) with a GC PAL autosampler (CTC Analytics, Zwingen, Switzerland) and interfaced to a Delta V Plus isotope ratio mass spectrometer (Thermo) operating in continuous flow mode with helium carrier gas. A hydrogen equilibration method using platinum catalyst was used for δD analysis (Nelson, 2000); a classical CO2-H2O equilibration at 26°C was used for δ18O analysis. In both cases, samples
were entrained in a helium carrier gas with gas sample cleanup and removal of water vapor achieved on the GasBench II peripheral prior to isotopic analysis in continuous flow mode on the mass spectrometer. Raw δ18O analyses are corrected for the fractionation factor between water and CO2 as a function of temperature of equilibration (Friedman and O’Neill, 1977), mass
balance between water oxygen and CO2 oxygen present in the tube. Replicate analyses of the
standards VSMOW2, SLAP2, and GISP were included in every run, and samples were evaluated against these isotopic reference materials using standard practices. The δD analyses are corrected to the standards (Nelson, 2000), and then a uniform -2.0‰ salt correction (Martineau et al., 2012) is applied to compensate for isotopic enrichment of the headspace H2 for the seawater samples.
With few exceptions, all samples analyzed in Chicago were analyzed in triplicate. The resultant precision (1 s.d.) for triplicate δ18O analyses run on the same day averaged better than 0.03‰ and for δD analyses averaged 1.4‰. Splits from a subset of samples were preserved in smaller conical insert vials and reanalyzed in triplicate four months later. The means of the repeat analyses agreed with the original means within the measured analytical uncertainty as determined from the triplicates run each day.
Oxygen isotope ratios in POS and AMT-18 cruise samples were measured at the Leibniz Laboratory for Radiometric Dating and Isotope Research at the University of Kiel (Germany). POS349, POS377, POS383 and AMT-18 samples were analyzed in continuous flow mode on the DeltaPlusXL mass spectrometer coupled to a Gasbench II. POS334 samples were analyzed on a Delta E mass spectrometer coupled to an equilibration bath (Voelker et al., 2009). During the analyses three to four lab internal standards were used that are calibrated against VSMOW, GISP and SLAP. Analyses have a precision better than ±0.06‰.
Both oxygen and hydrogen isotope compositions are reported in parts per thousand (‰) on the VSMOW scale. The isotope and Iberia-Forams CTD data is available from the PANGAEA world data center (http://doi.pangaea.de/10.1594/PANGAEA.831469). The KN199-4 data is also archived with the Biological and Chemical Oceanography Data Management Office (www.bco-dmo.org/) and the AMT-18 data with the British Oceanographic Data Centre (BODC).
Figures 1 to 6 and 8 were constructed using the Ocean Data View program (Schlitzer, 2013). The transects in figures 2 to 6 were done with weighted-average gridding using scale-length values as small as possible (Fig. 2-5: x-axis scale-length: 75-80 permil; y-axis scale-length: 40-60 permil; Fig. 6: x-axis length: 85 permil; y-axis length: 125 permil). Owing to the greater x-axis values some features/isolines might artificially be elongated.
4. Results
4.1 Intercomparison Data for GA03_e Stations 1, 5 and 10
Figure 7 shows the comparison between the δ18O and δD values analyzed for the same samples with the Picarro water isotope analyzer at the Godwin Laboratory and the Thermo Delta V Plus mass spectrometer in Chicago. For δ18O values, especially those from Station 1 (see also Fig. 9a, b), the agreement is relatively good and many values fall onto or near a 1:1 line. Within the 1σ standard deviations nearly all values of Station 1 fall onto the 1:1 line. A larger scatter is observed for samples from Stations 5 and 10 compared to results from Station 1 (see also Fig. 9), which might be related to the larger range of salinity values encountered at Stations 5 and 10 (Fig. 2,3). At these stations the Picarro results appear to be less reliable because the isotope values obtained with the Delta V mass spectrometer fit more closely to the GEOSECS Station 115 data (see Fig. 9d for St. 5) than the Picarro results. However, there is no systematic offset from the 1:1 line as indicated by the linear relationship that clearly follows the above-mentioned trends. Although not measured on the same samples, the δ18O profiles from Station Ib-F 10 analyzed on the Picarro and Station POS334-72 measured on a Delta E mass spectrometer are nearly identical (Fig. 10e) indicating that the Picarro data are not systematically offset. Nevertheless, the KN199-4 data shows that more intercalibration work should be carried out in the future.
The reproducibility of δD among different labs is as good as for δ18O with values falling close to the 1:1 line (Fig. 7b). However, error bars for some of the Picarro measurements are large because duplicate measurements often gave results that differ by more than the estimated precision of 1‰ (especially for Station 5). Similar to the δ18O data this relates mostly to the Stations 5 and 10 and especially to the levels of the intermediate- to deep-water masses that have values in the lower range. Although perhaps some scatter in the Picarro measurements could be related to the fact that with VSMOW (0‰ for δ18O and δD) being the most enriched standard analyzed the δD regression for the KN199-4 samples (significantly more enriched than VSMOW) is extrapolated beyond the range of the standard values, the lower precision is more likely caused by salt buildup in the vaporizer, which greatly reduces accuracy (Saad and Trinh, 2013). As for δ18O more intercomparison work is needed as well as potentially repeating the analysis of some of the GA03_e samples using the new set-up proposed by Picarro to minimize salt buildup (Saad and Trinh, 2013).
4.2 KN199-4 GEOTRACES transects
Water mass isotopic ranges (only Picarro results) along the GA03_e transects are grouped according to the OMPA water mass analysis of Jenkins et al. (this volume) as briefly outlined in paragraph 2. Very few of the water samples collected along GA03_e represent nearly pure endmember compositions. Therefore, most of the isotopic compositions we report are the result of mixtures of endmembers. We highlight the distribution and isotopic influence of some key endmembers below, using the water mass identifications from Jenkins et al. (this volume).
Surface waters (0-50 m) along the meridional transect show δ18O values from –0.4 to 1.6‰ and δD values from 4 to 10‰ (Fig. 2, 8, 9). Along the East-West transect off Cape Blanc these values are 0.4 to 1.0‰ and 4 to 7‰, respectively (Fig. 3). Based on Stations 1-7, water in
the 50-500 m depth interval has isotopic values ranging from –0.6 to 2.6‰ for δ18O and 3 to 11‰ for δD. The majority of the δ18O values between 0.6 and 0.9‰ and of the δD values between 5 and 7‰ represent water samples with >80% NACW and small contributions from Southwest Atlantic Central Water and AEW. In the Cape Blanc transect (Stations 9-12) these depths are mostly occupied by the AEW and NACW (100-600 m) with δ18O values spanning from –0.1 to 1.2‰ and δD values from 1 to 8‰ (Fig. 3). MOW was most important in contributing to mid-depth waters (500-1600 m) at Stations 1 and 3 with declining importance at stations further south than Station 3 and below 1000 m; δ18O values in this depth interval (500-1600 m) are 0.6 to 0.9‰ and δD values 4 to 7‰ (Fig. 2, 8). At the stations and depths where MOW declines in importance, AAIW, UCDW, and CLSW are all important contributors with generally small (<20%) fractions of Irminger Sea Water (ISW). Over the 600-1000 m depth range for these stations, isotopic values range from –0.1 to 0.6‰ δ18O and 0 to 6‰ δD based on Stations 7 to 12 and the 1000 m level of Station 5. In the interval from 1000 to 1900 m (excluding Stations 1 and 3 where MOW is present) δ18O values vary between –0.2 and 0.5‰ in the meridional transect and 0.1 and 0.7‰ in the zonal Cape Blanc transect. Respective δD values are –1 to 3‰ and 2 and 6‰ (Fig. 2, 3, 8).
Most stations show substantial (40-70%) contributions from CLSW in the 1900-2500 m interval, and water isotopic compositions are in the range of –0.1 to 0.8‰ for δ18O and 0 and 4‰ for δD and for the ISOW (2500-3500 m) 0.0 to 0.5‰ for δ18O and 0 to 3‰ for δD. In the DSOW depth range (3500-4000 m) δ18O values vary from –0.1 to 0.2‰ and δD values from –1 to 2‰. Jenkins et al. (this volume) show that waters from > 3500 m (Stations 5 and 7) have substantial (>15%) contributions from AABW, CLSW, DSOW, and ISOW. Measured isotopic compositions on these waters are 0.0 to 0.7‰ for δ18O and 1 to 3‰ for δD (Fig. 2, 3, 8).
4.3 Iberia-Forams Stations
Along the Iberian margin δ18O values in the seasonal thermocline water (upper 90 m) ranged from 0.6 to 1.3‰ and δD values from 3 to 6‰ (Fig. 4, 5, 8). Isotopic values in the depth range from 100 to 280 m, representing mostly the subtropical NACW, are 0.6-1.1‰ δ18O and 3-7‰ δD, respectively. The lower δ18O values of 0.7‰ and 0.6‰ were measured at Station Ib-F 5 at 240 m (also lowest δD value) and Station Ib-F 11 at 250 m, respectively, and might reflect remnants of upwelling events occurring prior to the cruise and consequently potential admixing of the fresher subpolar NACW. Within the depth range of the subpolar NACW (300-680 m but excluding depths ≥ 500 m at southern Stations Ib-F 8 and 9) isotopic compositions of 0.4 to 0.9‰ δ18O and 2 to 4‰ δD were observed (Fig. 8). On the Algarve coast at Stations Ib-F 8 and 9 depths ≥ 500 m reveal high isotopic values (Fig. 5c, d) related to the presence of the shallowest (third) MOW core that in this region can be observed between 400 and 600 m (Ambar, 1983). The lowest subpolar NACW isotope values were recorded at Station Ib-F 6 north of Lisbon (38.8°N; Fig. 4).
In the depth interval from 700 to 1450 m the MOW is clearly depicted in the hydrographic and isotopic data along the western Iberian margin (Fig. 4, 8). Ranges of isotopic values for the samples most heavily influenced by MOW are 0.7 to 1.1‰ for δ18O and 3 to 6‰ for δD, respectively. In the δ18O values the upper MOW is well illustrated all along the western margin (Fig. 4c) whereas the lower MOW core is best portrayed at Station Ib-F 3 (41.2°N). The differences between the stations and levels are to be expected because the MOW cores are dynamic flows that shed many eddies (Serra and Ambar, 2002; Serra et al., 2005; Serra et al., 2002), especially in regions with topographic features such as the Portimão Canyon (vicinity of Station Ib-F 10) and the Estremadura promontory on which southern edge Station Ib-F 6 is located. Actually, at Station Ib-F 10 only a diluted lower MOW core is observed (Fig. 4). At this station the isotopic value at 790 and 1000 m is 0.5‰ for δ18O and 3‰ for δD. The δ18O value is
similar to those observed in the AAIW levels along the GA03_e sections (Fig. 2, 3) and might indicate AAIW advection into the Gulf of Cadiz as previously observed by Cabeçadas et al. (2002; 2003) and Louarn and Morin (2011). The Ib-F 10 δ18O profile agrees very well with the data from station POS334-72, located nearby but sampled in 2006 (Fig. 10e).
Below 1500 m isotopic values range from 0.1 to 0.9‰ δ18O and 0 to 5‰ δD (Fig. 4, 8). The high values of 0.9‰ and 5‰ at 1750 m depth at Station Ib-F 2 result probably from admixing of lower MOW core waters, even though the depth range also fits the LSW level (Alvarez et al., 2004; Fiuza et al., 1998).
4.4 AMT-18 transect
Oxygen isotope values of the surface to subsurface water masses sampled along the AMT-18 transect range from 0.8 to 1.5 (Fig. 6c, 8). As to be expected with increasing evaporation in the subtropical gyre surface water isotope values rise from the north to the south. North of the Azores Front the subpolar NACW has δ18O values between 0.9 and 1.0‰ whereas the values increase to 1.1-1.2‰ in the subtropical NACW.
4.5 Azores Current and Front Stations
Figures 8 and 10 show the δ18O data for the stations located in the Azores Current region and of the ESTOC (European Station for Time-Series in the Ocean, Canary Islands) station close to the Canary Islands (Fig. 1). Combining the data from all POS stations surface water δ18O values range from 0.8 to 1.4‰ and in the 60-600 m level from 0.4 to 1.5‰. In the depth interval from 600 to 1000 m, occupied by MOW and/or ISW/AAIW in the GA03_e transect, values vary between 0.3 and 0.8‰ (Fig. 8). Samples from 1500 m have δ18O values of 0.2 to 0.6‰ and from 2000 m (LSW level) of 0.2 to 0.6‰. Station POS383-175 is the only one extending to depths below 2000 m and shows a δ18O value of 0.4‰ at 3000 and 4000 m, respectively (Fig. 9c). At the deepest point (4700 m), i.e. in the AABW/LDW depth range, 0.2‰ are observed.
5. Discussion
5.1 Potential Outliers
At GA03_e Station 3 unusually low δ18O values of –0.6 to –0.4‰ were measured in the four samples from the upper 100 m (Fig. 2, 8). In comparison to all the other surface water values observed, especially at the open ocean POS and AMT-18 stations (Fig. 6, 10), these values are very low. The corresponding δD values are also relatively low at 4 to 5‰. Because these values were measured in four adjacent samples they suggest a real signal of a strong contribution from an isotopically light source (i.e., a freshwater source). A potential freshwater source could be heavy rain associated with perishing Hurricane Otto that crossed the sampling region as tropical storm on October 13th to 14th, 2010 (National Hurricane Center, US National Weather Service; http://www.nhc.noaa.gov/2010atlan.shtml), i.e. just days prior to the occupation of Station 3 on October 19th, 2010. Storm related winds could also explain why a freshwater signal was mixed as deep as 100 m. However, there is no significant salinity anomaly observable in these samples as would be required in order for rainwater to account for the oxygen isotope compositions. The salinities for these samples were between 36.25 and 36.65 and generally decline with depth. These are more saline (about 0.15 higher) than the surface waters at GA03_e Station 2 to the north and less saline (about 0.20 lower) than the surface waters at GA03_e Station 4 to the south. Because the four samples are interpreted as reflecting singular conditions they were excluded from the calculation of the δ18O-salinity relationships (Fig. 11a, 12).
The other set of unusual data are the values from the upper 185 m at GA03_e Station 5 (Fig. 2, 8, 9). Here enriched values of 1.2 to 2.6‰ δ18O and 8 to 11‰ δD were analyzed with the Picarro and 1.0 to 1.2‰ δ18O and 8 to 10‰ δD with the Delta V. With the exception of the 2.6‰ measured at 81.5 m the δ18O values fit into the range observed for the subtropical gyre at the other stations (Fig. 8). What makes these samples outstanding are the high δD values that are the greatest found in the whole data set. However, the high values are measured in duplicates and in both laboratories indicating that they reflect a true signal, for which we do not have an explanation. Corroboration for the occurrence of such high values comes from the recent study of Benetti et al. (2014) who measured δD values between 7.5 and 9‰ in the surface waters along a transect extending from the Canary Islands into the subtropical gyre. Only the sample at 81.5 m, which was just measured with a δD value of 11‰ by the Picarro, is flagged as outlier because of the extreme δ18O value (excluded in Figs. 2, 8, 10). It is assumed that the sample flask was not sealed properly, so that evaporation occurred during shipping and/or storing.
The δ18O values obtained for the POS383 stations are nearly all enriched by about 0.2‰ relative to the data from the previous R/V Poseidon cruises and to GA03_e Station 5 (Figure 8, 10). The POS383 and POS377 samples were analyzed at the same time, so that an analytical error can be excluded. Although the time series study of Fründt et al. (2013) revealed that the subtropical gyre is displaced northward during the recent years, the temperature and salinity profiles of the different cruises show no large changes that could explain the isotopic offset. We thus assume that the majority of the POS383 samples are altered by evaporative loss caused by poorly sealed glass flasks. One level that might not be affected by evaporation might be the deepest sample from the AABW/LDW level at station POS383-175 because the value matches the GA03_e and GEOSECS data (Fig. 9d). Nevertheless, all the POS383 data was excluded from the calculation of the δ18O-salinity relationships (Fig. 11a, 12).
5.2 Water Mass Characteristics
As expected surface water (upper 100 m) δ18O and δD values increase equatorward with increasing evaporation (Fig. 2, 4, 6). The stations along the GA03_e Cape Blanc transect are the exceptions to this rule. These are the southernmost stations in the dataset but isotope values (Fig. 3, 8) are much lower than those observed in the open ocean at 25°N (Fig. 2, 6, 8). The cause of this offset is the mixing of the surface waters with the fresher and thus isotopically lighter AAIW, which is upwelled along the NW African margin, as clearly depicted in the GA03_e Station 9 and 10 values from 50 to 100 m depth (Fig. 12). The Cape Blanc area experiences annual upwelling and Knoll et al. (2002) observed that the AAIW signal is especially strong in fall, i.e. the season when the GA03_e was sampled. The influence of the AAIW on the surface waters properties is something that is unique to the isotopic values and not seen in the OMPA by Jenkins et al. (this issue).
The MOW is marked by high δ18O and δD values, generally in the range of 0.5-1.1‰ and δD 3-6‰ (Fig. 8, 12), respectively. In the transects along the Iberian margin the isotopic signatures allow one to clearly distinguish the different cores, even the shallowest one in the Gulf of Cadiz (Fig. 5), and related dynamics. In the open Atlantic at the AzC stations δ18O values between 0.4 and 0.8‰ highlight MOW presence (Fig. 8; “diluted” MOW in Fig. 12). In the same region the δD data of GA03_e Station 3 reveals that meddies, shed from both the upper and the lower MOW core, were present and that isotopic signatures from the lower MOW core were entrained into the CLSW level (Fig. 2), in agreement with the OMPA data (Jenkins et al., this volume). The contribution of MOW to the intermediate water depths at GA03_e Stations 5 and 7 is also indicated by the isotopic values (Fig. 2), although for Station 7 this is not seen in the T-S diagram (Fig. 8a, b) and needs the corroboration of the OMPA (Jenkins et al., this volume).
Low δ18O and δD values of 0.2 to 0.5‰ and 0 to 2‰, respectively, between 800 and 1500 m at the stations south of 32°N indicate the presence of AAIW (Fig. 8), in agreement with the OMPA data of Jenkins et al. (this volume). The strong overprint of the MOW δ18O signal in this depth range does not allow recognition of AAIW further to the north (GA03_e Stations 5 and 3), where the OMPA still reveals AAIW contribution to the water mass mixture (up to 25% at Station 5; Jenkins et al., this issue). Along the zonal transect off Cape Blanc (Fig. 3) higher variability is observed in this depth interval, most likely related to the upwelling. At the easternmost Station 9 the AAIW dominated water (around 900 m) is overlain by a water mass with slightly higher isotopic values and MOW and AEW influence. This water mass probably reflects the mixing between subtropical/equatorial surface and central water with the AAIW during the upwelling. Further offshore there appear two AAIW “cores” based on the isotope values. Figure 9f shows the comparison between the GA03_e Station 9 and 10 δ18O profiles with two profiles measured by Pierre et al. (1994). The Station 9 values for the AAIW depth range are slightly more enriched than the Pierre et al. (1994) records whereas Station 10 records shows much more depleted values (Fig. 9f, g). Figure 9g compares the complete data set of Pierre et al. (1994) to Cape Blanc GA03_e Stations 9, 10 and 12. Both data sets show a broadly defined mixing line. The higher variability in the isotopic values from the upper water column can be linked to interannual variability in the upwelling strength and thus the admixing of AAIW. Nevertheless, to better evaluate the Cape Blanc transect values it would be good to obtain isotope data for the AAIW closer to the source region or at least in the eastern South Atlantic. The UCDW is difficult to distinguish because the isotopic range is not much different from the overlying AAIW and underlying CLSW. Only with the background knowledge of the OMPA can the plume of lower δ18O and δD data in the Cape Blanc transect (Fig. 3) be attributed to the UCDW.
The isotopic ranges in the depth interval related to the NEADW, based on the OMPA data a mixture of up to 5 different water masses, are –0.1-0.5‰ for δ18O and –1-4‰ for δD (Fig. 8).
This is a wide range for a relative narrow salinity range and the observed scatter is much larger than in the Pierre et al. (1994), GEOSECS and Frew et al. (2000) data (Fig. 11c). The Pierre et al. (1994) data, the only one with records for more than one station in the deeper NE Atlantic, does, however, reveal a higher variability than the Frew et al. (2000) data from close to the source areas. As Figure 9 shows the GA03_e values for the CLSW depth range are much more depleted than in the Pierre et al. (1994) profiles whereas the values merge for the ISOW. In relation to the GEOSECS Station 115 data from 28°N and 26°W (Östlund et al., 1987) the values observed in the ISOW and DSOW depth levels at GA03_e Stations 5 and 7 are not so different (Fig. 9c, d) and the contributions of these two water masses to the NEADW are clearly depicted in the meridional transect (Fig. 2, 8). From the stable isotope data alone it is, however, impossible to say which water masses contributed the most to the NEADW (CLSW, ISOW, AABW according to Jenkins et al., this volume) as sampled along the GA03_e transect. Because the presented dataset is so much larger than any of the previous studies in the mid-latitude North Atlantic we assume that at least some of the observed scatter is related to interannual variability within the water masses themselves and signal modification due to entrainment of adjacent waters such as MOW and AABW (Fig. 8). Some part of the scatter is probably related to the lower precision of the Picarro analyses, most likely linked to salt buildup in the vaporizer (Saad and Trinh, 2013).
Within the AABW/LDW depth range the observed δ18O values of 0.0 to 0.7‰ are comparably higher than the –0.3 to 0.1‰ range measured at stations within or close to the region of AABW formation (Mackensen, 2001; Meredith et al., 1999a; Fig. 11c). The more enriched values in deep NE Atlantic are probably related to the mixing of the AABW with isotopically heavier water masses on its way northward as previously observed by Pierre et al. (1994).
5.3 Interannual and Seasonal Variability
Several locations were occupied more than once during the various cruises and Figures 9 and 10 show comparisons between the respective profiles. This data allows looking at interannual and seasonal variability.
On the Iberian margin there are two areas where profiles were measured for nearby locations. GA03_e Station 1 and Station Ib-F 11 (located slightly to the south and more offshore; Fig. 1) were sampled two years apart under non-upwelling/ fall-type hydrographic conditions. Their δ18O profiles nearly replicate themselves whereas the δD values show differences beyond the analytical error range (± 1‰) in the MOW and NEADW (Fig. 9a). The small differences reflect the slightly higher salinities during October 2010 (GA03_e Stations 1). Given the dynamical hydrography in this region, which is a major area of meddy generation and meddy recirculation (due to the Estremadura promontory at 39°N; Serra and Ambar, 2002; Serra et al., 2002), it is actually astonishing that the records agree so well. The second group is stations Ib-F 10 and POS344-72 in the central Gulf of Cadiz (Fig. 1b). Although sampled 6 years apart, the δ18O profiles (Fig. 10e) are nearly identical indicating the dominant influence of AzC derived
subtropical subsurface waters at this location (MOW only sampled at Station Ib-F 11). The persistent AzC influence on the waters above 600 m in the Gulf of Cadiz confirms the westward extension of the northern AzC branch into the Gulf of Cadiz (Fig. 1a; Peliz et al., 2005; 2009) and thus the causal linkage between the AzC itself and the MOW formation that is evident in modeling studies (Jia, 2000; Özgökmen et al., 2001). In the depth range between 700 and 1000 m relatively low δ18O and δD values are recorded at station Ib-F 10 (Fig. 4, 10), contrary to any of the other stations along the Iberian margin where this depth range is occupied by the MOW. Together with the lower temperatures and salinities these isotopic compositions confirm the presence of modified AAIW (Louarn and Morin, 2011) at station Ib-F 10.
With the exclusion of the POS383 data the interannual and seasonal differences observed between the other R/V Poseidon cruises are relatively small (Fig. 10a-d). For the stations at 35 and 32°N there are even water depths where no differences are observed. More variability between the years and seasons are seen at 33°N (Fig. 10b), which is probably related to water mass dynamics on the southern side of the Azores Front. Exactly at this station Fründt et al. (2013) observed extensive subsurface warming shifting from a depth of 240 to 500 m due to the northward expansion of the subtropical gyre. This observation agrees with the higher δ18O values observed at station POS377-700 (sampled in 2008) than at station POS334-67 (sampled in 2006); likewise for the POS337 and POS334 stations at 35°N. Small differences in the isotopic values in the depth range between 700 and 1200 m values can also be caused by the presence/absence of meddies. At the ESTOC station (Fig. 1b, 10f) the new POS377-693 data fit well with the data previously obtained by Wilke et al. (2009), even though more than a decade separates the two time series for late fall/winter. The Wilke et al. (2009) data highlight, however, an additional aspect that is the seasonal differences that can be observed in a region influenced by upwelling. At this station the summer values are much lighter than during any of the other seasons indicating the strong modification of the summer values by the isotopically lighter AAIW upwelled along the NW African margin (similar to the surface waters in GA03_e Stations 9 and 10). Because the ESTOC station is located outside of the direct influence of the upwelling filaments formed off Cape Ghir or Cape Yubi (Fig. 1b) it is possible that the isotopically lighter surface waters are advected from the margin to the offshore region. The varying influence of the upwelled waters as well as the southward flowing Canary Current (strongest under the trade winds in summer and fall; Knoll et al., 2002) are the most likely reasons for the small variations seen in the fall to
spring records (Fig. 10f). Nevertheless, the POS cruise data shows that open ocean isotopic values can vary and that the higher variability observed along the GA03_e sections is not necessarily unusual.
The interannual differences observed at our stations can reach 0.1‰, i.e. a range similar to the 1σ analytical error (0.06-0.1‰). Based on this interannual variability and the standard deviations of our measurements we recommend that users who might want to compare our seawater data to their climate model results to apply at minimum a 1σ error 0.1‰ for δ18O and 1‰ for δD, better yet the respective 2σ range.
5.4 Isotope Ratio to Salinity Relationships
Based on the complete δ18O data set presented we observe a δ18O-salinity (S) relationship of δ18O = 0.51*S – 17.53 with a R2 value of 0.75 (Fig. 11a). The observed δD-salinity relationship is δD = 3.01*S – 103.84 with a R2 value of 0.69 (Fig. 11b). The slope of 0.51 in the δ18O-salinity relationship is slightly steeper than the one given by Pierre et al. (1994) for the subtropical to tropical Atlantic but lower than the 0.61 and 0.62 slopes found by Craig and Gordon (1965) and Frew et al. (2000), respectively, for the subpolar gyre. If calculated just for the water masses below 1750 m, i.e. those waters consisting of a mixture of CLSW, AABW and ISOW with minor contributions of MOW and DSOW (Jenkins et al., this volume), the slope becomes 0.55 (Fig. 11c). Some of our data points fall into the cluster of existing North Atlantic deep-water values (Fig. 11c); the scatter in our data is, however, much larger leading to a very low R2 value of 0.10. The larger scatter is related to some of the relatively low values determined with the Picarro. Interestingly, the slope and intercept (0.55; –18.98) we observe for the deeper waters fit those estimated by LeGrande and Schmidt (2006), using the database of Schmidt et al. (1999), for the whole North Atlantic, whereas their NADW slope and intercept (0.51; –17.75) matches those we observe for our complete data set. Nevertheless, the values are close enough to corroborate our slopes. Because of the strong water mass mixing in the study area (Jenkins et al., this volume) we did not separate the deeper water masses further.
Separate δ18O- and δD-salinity relationships were, however, calculated for the surface water, the NACW, of which the subtropical version is formed within our study area, and the MOW (Fig. 12). With the exception of the 50-100 m values observed at GA03_e Stations 9 and 10, which are likely affected by the upwelled, isotopically lighter AAIW, the 0-50 and 0-100 m values are generally comparable (Fig. 12 top panel). This is also reflected in the similar slopes estimated for the 0-50 m (δ18O/S: 0.32; δD/S: 2.63) and 0-100 m values (δ18O/S: 0.36; δD/S: 2.89). Most of our samples are from subtropical waters where evaporation exceeds precipitation but the slope is nevertheless less steep than the 0.22 found by Craig and Gordon (1965) for the North Atlantic’s subtropical surface waters between 20 and 27°N. One reason for this difference might be that most of our stations are from latitudes north of 27°N and also include stations within the North Atlantic’s transitional waters with values falling on the lower end of the reconstructed mixing line (Fig. 12). Several points, in particular those with δ18O values higher than 1.2‰, plot above the mixing line hinting at the existence of another mixing line, which may be the one pointed out by Craig and Gordon (1965). However, more data from the central subtropical gyre are needed to confirm if this potential mixing line is related to the latitudinal band (and thus the evaporation surplus), the δ18O or the salinity range because with our current dataset no subgroup (24-27°N, δ18O > 1.2 or S >36.8) provides a clear picture.
For the combined NACW data the δ18O-salinity relationship has a slope of 0.50 with an intercept of –17.35 and a R2 value of 0.59 (Fig. 12 central panel). If just calculated for those points that can clearly be attributed to the subtropical NACW the slope decreases to 0.46 and the
intercept to -15.82. In the δ18O realm the statistics are too poor (R2 of <0.09) to calculate a mixing line for the subpolar NACW. The δD-salinity mixing line for the subpolar NACW, however, has a much lower slope (1.86) than the one for the subtropical NACW (3.06) or for the NACW in general (3.47). The slope of the subtropical NACW’s δ18O-salinity mixing line matches the one found by Pierre et al. (1994) for the surface and central waters in the Cape Blanc upwelling region.
The slope (0.46) and intercept (–15.94) calculated for the extended MOW data set, including the stations along the Iberian margin and those offshore (“diluted” MOW) with a clear MOW-related higher salinity and temperature signal, is nearly identical to the one of the subtropical NACW (Fig. 12). This is not a big surprise because the MOW is formed by entrainment of NACW in the Gulf of Cadiz, but there is also indication of detrainment (upward mixing of the salinity signal) from the MOW into the NACW (Mauritzen et al., 2001). The statistics are too poor (R2 of <0.01) to estimate a mixing line for the MOW just from the stations along the Iberian margin. The slope of the MOW’s mixing line is not too far off from the 0.41 slope LeGrande and Schmidt (2006) obtained for the deep Mediterranean Sea, i.e. some of those waters contributing to the outflow through the Strait of Gibraltar, indicating that some of the Mediterranean Sea signal is likely still preserved in the MOW. The Mediterranean Sea influence is probably also behind the slope of the MOW’s δD-salinity mixing line that with a slope of 1.26 is much lower than the subtropical NACW’s slope (3.06; Fig. 12) but lies between the summer (1.64) and winter (nearly constant δD) slopes for the eastern Mediterranean Sea (Gat et al., 1996) where the Levantine Intermediate Water, a major contributor to the outflow from the Mediterranean Sea, is formed. A mixture of the Mediterranean Sea and NACW influence is likely also driving the slope of the δ18O-δD mixing line that, at 2.3, is much lower than for the NACW, the surface waters (Fig. 12) or the complete data set (Fig. 11d).
For the surface waters the estimated δ18O-δD slope is 3.99 (R2 = 0.50), whereas it increases to 4.79 (R2 = 0.46) for the NACW and 5.60 (R2 = 0.74) for the complete data set. All of
these slopes are clearly offset from the slope of 8 of the Global Meteoric Water Line (GMWL; Craig and Gordon, 1965). However, the slope is already close to 7 in southern France (Genty et
al., 2014), i.e. at the northern boundary of our study area. In our data the lower slopes likely
reflect the impact of the higher net evaporation in the subtropics, in particular in the surface waters. The influence of the subpolar NACW, formed in a region where precipitation exceeds evaporation, is seen in the steeper NACW slope compared to the surface waters. Likewise the effect of the AAIW, AABW and deeper North Atlantic water masses, all formed in regions with net precipitation, is visible in the shift of the slope of the complete data set more towards the GMWL. Nevertheless, our data clearly confirms the observation of Craig and Gordon (1965) and later on Gat et al. (1996) that the linear δ18O-δD relationship breaks down in areas with high net
evaporation. 6. Conclusions
The new large dataset presented here greatly improves our knowledge of oxygen and hydrogen isotope ratios in NE Atlantic water masses. The MOW has been sampled for the first time close to its source region and is clearly distinguishable in isotope profiles from the NE Atlantic. The AAIW can also clearly be recognized by its isotopic compositions and is modifying surface to subsurface waters in the Cape Blanc upwelling area. The stable isotope values for the depth range occupied by the NEADW masses show a range wider than previously observed. This scatter is related to interannual variability, which is constrained in this larger data set, and water mass modification by entrainment. Additional constraints on deep-water isotope values in the NE Atlantic will come in the near future from the OVIDE 2010 transect (Portugal to Reykjanes
Ridge), for which analyses are currently underway, as this data will directly link the data presented to the area studied by Frew et al. (2000). These new data also provide a broader empirical basis for models of seawater stable isotope composition (e.g., Roche and Caley, 2013) or for the hydrological cycle (e.g., LeGrande and Schmidt, 2009).
Acknowledgements
Funding for KN199-4 ship time, sampling operations, and hydrographic data was provided by the U. S. National Science Foundation to the US GEOTRACES North Atlantic Transect Management team of W. Jenkins (OCE-0926423), E. Boyle (OCE-0926204), and G. Cutter (OCE-0926092). We thank E. Gorman and the complete KN199-4 science party for sample collecting. A.C. acknowledges support through U.S. National Science Foundation Award # OCE 0827122. Funding of the Iberia-Forams cruise was provided by the European Union Seventh Framework Programme (FP7/2007-2013) under grant agreement n° 228344–EUROFLEETS to A.V.. J. Waniek received funding from the Deutsche Forschungsgemeinschaft through grants WA2157/1-1 to WA2157/5-1 for the PO cruises. A.V. thanks Chris Gallienne and Malcolm Woodward from the Plymouth Marine Laboratory (UK) for collecting the AMT-18 samples. A. Rebotim, CN Prabhu and the Iberia-Forams team are acknowledged for sample collecting during the respective cruises. Stable isotope analyses in Cambridge were funded by grant PEst-C/MAR/LA0015/2011 (GEOTRACES) and funds provided by the late E. Willweber (Iberia-Forams). Measurements in Kiel were made possible by the Marine Geology Department of LNEG through PIDDAC funds. A.S.C. received funding through U.S. National Science Foundation Award # OCE 0827122. D.H. acknowledges NERC for technical support of the Godwin Laboratory. Thanks go to Mike Hall, Ian Mather and James Rolfe in Cambridge and Nils Andersen and team in Kiel for the stable isotope measurements.
References
Alvarez, M., Perez, F.F., Bryden, H., Rios, A.F., 2004. Physical and biogeochemical transports structure in the North Atlantic subpolar gyre. J. Geophys. Res. 109, C03027, doi:
10.1029/2003jc002015.
Ambar, I., 1983. A Shallow Core of Mediterranean Water Off Western Portugal. Deep-Sea Research Part A 30 (6), 677-680.
Ambar, I., Howe, M.R., 1979. Observations of the Mediterranean Outflow: 1. Mixing in the Mediterranean Outflow. Deep-Sea Research Part A 26 (5), 535-554.
Azetsu-Scott, K., Tan, F.C., 1997. Oxygen isotope studies from Iceland and to an East Greenland fjord: Behaviour of glacial meltwater plume. Mar. Chem. 56, 239-251.
Bauch, D., Schlosser, P., Fairbanks, R.G., 1995. Fresh-Water Balance and the Sources of Deep and Bottom Waters in the Arctic-Ocean Inferred from the Distribution of (H20)-O-18. Progress In Oceanography 35 (1), 53-80.
Benetti, M., Reverdin, G., Pierre, C., Merlivat, L., Risi, C., Steen-Larsen, H.C., Vimeux, F., 2014. Deuterium excess in marine water vapor: Dependency on relative humidity and surface wind speed during evaporation. Journal of Geophysical Research: Atmospheres 119, 2013JD020535, doi: 10.1002/2013JD020535.
Bigg, G.R., Rohling, E.J., 2000. An oxygen isotope data set for marine waters. Journal of Geophysical Research 105 (C4), 8527-8535.
Bigg, G.R., Jickells, T.D., Liss, P.S., Osborn, T.J., 2003. The role of the oceans in climate. International Journal of Climatology 23 (10), 1127-1159.
Brambilla, E., Talley, L.D., Robbins, P.E., 2008. Subpolar Mode Water in the northeastern Atlantic: 2. Origin and transformation. Journal of Geophysical Research 113, doi: 10.1029/2006jc004063.
Cabeçadas, G., Brogueira, M.J., Goncalves, C., 2002. The chemistry of Mediterranean outflow and its interactions with surrounding waters. Deep Sea Research Part II: Topical Studies in Oceanography 49 (19), 4263-4270.
Cabeçadas, G., Brogueira, M.J., Gonçalves, C., 2003. Intermediate water masses off south-southwest Portugal: Chemical tracers. Journal of Marine Research 61 (4), 539-552.
Cai, Y., Tan, L., Cheng, H., An, Z., Edwards, R.L., Kelly, M.J., Kong, X., Wang, X., 2010. The variation of summer monsoon precipitation in central China since the last deglaciation. Earth and Planetary Science Letters 291 (1-4), 21-31.
Caley, T., Roche, D.M., 2013. δ18O water isotope in the iLOVECLIM model (version 1.0) – Part 3: A palaeo-perspective based on present-day data–model comparison for oxygen stable isotopes in carbonates. Geosci. Model Dev. 6 (5), 1505-1516.
Cheng, H., Sinha, A., Cruz, F.W., Wang, X., Edwards, R.L., d’Horta, F.M., Ribas, C.C., Vuille, M., Stott, L.D., Auler, A.S., 2013. Climate change patterns in Amazonia and biodiversity. Nat Commun 4, 1411, doi: 10.1038/ncomms2415.
Cox, K.A., Stanford, J.D., McVicar, A.J., Rohling, E.J., Heywood, K.J., Bacon, S., Bolshaw, M., Dodd, P.A., De la Rosa, S., Wilkinson, D., 2010. Interannual variability of Arctic sea ice export into the East Greenland Current. J. Geophys. Res. 115, doi: 10.1029/2010jc006227. Curry, R.G., Dickson, B., Yashayaev, I., 2003. A change in the freshwater balance of the Atlantic
Ocean over the past four decades. Nature 426, 826-829.
Craig, H., Gordon, L.I., 1965. Deuterium and oxygen 18 variations in the ocean and marine atmosphere. In: Tongiogi, E. (Ed.), In proc. Stable Isotopes in Oceanographic Studies and Paleotemperatures, 1965, Spoleto, Italy. V. Lishi e F., Pisa, pp. 9-130.
Durack, P.J., Wijffels, S.E., 2010. Fifty-Year Trends in Global Ocean Salinities and Their Relationship to Broad-Scale Warming. Journal of Climate 23 (16), 4342-4362.
Durack, P.J., Wijffels, S.E., Matear, R.J., 2012. Ocean Salinities Reveal Strong Global Water Cycle Intensification During 1950 to 2000. Science 336, 455-458.
Epstein, S., Mayeda, T., 1953. Variation of O18 content of waters from natural sources. Geochim. Cosmochim. Acta 4, 213-224.
Fairbanks, R.G., 1982. The origin of continental shelf and slope water in the New York Bight and Gulf of Maine: Evidence from H218O/ H216O ratio measurements. J. Geophys. Res. 87,
5796-5808.
Fiuza, A.F.G., Hamann, M., Ambar, I., del Rio, G.D., Gonzalez, N., Cabanas, J.M., 1998. Water masses and their circulation off western Iberia during May 1993. Deep-Sea Research Part I-Oceanographic Research Papers 45 (7), 1127-1160.
Fratantoni, D.M., 2001. North Atlantic surface circulation during the 1990's observed with satellite-tracked drifters. Journal of Geophysical Research 106, 22067–22093.
Frew, R.D., Dennis, P.F., Heywood, K.J., Meredith, M.P., Boswell, S.M., 2000. The oxygen isotope composition of water masses in the northern North Atlantic. Deep Sea Research Part I: Oceanographic Research Papers 47 (12), 2265-2286.
Friedman, I., 1953. Deuterium content of natural water and other substances. Geochim. Cosmochim. Acta 4, 89-103.
Friedman, I., O’Neill, J.R., 1977. Compilation of stable isotope fractionation factors of
geochemical interest. Chapter KK. In: Fleischer, M. (Ed.), Data of geochemistry, 6th ed. U.S. Geological Survey Professional Paper 440.
Fründt, B., Waniek, J.J., 2012. Impact of the Azores Front propagation on deep Ocean particle flux. Cent. Eur. J. Geosci. 4 (4), 531-544.
Fründt, B., Müller, T.J., Schulz-Bull, D.E., Waniek, J.J., 2013. Long-term changes in the thermocline of the subtropical Northeast Atlantic (33°N, 22°W). Progress In Oceanography 116, 246-260.
Gat, J.R., 1996. Oxygen and Hydrogen isotopes in the hydrological cycle. Annu. Rev. Earth Planet. Sci. 24, 225-262.
Gat, J.R., Shemesh, A., Tziperman, E., Hecht, A., Georgopoulos, D., Basturk, O., 1996. The stable isotope composition of waters of the eastern Mediterranean Sea. Journal of Geophysical Research: Oceans 101 (C3), 6441-6451.
Genty, D., Labuhn, I., Hoffmann, G., Danis, P.A., Mestre, O., Bourges, F., Wainer, K., Massault, M., Van Exter, S., Régnier, E., Orengo, P., Falourd, S., Minster, B., 2014. Rainfall and cave water isotopic relationships in two South-France sites. Geochimica et Cosmochimica Acta 131, 323-343
Jenkins, W.J., Smethie, W.M., Boyle, E.A., Cutter, G.C., this volume. Water mass analysis for the U.S. GEOTRACES North Atlantic Sections. Deep Sea Research II.
Jia, Y., 2000. Formation of an Azores Current due to Mediterranean Overflow in a modeling study of the North Atlantic. Journal of Physical Oceanography 30, 2342-2358.
Johnson, J., Stevens, I., 2000. A fine resolution model of the eastern North Atlantic between the Azores, the Canary Islands and the Gibraltar Strait. Deep Sea Research Part I: Oceanographic Research Papers 47 (5), 875-899.
Klein, B., Siedler, G., 1989. On the origin of the Azores Current. Journal of Geophysical Research C94, 6159–6168.
Knoll, M., Hernandez-Guerra, A., Lenz, B., Lopez Laatzen, F., Machin, F., Muller, T.J., Siedler, G., 2002. The Eastern Boundary Current system between the Canary Islands and the African Coast. Deep Sea Research Part II: Topical Studies in Oceanography 49 (17), 3427-3440. Kohfeld, K.E., Fairbanks, R.G., Smith, S.L., Walsh, I.D., 1996. Neogloboquadrina pachyderma
(sinistral coiling) as paleoceanographic tracers in polar oceans: Evidence from Northeast Water Polynya plankton tows, sediment traps, and surface sediments. Paleoceanography 11 (6), 679-699.
LeGrande, A.N., Schmidt, G.A., 2006. Global gridded data set of the oxygen isotopic composition in seawater. Geophysical Research Letters 33, L12604, doi:
10.1029/2006GL026011.
LeGrande, A.N., Schmidt, G.A., 2009. Sources of Holocene variability of oxygen isotopes in paleoclimate archives. Clim. Past 5 (3), 441-455.
Louarn, E., Morin, P., 2011. Antarctic Intermediate Water influence on Mediterranean Sea Water outflow. Deep Sea Research Part I: Oceanographic Research Papers 58 (9), 932-942.
Mackensen, A., 2001. Oxygen and carbon stable isotope tracers of Weddell Sea water masses: new data and some paleoceanographic implications. Deep-Sea Research Part I-Oceanographic Research Papers 48 (6), 1401-1422.
Martineau, F., Fourel, F., Bodergat, A.M., Lécuyer, C., 2012. D/H equilibrium fractionation between H2O and H2 as a function of the salinity of aqueous solutions. Chemical Geology 291,
Masson-Delmotte, V., Jouzel, J., Landais, A., Stievenard, M., Johnsen, S.J., White, J.W.C., Werner, M., Sveinbjornsdottir, A., Fuhrer, K., 2005. GRIP Deuterium Excess Reveals Rapid and Orbital-Scale Changes in Greenland Moisture Origin. Science 309 (5731), 118-121. Masson-Delmotte, V., Stenni, B., Blunier, T., Cattani, O., Chappellaz, J., Cheng, H., Dreyfus, G.,
Edwards, R.L., Falourd, S., Govin, A., Kawamura, K., Johnsen, S.J., Jouzel, J., Landais, A., Lemieux-Dudon, B., Lourantou, A., Marshall, G., Minster, B., Mudelsee, M., Pol, K., Röthlisberger, R., Selmo, E., Waelbroeck, C., 2010. Abrupt change of Antarctic moisture origin at the end of Termination II. Proceedings of the National Academy of Sciences 107 (27), 12091-12094.
Mauritzen, C., Morel, Y., Paillet, J., 2001. On the influence of Mediterranean Water on the Central Waters of the North Atlantic Ocean. Deep Sea Research Part I: Oceanographic Research Papers 48 (2), 347-381.
McCartney, M.S., Talley, L.D., 1982. The Subpolar Mode Water of the North Atlantic Ocean. Journal of Physical Oceanography 12 (11), 1169-1188.
Meredith, M.P., Grose, K.E., McDonagh, E.L., Heywood, K.J., Frew, R.D., Dennis, P.F., 1999a. Distribution of oxygen isotopes in the water masses of Drake Passage and the South Atlantic. Journal of Geophysical Research-Oceans 104 (C9), 20949-20962.
Meredith, M.P., Heywood, K.J., Frew, R.D., Dennis, P.F., 1999b. Formation and circulation of the water masses between the southern Indian Ocean and Antarctica: Results from delta O-18. Journal of Marine Research 57 (3), 449-470.
Mittelstaedt, E., 1989. The subsurface circulation along the Moroccan slope. In: Neshyba, S.J., Mooers, C.N.K., Smith, R.L., Barber, R.T. (Eds.), Poleward Flows Along Eastern Ocean Boundaries. Springer, New York, pp. 96-109.
Mulitza, S., Boltovskoy, D., Donner, B., Meggers, H., Paul, A., Wefer, G., 2003. Temperature: δ18O relationships of planktonic foraminifera collected from surface water. Palaeogeography Palaeoclimatology Palaeoecology 202, 143-152.
Nelson, S.T., 2000. A simple, practical methodology for routine VSMOW/SLAP normalization of water samples analyzed by continuous flow methods. Rapid Communications in Mass Spectrometry 14, 1044-1046.
Ortiz, J.D., Mix, A.C., Rugh, W., Watkins, J.M., Collier, R.W., 1996. Deep-dwelling planktonic foraminifera of the northeastern Pacific Ocean reveal environmental control of oxygen and carbon isotopic disequilibria. Geochimica et Cosmochimica Acta 60 (22), 4509-4523. Östlund, H.G., Craig, H., Broecker, W.S., Spenser, D., 1987. GEOSECS Atlantic, Pacific and
Indian Ocean expeditions: Shorebased Data and Graphics. Technical Report. National Science Foundation, Washington, D.C, p. 220.
Özgökmen, T.M., Chassignet, E.P., Rooth, C.G.H., 2001. On the connection between the Mediterranean Outflow and the Azores Current. Journal of Physical Oceanography 31, 461-480.
Paul, A., Mulitza, S., Pätzold, J., Wolff, T., 1999. Simulation of Oxygen Isotopes in a Global Ocean Model. In: Fischer, G., Wefer, G. (Eds.), Use of Proxies in Paleoceanography: Examples from the South Atlantic. Springer Verlag, Berlin Heidelberg, pp. 655-686.
Peeters, F.J.C., Brummer, G.-J.A., Ganssen, G., 2002. The effect of upwelling on the distribution and stable isotope composition of Globigerina bulloides and Globigerinoides ruber (planktic foraminifera) in modern surface waters of the NW Arabian Sea. Global and Planetary Change 34, 269-291.
Peliz, A., Dubert, J., Santos, A.M.P., Oliveira, P.B., Le Cann, B., 2005. Winter upper ocean circulation in the Western Iberian Basin – Fronts, Eddies and Poleward Flows: an overview. Deep Sea Research Part I: Oceanographic Research Papers 52 (4), 621-646.