Contents lists available atScienceDirect
Environment International
journal homepage:www.elsevier.com/locate/envintApplication of Bayesian statistics to estimate nitrous oxide emission factors
of three nitrogen fertilisers on UK grasslands
N. Cowan
a,⁎, P. Levy
a, J. Drewer
a, A. Carswell
b, R. Shaw
c, I. Simmons
a, C. Bache
a,
J. Marinheiro
a,d, J. Brichet
a, A.R. Sanchez-Rodriguez
c,e, J. Cotton
c, P.W. Hill
c, D.R. Chadwick
c,
D.L. Jones
c,f, T.H. Misselbrook
b, U. Skiba
aaCentre for Ecology and Hydrology, Bush Estate, Penicuik, Midlothian, UK bRothamsted Research, Sustainable Agriculture Sciences, North Wyke, Devon, UK cSchool of Natural Sciences, Bangor University, Gwynedd, UK
dInstituto Superior de Agronomia, Universidade de Lisboa, Tapada da Ajuda, Lisboa, Portugal eDepartamento de Agronomía, Universidad de Córdoba, ETSIAM, Córdoba, Spain
fUWA School of Agriculture and Environment, University of Western Australia, Crawley, Australia
A R T I C L E I N F O Keywords: Agriculture N2O Urease inhibitor Urea Uncertainty A B S T R A C T
Trapezoidal integration by linear interpolation of data points is by far the most commonly used method of cumulativeflux calculations of nitrous oxide (N2O) in studies that useflux chambers; however, this method is incapable of providing accurate uncertainty estimates. A Bayesian approach was used to calculate N2O emission factors (EFs) and their associated uncertainties fromflux chamber measurements made after the application of nitrogen fertilisers, in the form of ammonium nitrate (AN), urea (Ur) and urea treated with Agrotain® urease inhibitor (UI) at four grassland sites in the UK. The comparison between the cumulativefluxes estimated using the Bayesian and linear interpolation methods were broadly similar (R2= 0.79); however, the Bayesian method was capable of providing realistic uncertainties when a limited number of data points is available. The study reports mean EF values (and 95% confidence intervals) of 0.60 ± 0.63, 0.29 ± 0.22 and 0.26 ± 0.17% of applied N emitted as N2O for the AN, Ur and UI treatments, respectively. There was no significant difference between N2O emissions from the Ur and UI treatments. In the case of the automatic chamber data collected at one site in this study, the data did notfit the log-normal model, implying that more complex models may be needed, particularly for measurement data with high temporal resolution.
1. Introduction
Agriculture contributes an estimated 60–70% to global anthro-pogenic nitrous oxide (N2O) emissions (Syakila and Kroeze, 2011;Tian et al., 2019), primarily due to increased application of reactive nitrogen (Nr) fertilisers to soils and subsequently aquatic systems, from which N2O is released as a byproduct of the microbial processes of nitrification
and denitrification (Davidson et al., 2000). N2O is a potent greenhouse
gas as well as the most significant contributor to global stratospheric ozone depletion (Ravishankara et al., 2009), which doubly increases the incentive to mitigate these emissions. Current projections predict that global rates of Nr fertilisation will continue to rise over the next century to cope with a growing population, changing diets and greater demand for food. Therefore, it has become increasingly urgent to address the issue of N2O emissions from agriculture sources. However, food supply
is a sensitive issue both politically and economically, and there are a limited number of mitigation options available that may reduce agri-cultural N2O emissions without impacting crop yields.
Chemical inhibitors that target urease hydrolysis and microbial ni-trification are commercially available and have been shown to reduce Nr losses under laboratory conditions and in field trials, but with varying success. Microbial inhibitors and compounds which block en-zymes of microbially mediated pathways are also in development (Sanz-Cobena et al., 2016;Ni et al., 2014;Singh et al., 2013;Rose et al., 2017;Ruser and Schulz, 2015). Although there are many positive stu-dies, which promote the pollution-reducing capabilities of these in-hibitors, especially the reduction of NH3losses, some questions remain
over the overall effectiveness of the inhibitors, which face claims that reduction of NH3losses may increase N2O emissions (Lam et al., 2016; Carswell et al., 2018).
https://doi.org/10.1016/j.envint.2019.04.054
Received 23 January 2019; Received in revised form 4 April 2019; Accepted 24 April 2019 ⁎Corresponding author.
E-mail address:nicwan11@ceh.ac.uk(N. Cowan).
Available online 08 May 2019
0160-4120/ © 2019 The Authors. Published by Elsevier Ltd. This is an open access article under the CC BY license (http://creativecommons.org/licenses/BY/4.0/).
Serious difficulties lie in the estimation of accurate emission factors from experiments investigating N2O fluxes, due to the measurement
methods available and the unpredictable heterogeneous nature of mi-crobial production of N2O (Butterbach-Bahl et al., 2013). As such, it can
be difficult to accurately assess the true impact of any particular N2O
mitigation effort. The majority of N2Oflux studies (past and present)
deploy chamber methodology to measure emissions from soils (Dobbie et al., 1999;Chadwick et al., 2014;Cowan et al., 2015). These cham-bers are sampled periodically, and only represent a small surface area of soil (chamber sizes typically vary from 10 cm2 to 1 m2). Due to the
unpredictable spatial and temporal variability in N2O fluxes from
agricultural soils, estimates of emissions of N2O after fertiliser events
have large associated uncertainties (Cowan et al., 2017; Levy et al., 2017).
In the absence of reliable predictive models, trapezoidal (linear) integration between points is by far the most commonly used method of cumulative flux estimation. However, this method does not provide meaningful uncertainties in estimates. To better understand the results of N2O emission experiments and to evaluate the effectiveness of the
sampling schemes used in mitigation experimentation, Bayesian methods are being developed to estimate cumulative N2Ofluxes and to
provide meaningful uncertainty estimates (Lehuger et al., 2009;Zhou et al., 2015; Cowan et al., 2017; Levy et al., 2017). Through better statistical handling of N2O measurement data, it is possible that
un-certainties may be better understood and reduced in future experi-mentation.
To improve regional and national scale accounting for N2O
emis-sions, it has been suggested that the IPCC Tier 1 method (De Klein, 2006), assuming a constant EF for all applied Nr is too simplistic, and that the development of a Tier 2 method which incorporates fertiliser type and environmental conditions should be considered (Skiba et al., 2012). However, it has also been recognized that due to the un-predictable nature of N2O emissions, large uncertainties in inventories
may remain. To test these assumptions, coordinated experimentation is required at a national scale from multiple experimental sites.
This study aims to use a Bayesian method for estimating cumulative fluxes (Levy et al., 2017) to quantify the efficacy of a urease inhibitor in a series of experiments replicated across the UK. The experiments measure N2O EFs after application of Agrotain®
(urease-inhibitor-treated urea, N-(n-butyl) thiophosphoric triamide, Koch, KS, USA) on intensively managed grassland silage crops at four sites in the UK, and compare this with the two most commonly used synthetic nitrogen fertilisers in the UK: ammonium nitrate (Nitram®, CF Fertilisers UK Ltd., Cheshire, UK) and urea. The results will then be used to analyse the feasibility of a Tier 2 EF method for regional and national N2O emission
inventories.
2. Materials and methods
2.1. Field sites and experimental design
Four trials were conducted at intensively managed grassland sites in the UK, during the growing seasons in 2016 and 2017 (Table 1).
The trials were carried out at Easter Bush farm estate (Midlothian, Scotland) (Drewer et al., 2016;Jones et al., 2017), Henfaes Research Station (Abergwyngregyn, Wales) (HF) (Shaw et al., 2016) and
Rothamsted Research, (North Wyke, southwest England) (NW) (Rennie et al., 2017).
Twofields within the Easter Bush farm estate were used, referred to as Easter Bush (EB) and Upper Joiner (UJ)field sites. The EB field had historically been used to graze sheep (0.7 LSU ha−1) The UJfield had predominantly been used for silage harvest with occasional grazing during winter. The HF and NW sites were managed similarly, pre-dominantly used for silage harvest with occasional grazing during winter months (Carswell et al., 2018).
Experimental plots were arranged at each site in strips of 2 m by 8 m (with a 0.5–2.0 m spacing between them), positioned randomly to mi-tigate bias resulting from spatial variability of soil properties. The plot layout varied in the 2017 UJ trial, for which plots were arranged in a square grid, each measuring 20 m by 20 m with no spacing between them. Applications of nitrogen fertilisers in the form of ammonium nitrate (AN), urea (Ur), and urea treated with the Agrotain® urease inhibitor (UI) were applied to the plots (via manual spreading) two or three times per site, each application was replicated on four plots with an additional four control plots to which no Nr fertiliser was applied (a total of 16 plots per fertiliser event;Table 2). Fertiliser applications were applied at 60, 70 or 90 kg N ha−1based on typical farm practices at the respective sites.
2.2. N2Oflux measurements
At all sites, measurements of N2Ofluxes were taken using the static
manual chamber approach. At the EB and UJ sites, chambers consisted of a cylindrical polyvinyl chloride (PVC) plastic pipe of 38 cm inner diameter (ID) and 22 cm heightfitted with sealed lid and a flange at the base. The chambers were placed onto a plasticflanged collar that had been inserted several centimeters into the soil (on average 5 cm) to form a seal in the soil. A layer of draught sealant material held in place by four strong gripping clips formed an airtight seal between the chamber and the collar for the duration of the flux measurement. Chambers were closed for 60 min, during which four gas samples were collected via a syringe and a three-way tapfitted to the lid, at t = 0, 20, 40 and 60 min. Gas samples were stored in 20 ml glass vials, which wereflushed with 100 ml of air from the syringe using a double needle. Samples were analysed using gas chromatography (7890B GC system fitted with an electron capture detector and 7697A Headspace Autosampler, Agilent Technologies, Santa Clara, California, United States). At the EB and UJ sites the manual static chamber measurements were carried out daily for two weeks after fertilisation, then every second day for a further two to four weeks, with measurements only made only on working days (Monday to Friday) between 09:00 and 15:00 GMT.
At the HF and NW sites, slots were cut into the soil and the cham-bers (50 × 50 × 30 cm) were inserted, so that 15–20 cm of the chamber height remained above the soil surface. On each sampling occasion, lids were placed on the chambers and remained in place for 40 min with three gas samples collected via syringe, at t = 0, 20 and 40 min. Gas samples were stored in pre-evacuated 20 ml glass vial, which were flushed with 50 ml of air from the syringe using a double needle. Samples were analysed for N2O concentration using a Perkin Elmer 580
Gas Chromatograph (linked to a TurboMatrix 110 Headspace Autosampler) (Carswell et al., 2018). At the HF and NW sites manual
Table 1
Characteristics of the fourfield sites where fertiliser trials were carried out.
Site Year pH Annual rainfall (mm)
Mean annual soil Temp. (°C)
Grass species Previous management
EB 2016 6.02 793 9 Lolium perenne L. Mostly sheep grazing HF 2016 6.32 1250 11 Lolium multiflorum Lam. Silage with winter grazing NW 2016 5.77 1107 12 Lolium perenne L. Silage with winter grazing UJ 2017 6.10 780 10 Lolium perenne L. Silage with winter grazing
static chamber measurements were carried out following fertilisation at three times weekly for weeks one and two, twice weekly for weeks three and four, and once weekly thereafter. Measurements were made be-tween 09:00 and 15:00 GMT.
Further measurements were made at the HF site using an automatic chamber approach (via an Isotopic N2O Analyser, Los Gatos Research
Inc. San Jose, CA, USA). Chamber bases were inserted into the soil and the chambers (50 × 50 × 20 cm) attached to the bases at surface height to ensure an air tight seal. Closing and opening of the chambers was controlled by pneumatic actuators. The chambers closed for a 30 min measurement period (four times a day), during which the chamber-headspace was sampled via a sampling port at a rate of 1 l min−1at a frequency of 0.1 Hz.
Fluxes were calculated as:
= F dC dt ρV A . (1) where F is the gasflux from the soil (nmol m−2s−1) dC/dt is the rate of
change in the concentration in time in nmol mol−1s−1estimated by linear regression,ρ is the density of air in mol m−3, V is the volume of the chamber in m3and A is the ground area enclosed by the chamber in
m2.
2.3. Interpolation of N2Oflux data
Cumulative fluxes over the experimental periods (30 days) were calculated using a Bayesian approach, taking into account the log-normal distribution of spatial samples and the loglog-normal peak-and-decay pattern in time (Levy et al., 2017). Based on the assumption that at a given time, N2Ofluxes, F, are typically log-normally distributed in Table 2
A summary of the nitrogen applications at thefield sites. Equivalent quantities of total nitrogen were applied to four plots in the form of AN, U and UI for each event.
Site Date Event 1 Total N applied (kg N ha−1) Date Event 2 Total N applied (kg N ha−1) Date Event 3 Total N applied (kg N ha−1) EB 2016-03-11 70 2016-07-15 70 / / HF 2016-05-05 90 2016-06-13 90 2016-07-25 60 NW 2016-03-23 90 2016-05-19 90 2016-07-08 60 UJ 2017-05-25 70 2017-07-19 70 2017-09-15 70 Table 3
Cumulativefluxes estimated using linear and Bayesian interpolation methods over a 30 day period after ammonium nitrate fertiliser applications at the four field sites. Values presented represent 4 plots (n = 4) per event at eachfield site. Emission factors account for the effect of N application after the measured background flux has been deducted from cumulative totals.
Site Event Fertiliser applied
Backgroundflux Linear interpolation cumulative
Linear minus background
Bayes interpolation cumulative
95% C.I. Bayes minus background Linear EF Bayes EF (kg N ha−1) (kg N ha−1) (kg N ha−1) (kg N ha−1) (kg N ha−1) min max (kg N ha−1) (%) (%) Ammonium nitrate EB 1 70 0.25 1.66 1.41 1.59 1.02 2.86 1.34 2.02 1.92 EB 2 70 0.19 0.31 0.11 0.45 0.32 0.68 0.25 0.16 0.36 HF 1 90 0.01 0.06 0.04 0.05 0.05 0.06 0.04 0.05 0.04 HF 2 90 0.04 0.14 0.10 0.15 0.13 0.16 0.10 0.11 0.12 HF 3 60 0.06 0.18 0.11 0.19 0.17 0.21 0.13 0.19 0.21 NW 1 90 0.23 0.88 0.65 1.65 0.96 3.50 1.43 0.73 1.59 NW 2 90 0.16 0.41 0.25 0.70 0.38 1.61 0.54 0.28 0.61 NW 3 60 0.07 0.10 0.03 0.20 0.14 0.34 0.14 0.06 0.23 UJ 1 70 0.92 1.50 0.59 1.39 0.97 2.26 0.48 0.84 0.68 UJ 2 70 0.51 0.43 −0.08 0.50 0.39 0.67 −0.01 −0.11 −0.01 UJ 3 70 0.93 1.66 0.73 1.53 1.08 2.34 0.60 1.05 0.85 Table 4
Cumulativefluxes estimated using linear and Bayesian interpolation methods over a 30 day period after all Urea (Ur) applications at the four field sites. Values presented represent 4 plots (n = 4) per event at eachfield site. Emission factors account for the effect of N application after the measured background flux has been negated from cumulative totals.
Site Event Fertiliser applied
Backgroundflux Linear Interpolation cumulative
Linear minus background
Bayes interpolation cumulative
95% C.I. Bayes minus background Linear EF Bayes EF (kg N ha−1) (kg N ha−1) (kg N ha−1) (kg N ha−1) (kg N ha−1) min max (kg N ha−1) (%) (%) Urea EB 1 70 0.25 0.51 0.26 0.52 0.37 0.78 0.27 0.37 0.38 EB 2 70 0.19 0.23 0.03 0.30 0.24 0.40 0.11 0.05 0.15 HF 1 90 0.01 0.06 0.05 0.06 0.05 0.07 0.05 0.05 0.05 HF 2 90 0.04 0.28 0.24 0.25 0.22 0.28 0.21 0.26 0.23 HF 3 60 0.06 0.33 0.27 0.32 0.29 0.35 0.26 0.45 0.43 NW 1 90 0.23 0.32 0.09 0.63 0.36 1.43 0.40 0.10 0.45 NW 2 90 0.16 0.25 0.09 0.53 0.30 1.13 0.37 0.10 0.41 NW 3 60 0.07 0.11 0.04 0.18 0.11 0.37 0.12 0.07 0.19 UJ 1 70 0.92 0.89 −0.03 0.99 0.72 1.48 0.07 −0.04 0.10 UJ 2 70 0.51 0.81 0.31 1.06 0.64 2.10 0.55 0.44 0.79 UJ 3 70 0.93 1.08 0.15 0.97 0.77 1.27 0.04 0.22 0.05
space, the probability density is given by:
= − −
f F( ) 1/( (2 )π σlogF) exp( ((log F( ) μlog) /(22 σlog2 ))) (2) whereμlogandσlogare the location and scale parameters, equivalent to
the mean and standard deviation of the log-transformed variate. The mean of the distribution is given by:
= +
μ exp(μlog 0.5σlog2 )
(3) Following a fertilisation event, the time course of N2Oflux is
ex-pected to rise to a peak, then decay exponentially, and this basic pattern
is reproduced by all process-based models (i.e. Li et al., 1992; Del Grosso et al., 2006) and is also well described by the log-normal equation:
= − −
μt 1/( (2 )π kt) exp( ((log( )t Δ) /(2 )))·2 k2 N Ωin (4)
whereμtis the spatial mean of the N2Oflux at time t, Δ and k are
analogues for the location and scale parameters, and with the addi-tional term Ninis the fertiliser nitrogen input andΩ is the fraction of
this which is emitted as N2O as t tends toward infinity. Δ can be
in-terpreted as the natural logarithm of the delay between fertiliser ap-plication and peakflux; k is a decay rate term. So, at time t following Table 5
Cumulativefluxes estimated using linear and Bayesian interpolation methods over a 30 day period after all Urea with inhibitor (UI) applications at the four field sites. Values presented represent 4 plots (n = 4) per event at eachfield site. Emission factors account for the effect of N application after the measured background flux has been negated from cumulative totals.
Site Event Fertiliser applied
Backgroundflux Linear interpolation cumulative
Linear minus background
Bayes interpolation cumulative
95% C.I. Bayes minus background
Linear EF Bayes EF
(kg N ha−1) (kg N ha−1) (kg N ha−1) (kg N ha−1) (kg N ha−1) min max (kg N ha−1) (%) (%) Urea & inhibitor
EB 1 70 0.25 0.48 0.23 0.54 0.37 0.90 0.28 0.33 0.41 EB 2 70 0.19 0.23 0.04 0.29 0.23 0.40 0.10 0.06 0.14 HF 1 90 0.01 0.07 0.06 0.07 0.06 0.07 0.05 0.07 0.06 HF 2 90 0.04 0.19 0.15 0.18 0.16 0.19 0.14 0.17 0.15 HF 3 60 0.06 0.31 0.25 0.28 0.25 0.32 0.22 0.41 0.37 NW 1 90 0.23 0.10 −0.13 0.26 0.15 0.51 0.03 −0.14 0.03 NW 2 90 0.16 0.25 0.10 0.43 0.26 0.89 0.27 0.11 0.30 NW 3 60 0.07 0.07 0.01 0.16 0.09 0.33 0.09 0.01 0.15 UJ 1 70 0.92 1.13 0.22 1.33 0.87 2.46 0.41 0.31 0.58 UJ 2 70 0.51 0.49 −0.02 0.67 0.50 0.97 0.17 −0.03 0.24 UJ 3 70 0.93 1.26 0.33 1.22 0.89 1.83 0.29 0.46 0.41
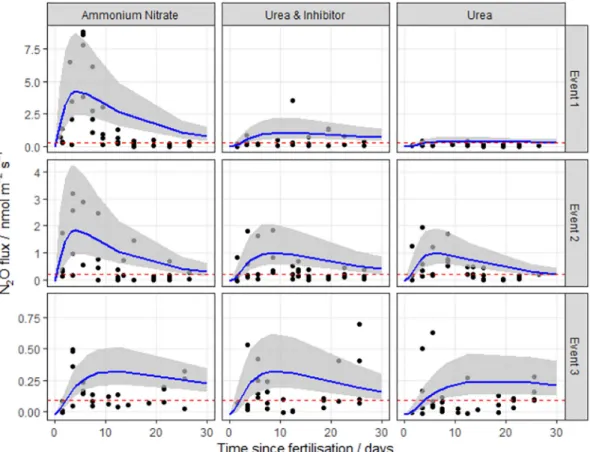
Fig. 1. N2Ofluxes following fertilisation with three different nitrogen forms at the Easter Bush field site (EB, Midlothian, Scotland) in 2016. The log-normal model was used to estimate cumulative N2Ofluxes. The 95% credible intervals of the posterior predictions are shown as the shaded area. Mean background fluxes from control plots are included for each event (red dashed line). (For interpretation of the references to colour in thisfigure legend, the reader is referred to the web version of this article.)
fertilisation, the meanflux is given by Eq.5 or 6, at which time the N2O
flux has a distribution ∼
F lnN(μlog,t,σlog2 )
(5) where
= −
μlog,t log( )μt 0.5σlog2 (6)
The parametersμ, μlog andσlogwere estimated using the Markov
Chain Monte Carlo (MCMC) method with Gibbs sampling (Gelman, 2013). This was implemented using the freely available JAGS software (Plummer, 2016). The prior distribution forΩ was based on the data collated byStehfest and Bouwman (2006). The prior distributions forΔ and k were based on the dynamics of the DNDC model (Li et al., 1992, as described inLevy et al., 2017). To obtain the cumulativeflux at time t, we use the standard log-normal cumulative distribution function:
= ⎛ ⎝ − ⎞ ⎠ F Φ t Δ k N Ω ln cum t, in (7) whereΦ is the cumulative distribution function of the standard normal distribution.
To account for background fluxes (fluxes of N2O expected in the
absence of any applied nitrogen), a cumulative backgroundflux was estimated using the mean of thefluxes measured from the control plots during each event. This cumulative background estimate was then subtracted from the cumulativefluxes estimated for each treatment. The reported EFs in this study take background fluxes into account when reportingfinal values (Tables 3 to 5).
3. Results
3.1. Measured N2Ofluxes
A log-normal spatial distribution of data was typically observed for each of the N application events where static chamber measurements were made, with individual chamber fluxes ranging between −0.02 and 25.4 nmol N2O m−2s−1(Figs. 1 to 4). A variable, but significant
increase in emissions of N2O in the days after the fertiliser event was
broadly observed for all events, with a few exceptions. The time delay between N application and the observed increase in N2Oflux varied by
site and fertiliser type, although the vast majority of emissions appear to have occurred within the 30 day window. Fluxes from control plots varied across the sites and dates of application events; however, these emissions were relatively low with a mean value of 0.4 nmol N2O
m−2s−1.
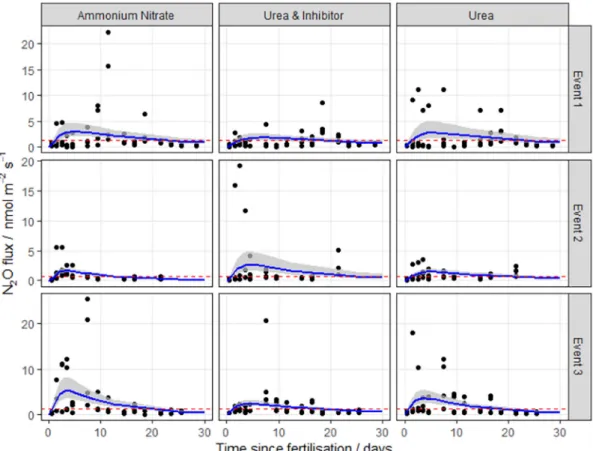
The log-normal model generallyfitted well to the measurements. The exception was at the HF site, where the pattern of emissions does not closely follow the log-normal pattern described in Eq.2(Fig. 2), having very extreme but short-lived peaks. It is unclear why these data show the least correspondence with the log-normal pattern. Partly the fit is dominated by the large number of near-zero fluxes in the tail of the distribution. Partly it may be due to the small number of spatial samples used in the autochamber system at this site. Each of these has a different timing of the peak, and the ensemble mean does not closely follow the log-normal pattern. The use of other meta-models needs to be explored in this case.
3.2. Cumulativefluxes and emission factors
Cumulativefluxes calculated using the linear and Bayesian methods Fig. 2. N2Ofluxes following fertilisation with three different nitrogen forms at Henfaes Research Station (HF, Abergwyngregyn, Wales) in 2016. The log-normal model was used to estimate cumulative N2Ofluxes. The 95% credible intervals of the posterior predictions are shown as the shaded area. Mean background fluxes from control plots are included for each event (red dashed line). (For interpretation of the references to colour in thisfigure legend, the reader is referred to the web version of this article.)
were broadly comparable across the different sites. The direct com-parison of the two interpolation methods shows that in this study the Bayesian method predicted slightly largerfluxes than the linear method (slope = 1.04) and there is some disagreement in larger EF estimates (R2= 0.79), but overall the comparison was good. Taking background
emissions into account, EFs ranged from slightly negative values (−0.01%, where treatment plots emitted less N2O than control plots) to
a maximum of 1.92% of the N applied.
A large degree of relative variability was observed between EFs reported for the different fertiliser types within the same field site. On occasions, when the measurements were particularly variable, un-certainties in cumulativefluxes estimated using the Bayesian method were greater than 1% of the applied N. In these cases neither method was able to determine accurate cumulative estimates based on the available measurement data; this is represented in the large uncertainty value reported by the Bayesian method (Fig. 5).
By combining the cumulativefluxes calculated by the MCMC chains when using the log-normal Bayesian method, we can observe the pos-terior distributions of the EFs predicted for each treatment across all experiments (Fig. 6). The overlap of the distributions highlights the similarity in emissions observed between the treatments; although the shape of the distribution is distinctly different between the urea and AN treatments with a higher probability of observing EFs above 1% for AN.
4. Discussion
Mean EFs estimated using the Bayesian interpolation method were 0.60 ± 0.63, 0.29 ± 0.22 and 0.26 ± 0.17% for the AN, Ur and UI treatments, respectively. These observations are within the range of results reported in similar experiments for which N2O EFs for
applica-tions of synthetic N fertilisers such as AN and Ur vary in the region of 0
to 3% of applied N (Dobbie et al., 1999;IPCC, 2014;Akiyama et al., 2006;Stehfest and Bouwman, 2006), although values are well below the 1% IPCC default value. The AN treatment occasionally exceeded the 1% default EF value, although most of the individual EFs for all treat-ments remained below this value in this study (median EF = 0.24%).
Emissions associated with either urea treatment applications occa-sionally surpassed the emissions from the AN treatments, but EFs for both the urea treatments consistently remained below the IPCC 1% estimate (after background fluxes were taken into account), not breaching the 0.5% mark in any experiment (although 95% C.I.s reached values greater than 1.5% on occasion). Based on the posterior distribution provided by the Bayesian method, EFs associated with AN treatments were found to be larger than those of the urea treatments 55% of the time and that the EFs associated with UI were larger than Ur 60% of the time; however, the magnitude of these differences was in-consistent and not statistically significant.
Our results agree with previous studies that AN fertilisers can emit more N2O than equivalent applications of urea (Harty et al., 2016);
however, this study highlights that there is a large degree of variability between each individual event and that on occasion, urea application can emit more than AN fertilisers, as has been observed in other studies (Bouwman, 1996; Smith et al., 1997; Bell et al., 2015). Our study suggests that generally there is no significant increase in the production of N2O when the Agrotain® urease inhibitor is applied to urea fertiliser;
however, this study highlights that due to the unpredictable nature of N2Ofluxes and the methods typically used to measure them, individual
experiments are likely to see a wide range of outcomes even if there were no real treatment differences. This may explain the wide range of observations in experiments investigating N2O emissions after using
inhibitors with fertiliser applications (Lam et al., 2016; Singh et al., 2013;Rose et al., 2017;Ruser and Schulz, 2015).
Fig. 3. N2Ofluxes following fertilisation with three different nitrogen forms at the Rothamsted Research site, (NW, North Wyke, southwest England) in 2016. The log-normal model was used to estimate cumulative N2Ofluxes. The 95% credible intervals of the posterior predictions are shown as the shaded area. Mean backgroundfluxes from control plots are included for each event (red dashed line). (For interpretation of the references to colour in this figure legend, the reader is referred to the web version of this article.)
The reportedfluxes and EFs in this study follow a log-normal dis-tribution in both space and time, as is regularly observed in measure-ment data (Stehfest and Bouwman, 2006). Clear differences were dif-ficult to establish between treatments, which is typical for data that follow a log-normal distribution, as demonstrated inFig. 6. This ob-servation highlights two major issues with fertiliser comparison ex-periments. Firstly, based on the variability in these observations, a very large number of replicates is needed when assessing treatments with
small effect sizes. This presents problems when resources to carry out such large experiments is limited. The second issue is that the log-normal distribution of the data complicates the analysis considerably. Simply log-transforming the data does not suffice, because we are in-terested in properties of the data in untransformed space, such as the mean. The Bayesian method applied here provides a means of tackling this problem.
The wide variation in emissions after fertilisation events is often Fig. 4. N2Ofluxes following fertilisation with three different nitrogen forms at the Upper Joiner field site (UJ, Easter Bush, Midlothian, Scotland) in 2017. The log-normal model was used to estimate cumulative N2Ofluxes. The 95% credible intervals of the posterior predictions are shown as the shaded area. Mean background fluxes from control plots are included for each event (red dashed line). (For interpretation of the references to colour in this figure legend, the reader is referred to the web version of this article.)
Fig. 5. Comparison of the Emission factors estimated using the trapezoidal (linear) and log-normal Bayesian integration methods of all fertiliser applications at four sites in the UK.
attributed to multiple environmental variables (such as temperature, oxygen availability, soil type, soil moisture, plant residue, soil carbon content, pH). However, it is very difficult to accurately predict the microbial interactions which affect N2O production from the
informa-tion that is available in most experiments (Bouwman, 1996). Correla-tions between cumulativefluxes and environmental variables are sta-tistically weak and inconsistent between the events at different sites. What is apparent is that the EF for a given fertilisation event is very unpredictable. The same fertiliser type applied at the same site under similar conditions can produce quite different emissions on different occasions, for reasons we do not always understand, and which cannot always be predicted from the principles in process-based models (Butterbach-Bahl et al., 2013).
Our study highlights several points of interest that should be taken into account when Tier 2 EFs are being considered. Thefirst point is that different fertiliser types have a wide range of EFs that may not be predicted using the obvious, easily measured environmental variables, such as rainfall or soil mineral N concentrations. In this study, none of the measured environmental or soil variables were able to explain the variation in emission factors. The second point is that microbial pro-duced emissions for each individual event are influenced by a wide number of factors and vary with a log-normal exponential behavior, potentially emitting an unpredictably large quantity of N2O over
sev-eral hours that could be greater than cumulative emissions for sevsev-eral weeks afterwards, or alternatively, nothing at all under what appears to be similar conditions (as observed inSkiba et al., 2013, andLevy et al., 2017). As such, the application of usual meteorological and environ-mental conditions used to predict N2O emissions at a Tier 2 level is
unlikely to reduce uncertainties at the regional or national scale any more than the application of a Tier 1 inventory, as predicted inSkiba et al. (2012).
What is noticeable in our study, is that the EFs of different fertiliser types have different probability density functions (pdfs), as demon-strated by the contrast of AN and urea treatments (Fig. 6). With a large number of experiments across the region of interest, these pdfs will become more defined and may better represent the emissions expected from a particular event than the default 1% EF suggested by the IPCC report. The exact number of experiments required to accurately predict a regional pdf is unknown, because of the difficulty of measuring the exact soil conditions within the soil microsites were N2O is produced.
A comparison of the Bayesian and trapezoidal linear interpolation methods show that they did not differ systematically, but the former provides rigorous uncertainties when a limited number of data points is
available. In this respect, the Bayesian method has been a success, as large uncertainties are provided when data varies significantly in time and space, something which was not possible to assess when using traditional trapezoidal linear interpolation method. However, care should be taken when using the Bayesian method whenflux measure-ments are more temporally defined (i.e. auto-chambers and eddy cov-ariance), as the log-normalfit becomes too constrained and uncertainty estimates are no longer valid.
5. Conclusions
A Bayesian approach was used to calculate EFs and their associated uncertainties from the application of nitrogen fertilisers in the form of ammonium nitrate (AN), urea (Ur) and urea treated with Agrotain® urease inhibitor (UI) at four grassland sites in the UK. The study reports that the EFs observed after 11 separate events followed a variable log-normal distribution, with mean reported values of 0.60 ± 0.63, 0.29 ± 0.22 and 0.26 ± 0.17% of applied N emitted as N2O for the
AN, Ur and UI treatments, respectively. The study found that EFs as-sociated with AN were more likely to be larger than those of the urea-based treatments, but there was no significant difference in overall emissions of N2O between the Ur and the UI treatments. The Bayesian
method used in this study successfully provided uncertainty values in cumulativefluxes of N2O that traditional trapezoidal linear
interpola-tion methods could not. In its current form, the method is limited to cases where the emissions show a peak and decline following fertili-sation, as expected fromfirst principles.
Acknowledgements
Work was supported by the UK-China Virtual Joint Centre for Improved Nitrogen Agronomy (CINAg, BB/N013468/1), which is jointly supported by the Newton Fund, via UK BBSRC and NERC, and the Chinese Ministry of Science and Technology. We also gratefully acknowledge the NitroPortugal, H2020-TWINN-2015, EU coordination and support action. 692331 for partial funding, Koch Fertiliser LLC who supplied the urea with Agrotain®, and the invaluable help of farm manager Wim Bosma (Edinburgh University) and trials team manager Alistair Drysdale (SRUC).
References
Akiyama, H., Yan, X., Yagi, K., 2006. Estimations of emission factors for fertilizer-induced
Fig. 6. The probability distribution function (pdf) of N2O emission factors of applied nitrogen estimated using the log-normal Bayesian interpolation method for 11 fertiliser applications at four sites in the UK.
direct N2O emissions from agricultural soils in Japan: summary of available data. Soil
Science and Plant Nutrition 52, 774–787.
Bell, M.J., Hinton, N., Cloy, J.M., Topp, C.F.E., Rees, R.M., Cardenas, L., Scott, T., Webster, C., Ashton, R.W., Whitmore, A.P., Williams, J.R., Balshaw, H., Paine, F., Goulding, K.W.T., Chadwick, D.R., 2015. Nitrous oxide emissions from fertilised UK arable soils:fluxes, emission factors and mitigation. Agric. Ecosyst. Environ. 212, 134–147.
Bouwman, A.F., 1996. Direct emission of nitrous oxide from agricultural soils. Nutr. Cycl. Agroecosyst. 46, 53–70.
Butterbach-Bahl, K., Baggs, E.M., Dannenmann, M., Kiese, R., Zechmeister-Boltenstern, S., 2013. Nitrous oxide emissions from soils: how well do we understand the processes and their controls? Philosophical Transactions of the Royal Society B: Biological Sciences 368, 20130122.
Carswell, A., Shaw, R., Hunt, J., Sánchez-Rodríguez, A.R., Saunders, K., Cotton, J., Hill, P.W., Chadwick, D.R., Jones, D.L., Misselbrook, T.H., 2018. Assessing the benefits and wider costs of different N fertilisers for grassland agriculture. Arch. Agron. Soil Sci. 1–15.
Chadwick, D.R., Cardenas, L., Misselbrook, T.H., Smith, K.A., Rees, R.M., Watson, C.J., McGeough, K.L., Williams, J.R., Cloy, J.M., Thorman, R.E., Dhanoa, M.S., 2014. Optimizing chamber methods for measuring nitrous oxide emissions from plot-based agricultural experiments. Eur. J. Soil Sci. 65, 295–307.
Cowan, N.J., Norman, P., Famulari, D., Levy, P.E., Reay, D.S., Skiba, U.M., 2015. Spatial variability and hotspots of soil N2Ofluxes from intensively grazed grassland.
Biogeosciences 12 (5), 1585–1596 Copernicus GmbH.
Cowan, N.J., Levy, P.E., Famulari, D., Anderson, M., Reay, D.S., Skiba, U.M., 2017. Nitrous oxide emission sources from a mixed livestock farm. Agric. Ecosyst. Environ. 243, 92–102.
Davidson, E.A., Keller, M., Erickson, H.E., Verchot, L.V., Veldkamp, E., 2000. Testing a conceptual model of soil emissions of nitrous and nitric oxides. BioScience 50 (8), 667.
De Klein, C., 2006. N2O emissions from managed soils, and CO2emissions from lime and
urea application. In: Eggleston, S., Buendia, L., Miwa, K., Ngara, T., Tanabe, K. (Eds.), IPCC Guidelines for National Greenhouse Gas Inventories. Agriculture, Forestry and Other Land Use Volume 4 Intergovernmental Panel on Climate Change, Geneva.
Del Grosso, S.J., Parton, W.J., Mosier, A.R., Walsh, M.K., Ojima, D.S., Thornton, P.E., 2006. DAYCENT National-Scale simulations of nitrous oxide emissions from cropped soils in the United States. Journal of Environment Quality 35, 1451.
Dobbie, K.E., McTaggart, I.P., Smith, K.A., 1999. Nitrous oxide emissions from intensive agricultural systems: variations between crops and seasons, key driving variables, and mean emission factors. Journal of Geophysical Research: Atmospheres 104, 26891–26899.
Drewer, J., Anderson, M., Levy, P.E., Scholtes, B., Helfter, C., Parker, J., Rees, R.M., Skiba, U.M., 2016. The impact of ploughing intensively managed temperate grasslands on N2O, CH4and CO2fluxes. Plant Soil 411, 193–208.
Gelman, A., 2013. Bayesian Data analysis, 3rd edn. CRC Press, New York.
Harty, M.A., Forrestal, P.J., Watson, C.J., McGeough, K.L., Carolan, R., Elliot, C., Krol, D., Laughlin, R.J., Richards, K.G., Lanigan, G.J., 2016. Reducing nitrous oxide emissions by changing N fertiliser use from calcium ammonium nitrate (CAN) to urea based formulations. Sci. Total Environ. 563–564, 576–586.
IPCC, Pachauri, R.K., 2014. In: Core Writing Team, Meyer, L.A. (Eds.), Climate Change 2014: Synthesis Report. Contribution of Working Groups I, II and III to the Fifth Assessment Report of the Intergovernmental Panel on Climate Change. IPCC, Geneva, Switzerland (151 pp).
Jones, S., Helfter, C., Anderson, M., Coyle, M., Campbell, C., Famulari, D., Di Marco, C., et al., 2017. The nitrogen, carbon and greenhouse gas budget of a grazed, cut and fertilised temperate grassland. Biogeosciences 14 (8), 2069–2088.
Lam, S.K., Suter, H., Mosier, A.R., Chen, D., 2016. Using nitrification inhibitors to miti-gate agricultural N2O emission: a double-edged sword? Glob. Chang. Biol. 23 (2), 485–489.
Lehuger, S., Gabrielle, B., Oijen, M. van, Makowski, D., Germon, J.-C., Morvan, T., Hénault, C., 2009. Bayesian calibration of the nitrous oxide emission module of an
agro-ecosystem model. Agric. Ecosyst. Environ. 133, 208–222.
Levy, P.E., Cowan, N., van Oijen, M., Famulari, D., Drewer, J., Skiba, U., 2017. Estimation of cumulativefluxes of nitrous oxide: uncertainty in temporal upscaling and emission factors. Eur. J. Soil Sci. 68, 400–411.
Li, C., Frolking, S., Frolking, T.A., 1992. A model of nitrous oxide evolution from soil driven by rainfall events: 1. Model structure and sensitivity. Journal of Geophysical Research: Atmospheres 97, 9759–9776.
Ni, K., Pacholski, A., Kage, H., 2014. Ammonia volatilization after application of urea to winter wheat over 3 years affected by novel urease and nitrification inhibitors. Agric. Ecosyst. Environ.https://doi.org/10.1016/j.agee.2014.08.007.
Plummer, M., 2016. Rjags: Bayesian Graphical Models Using MCMC. R Package Version 4–6. URL.https://CRAN.R-project.org/package=rjags, Accessed date: 12 November 2018.
Ravishankara, A.R., Daniel, J.S., Portmann, R.W., 2009. Nitrous oxide (N2O): the
domi-nant ozone-depleting substance emitted in the 21st century. Science 326 (5949), 123–125.
Rennie, S., Adamson, J., Anderson, R., Andrews, C., Bater, J., Bayfield, N., Beaton, K., Beaumont, D., Benham, S., Bowmaker, V., et al., 2017. UK Environmental Change Network (ECN) Meteorology Data: 1992–2012. NERC Environmental Information Data Centre.
Rose, T.J., Morris, S.G., Quin, P., Kearney, L.J., Kimber, S., Van Zwieten, L., 2017. The nitrification inhibitor DMPP applied to subtropical rice has an inconsistent effect on nitrous oxide emissions. Soil Research 55 (6), 547.
Ruser, R., Schulz, R., 2015. The effect of nitrification inhibitors on the nitrous oxide (N2O)
release from agricultural soils—a review. J. Plant Nutr. Soil Sci. 178 (2), 171–188.
Sanz-Cobena, A., Abalos, D., Meijide, A., Sanchez-Martin, L., Vallejo, A., 2016. Soil moisture determines the effectiveness of two urease inhibitors to decrease N2O
emission. Mitig. Adapt. Strateg. Glob. Chang. 21 (7), 1131–1144.
Shaw, R., Lark, R.M., Williams, A.P., Chadwick, D.R., Jones, D.L., 2016. Characterising the within-field scale spatial variation of nitrogen in a grassland soil to inform the efficient design of in-situ nitrogen sensor networks for precision agriculture. Agric. Ecosyst. Environ. 230, 294–306.
Singh, J., Kunhikrishnan, A., Bolan, N.S., Saggar, S., 2013. Impact of urease inhibitor on ammonia and nitrous oxide emissions from temperate pasture soil cores receiving urea fertilizer and cattle urine. Sci. Total Environ. 465, 56–63.
Skiba, U., Jones, S.K., Dragosits, U., Drewer, J., Fowler, D., Rees, R.M., Pappa, V.A., Cardenas, L., Chadwick, D., Yamulki, S., Manning, A.J., 2012. UK emissions of the greenhouse gas nitrous oxide. Philosophical Transactions of the Royal Society B: Biological Sciences 367, 1175–1185.
Skiba, U., Jones, S.K., Drewer, J., Helfter, C., Anderson, M., Dinsmore, K., McKenzie, R., Nemitz, E., Sutton, M.A., 2013. Comparison of soil greenhouse gasfluxes from ex-tensive and inex-tensive grazing in a temperate maritime climate. Biogeosciences 10, 1231–1241, 2013.
Smith, K.A., McTaggart, I.P., Tsuruta, H., 1997. Emissions of N2O and NO associated with
nitrogen fertilization in intensive agriculture, and the potential for mitigation. Soil Use Manag. 13, 296–304.
Stehfest, E., Bouwman, L., 2006. N2O and NO emission from agriculturalfields and soils
under natural vegetation: summarizing available measurement data and modeling of global annual emissions. Nutr. Cycl. Agroecosyst. 74, 207–228.
Syakila, A., Kroeze, C., 2011. The global nitrous oxide budget revisited. Greenhouse Gas Measurement and Management 1 (1), 17–26.
Tian, H., Yang, J., Xu, R., Lu, C., Canadell, J.G., Davidson, E.A., Jackson, R.B., Arneth, A., Chang, J., Ciais, P., Gerber, S., Ito, A., Joos, F., Lienert, S., Messina, P., Olin, S., Pan, S., Peng, C., Saikawa, E., Thompson, R.L., Vuichard, N., Winiwarter, W., Zaehle, S., Zhang, B., 2019. Global soil nitrous oxide emissions since the preindustrial era esti-mated by an ensemble of terrestrial biosphere models: magnitude, attribution, and uncertainty. Glob. Chang. Biol. 25, 640–659.
Zhou, F., Shang, Z., Zeng, Z., Piao, S., Ciais, P., Raymond, P.A., Wang, X., Wang, R., Chen, M., Yang, C., Tao, S., Zhao, Y., Meng, Q., Gao, S., Mao, Q., 2015. New model for capturing the variations of fertilizer-induced emission factors of N2O. Glob.