NICOLE ENNIS
DEVELOPMENT OF NEW ANALYTICAL METHODS
FOR THE ANALYSIS OF AN EMERGING
PHARMACEUTICAL POLLUTANT (IBUPROFEN)
ANALYSIS BY CAPILLARY ELECTROPHORESIS AND
HPLC COUPLED WITH OFF-LINE SPE
UNIVERSIDADE DO ALGARVE
Faculdade de Ciências e Tecnologia
NICOLE ENNIS
DEVELOPMENT OF NEW ANALYTICAL METHODS FOR THE
ANALYSIS OF AN EMERGING PHARMACEUTICAL
POLLUTANT (IBUPROFEN)
ANALYSIS BY CAPILLARY ELECTROPHORESIS AND HPLC
COUPLED WITH OFF-LINE SPE
Erasmus Mundus Master in Quality in Analytical Laboratories Trabalho efetuado sob a orientação de: Professor Maria Clara Costa Professor Marina Franco Maggi Tavares
UNIVERSIDADE DO ALGARVE
Faculdade de Ciências e Tecnologia
NICOLE ENNIS
DEVELOPMENT OF NEW ANALYTICAL METHODS FOR THE
ANALYSIS OF AN EMERGING PHARMACEUTICAL POLLUTANT
(IBUPROFEN) – ANALYSIS BY CAPILLARY ELECTROPHORESIS
AND HPLC COUPLED WITH OFF-LINE SPE
Faculdade de Ciências e Tecnologia, Universidade do Algarve Intituto de Química, Universidade de São Paulo
SUPERVISORS
THIS MASTER RESEARCH THESIS WAS CONDUCTED IN THE
LABORATORIES OF THE FACULDADE DE CIÊNCIAS E TECHNOLOGIA AT THE UNIVERSIDADE DO ALGARVE UNDER THE SUPERVISION OF
PROFESSOR MARIA CLARA COSTA SEPTEMBER 2016 – MARCH 2017
AND IN THE LABORAORIES OF THE DEPARTMENTO DE QUÍMICA FUNDAMENTAL OF THE INTITUTO DE QUÍMICA, UNIVERSIDADE DE SÃO PAULO UNDER THE SUPERVISION OF PROFESSOR MARINA FRANCO MAGGI
TAVARES
DEVELOPMENT OF NEW ANALYTICAL METHODS FOR THE
ANALYSIS OF AN EMERGING PHARMACEUTICAL POLLUTANT
(IBUPROFEN) – ANALYSIS BY CAPILLARY ELECTROPHORESIS
AND HPLC COUPLED WITH OFF-LINE SPE
I declare to be the author of this work, which is original and unpublished. Authors and works consulted are duly cited in the text and are included in the list of references.
The University of Algarve reserves the right, in accordance with the provisions of the
Copyright and Related Rights Code, to file, reproduce and publish the work, regardless of the medium used, as well as to disseminate it through scientific repositories and To allow their copying and distribution for purely educational or research purposes and not for commercial purposes, provided that due credit is given to the respective author and publishe
Acknowledgement
My EMQAL journey has been a fantastic and challenging experience and its completion was possible through immeasurable support and encouragement.
I would like to give immense thanks to Professor Maria Clara Costa who generously supported and guided me through the successful completion of my RMT year. She also provided personal encouragement in my adjustment and enjoyment of life in Faro. I thank profusely Professor Marina Franco Maggi Tavares for the opportunity to learn at USP and her invaluable academic guidance and support for thesis completion. Her personal consideration also allowed me to fully appreciate my first time in Brazil. The academic and professional achivements, kindness and patience of my RMT supervisors are models for me.
I give a hearty thank you to Professor João Pedro Simon Farah whose expert advice was crucial to my research. I extend my thanks to Professor Maria Conceicão Mateus for her kind generousity in allowing my use of her lab equipment and providing technical guidance in HPLC. My thanks also goes to Vera Gomes and CCMAR for providing access to their
equipment to complete research. I say thank you to Águas do Algarve for the generous gift of the aerobic granules to start the reactor.
I must note an appreciative thanks to Professor Piotr Konieczka and Gabrysia Bajger-Nowak for their kindness and support in my first year at the Gdańsk University of
Technology. I also thank the EMQAL PMT and professors for their work and dedication to providing professional and academic enrichment through this programme.
My RMT year was enriched through meeting and working with several colleagues who motivated me with their kindness, encouragement and enthusiasm for life and learning.
As such, my sincere and deepest thanks starts with Tania Luz Palma who extended her support technically and personally far above and beyond the expected. Her cheer and
optimism and willingness to help me have a good thesis and life in Portugal will be forever remembered and appreciated. I give a very big thank you to Mr. Rui Rojo Palmawho generously gifted his time and expertise for realization of the reactors. I thank Jorge Daniel Dias Carlier for his help in the lab, advice and his personal support.
There are not enough words for me to express my gratitude and indebtness to Carolina Raissa Costa Picossi and Daniel Rossado Oliveira who not only gave their expertise and time in lab training and support, but worked assiduously to complete research as if it were their own. I am more fortunate for their friendship and their good spirits that make them not only
great colleagues but friends. I also thank my lab colleagues and host family for making me feel at home in São Paulo.
Moni, Valeree, John, Mulu, Tamirat, Muhammed, Luz, Su, Inal, Pasha, I will be forever glad to be part of the EMQAL 8th edition and the formation of our bonds through our laughs and love of Polish life, travel adventures, dinners, birthday celebrations, challenging classes and assignments. Thank you for allowing me to be your student representative.
Astrid, my favourite partner in group assignments and travel, we have shared many highs and lows in the past two years but we have emerged stronger and all the better for it. You show me how to be work through adversity and maintain high academic standards. Your friendship has been a tremendous and unexpected reward of EMQAL.
Last not certainly not least, I give warmest thanks to my family. Across the oceans, I always had and felt your love, pride and encouragement and wanting me to make the most of this opportunity. Thank you for everything you have done and continue to do.
Abstract
Keywords: high performance liquid chromatography, micellar electrokinetic chromatography,
capillary electrophoresis, ibuprofen, metabolites, validation, wastewater, aerobic granule
Pharmaceuticals have become priority emerging environmental pollutants. Environmental monitoring and toxicological studies are essential to establish maximum permissible limits in the environment. Furthermore, innovative wastewater treatment is required for their degradation. Águas do Algarve is constructing an aerobic granule plant to modernize wastewater treatment for the cities of Faro and Olhão. The company is interested in research regarding granule ability to degrade pharmaceuticals detected in wastewater influent.
Two aerobic granule sequencing batch reactors were constructed and operated at laboratory scale using different cycles (anaerobic/aerobic and aerobic). The efficiency of the reactors and type of operating conditions was investigated for the degradation and removal of ibuprofen and its metabolites 2-hydroxyibuprofen, 1-hydroxyibuprofen and carboxyibuprofen.
Two methods, high performance liquid chromatography (HPLC) and micellar electrokinetic chromatography (MEKC), a form of capillary electrophoresis, coupled with UV/Vis, were developed to detect and quantify ibuprofen and its metabolites. Solid phase extraction was used to preconcentrate the compounds to method detection limits, however recoveries were problematic. Eluents were dried and reconstituted in solvent (milli-q water) for compatibility to both methods. Separation conditions for the compounds were optimized. Both methods were validated in solvent (milli-q water) for linearity, recovery, LOD, LOQ, precision (repeatability and intermediate precision), range and selectivity. Selectivity could be obtained for both methods. However, acceptable linearity, LOD, LOQ, repeatability and recovery could not be established in the desired working range. Additionally, robustness problems particularly for the MEKC method may have affected validation results. For some compounds, both methods failed to meet statistical tests applied for acceptance of linearity and repeatability. Solvent and synthetic wastewater calibration were compared using student’s t-test. There was no statistically significant difference between the curves for the HPLC method in contrast to those of the MEKC method.
The methods were applied to synthetic wastewater samples taken from the SBRs. Each method detected different analytes with 1-hydroxyibuprofen observed in HPLC and
carboxyibuprofen observed in MEKC. The calculated concentrations exceeded method range. Revalidation of both methods and reanalysis of the samples is required to verify accuracy of
List of Figures
Figure 1. Pharmaceutical emission pathways into the aquatic and terrestrial environment ... 14
Figure 2. Ibuprofen mode of action on the COX pathway ... 15
Figure 3. Chemical structure of IBU, 1OH, 2OH and CBX ... 16
Figure 4. Water quality and safety legislation in Brazil ... 16
Figure 5. Water quality and safety legislation in the EU and Portugal ... 17
Figure 6. Distribution detection of Ibuprofen and environmental matrix of study ... 18
Figure 7. Schematic representation of aerobic granule stratified structure164 ... 21
Figure 8. Operating cycle of aerobic SBRs ... 22
Figure 9. Schematic representation of HPLC system245 ... 25
Figure 10. Important factors for liquid chromatography separation ... 26
Figure 11. Graphical representation of Van Deemter's equation320 ... 29
Figure 12. Schematic representation of a CE system showing ion separation by mass and charge and generated electropherogram321 ... 31
Figure 13. Important factors for CE separation ... 32
Figure 14. Schematic representation of anion migration in different CE EOF ... 35
Figure 15. Schematic representation of FASS (a) immediately after voltage application (b) after stacking is completed318 ... 36
Figure 16. Schematic representation of FASI ... 36
Figure 17. Schematic representation of typical SPE procedure297 ... 40
Figure 18. Structure of benzoic acid303 ... 42
Figure 19. Schematic representation of reference standard solution preparation ... 50
Figure 20. Solid Phase Extraction: (A) SPE equipment used and (B) Speed vac concentrator (C) procedure performed ... 52
Figure 21. Schematic representation of the two SBRs ... 53
Figure 22. A) Varian 380-LC HPLC (B) Agilent 1220 Infinity Series HPLC ... 56
Figure 23. Shimadzu Prominence-i LC-2030 HPLC ... 56
Figure 24. Beckman Coulter ProteomeLab PA800 CE System ... 59
Figure 25. UAlg HPLC optimized conditions: 10 mM ammonium acetate buffer pH 4.5: methanol (65:35 v/v) ... 69
Figure 26. Exploratory gradient for compound separation in water and acetonitrile, both with 0.01% formic acid, v/v ... 70
Figure 27. Optimized HPLC gradient conditions ... 71
Figure 28. HPLC: Verification of benzoic acid suitability as internal standard ... 71
Figure 29. HPLC calibration curve for 2OH in water ... 72
Figure 30. HPLC calibration curve for 2OH in synthetic wastewater ... 74
Figure 31. Graph of effective mobilities and response function vs pH ... 75
Figure 32. Electropherogram of separation of 2OH, 1OH, IBU and CBX in acetate buffer, pH 5 ... 75
Figure 33. Representation of MEKC separation with SDS275 ... 77
Figure 34. 23 factorial designed electropherograms ... 78
Figure 35. Electropherogram showing the compounds with internal standard benzoic acid .... 79
Figure 36. MEKC separation using 15 mM borate, 40 mM SDS, 15% THF ... 80
Figure 37. Peak heights obtained with injection of the water plug before the sample ... 80
Figure 39. CE calibration curve for 2OH in synthetic wastewater ... 83
Figure 40. Comparison of peaks detected in the synthetic wastewater control A. HPLC B. MEKC ... 85
Figure 41. Determined 1OH concentrations using HPLC method ... 85
Figure 42. CE experiment optimized conditions used for method validation ... 86
Figure 43. Chromatogram of benzoic acid merged with 2OH in standard concentration 15 µg/L ... 86
Figure 44. COD removal during 27 days of operation ... 92
Figure 45. Phosphorus removal during 27 days of operation... 92
Figure 46. Ammonia removal during 27 days of operation ... 92
Figure 47. Nitrogen concentration in reactor influent and effluent during 27 days of operation ... 92
List of Tables
Table 1. Structure and physico-chemical properties of compounds of interest ... 15
Table 2. Measured ibuprofen and metabolite concentration ranges and aquatic matrix of study ... 19
Table 3. Factors critical to aerobic granule formation and SBR operation ... 23
Table 4. Effect of selected chromatographic separation conditions on retention (k/k*), selectivity (α) ... 30
Table 5. Full factorial screening designs and their parameters ... 38
Table 6. Parameters and kits used for characterization of the SBR influent and effluent ... 49
Table 7. Actual concentrations of primary and intermediate standard stock solution and working standard solution ... 50
Table 8. Preparation and actual concentrations of working standard solutions used in method development, optimization, calibration curve ... 51
Table 9. Preparation of primary and intermediate standard stock solutions ... 51
Table 10. Preparation of standard solution used in method development and optimization ... 51
Table 11. Preparation of standard solution series for calibration curve ... 51
Table 12. Phases and duration of reactor operating cycle ... 54
Table 13. Mobile phases tested during method development at UAlg ... 57
Table 14. Mobile phases tested during method development at USP ... 58
Table 15. Optimized chromatographic conditions for separation of Ibuprofen and metabolites ... 59
Table 16. Optimized gradient programme for separation of Ibuprofen and metabolites ... 59
Table 17. BGE and conditions examined for CE method development ... 60
Table 18. Optimized MEKC conditions for separation of Ibuprofen and metabolites ... 61
Table 19. Supporting instruments and equipment ... 62
Table 20. Selected factor affecting resolution of critical pair and levels ... 63
Table 21. Full factorial Design 22 employed for investigating resolution of critical peak pair 63 Table 22. Selected factor affecting resolution of critical pair and levels ... 64
Table 23. Full factorial Design 23 employed for investigating resolution of critical peak pair 64 Table 24. Mean SPE recoveries in milli-q water, 95% confidence interval, Strata C18e cartridges (n=3) ... 67
Table 25. Recoveries calculated from calibration curve for blank matrix spiked post SPE ... 67
Table 26. Chromatographic quality parameters for optimized HPLC method ... 72
Table 27. Validation results for HPLC method in milli-q water ... 72
Table 28. HPLC: Recoveries obtained for the compounds, n=1 ... 73
Table 29. Regression parameters for synthetic wastewater calibration curves ... 74
Table 30. Response function results for the 23 factorial design ... 77
Table 31. Chromatography quality parameters for optimized MEKC method ... 79
Table 32. Validation parameters for MEKC curve in solvent ... 81
Table 33 Recoveries obtained for the compounds in MEKC, n=1 ... 83
Table 34. Regression parameters for synthetic wastewater calibration curve ... 83
Table 35. Comparison of validation results of HPLC, MEKC and other methods developed for compounds of study ... 89
Table 36. Comparison of experimental conditions and extraction procedure of HPLC, MEKC and other methods applied to compounds of study ... 90
List of Abbreviations and Symbols
α Selectivity
1OH 1-hydroxyibuprofen
∆φ change in organic solvent (%B) during gradient σ1, σ2, σ3 User selected adjustable weights
2OH 2-hydroxyibuprofen
a y-intercept
AOAC Association of Official Analytical Chemists
b Slope
%B Change in organic solvent
BA Benzoic acid
BGE Background electrolyte
CBX Carboxyibuprofen
CE Capillary electrophoresis
COD Chemical Oxygen Demand
COX Cyclooxygenase
CEF Chromatographic exponential function CRF Chromatography response function CRS Chromatographic resolution statistic
CV Coefficient of variance
d2
c column internal diameter
DAD Diode array detector
EOF Electroosmotic flow
EU European Union
f Number of degrees of freedom
F Flow rate
Fmax Calculated Fmax value for Hartley’s Fmax test
Fmaxo Critical Fmax value for Hartley’s Fmax test
FASS Field-amplified sample stacking
FASI Field-amplified sample injection
HCl Hydrochloric acid
HPLC High Performance Liquid Chromatography ICH International Conference on Harmonization
i.d Internal diameter
k Number of factors for experimental design k Isocratic retention factor
k* Gradient peak retention factor
L Column length
Ldet Length to detector
Ltot Total length
LC-MS Liquid chromatography-mass spectrophotometry
LOD Limit of detection
LOQ Limit of quantification
MEKC Micellar electrokinetic chromatography
n Number of result: for response function – number of solutes in sample
np Number of peak pairs
NSAID Nonsteroidal anti-inflammatory drug
Qcrit Calculated value of Dixon’s Q test
Q1 Smallest calculated value of Dixon’s Q test using smallest result Qn Calculated value of Dixon’s Q test using number of results
r Correlation coefficient
RP Number of resolved peaks
Rcp Resolution of critical peak pair
Ri, i+1 Resolution between adjacent solute pairs Rm Average resolution of all solute pairs Rmin Minimum acceptable resolution Ropt Optimum resolution
Rs Chromatography resolution
Rsum Resolution sum
SBR Sequencing batch reactor
SD Standard deviation
SD2
min Smallest standard deviation SD2
max Largest standard deviation
SDS Sodium dodecyl sulphate
SPE Solid phase extraction
t Calculated value for student’s t test
tap Analyte migration time
teo Time of EOF marker
t0 Column dead time
ti Migration time of first solute tcrit Critical value for student’s t test tf Migration time of final solute
tG Gradient time
tm Migration time
tmax Maximum desired runtime
tmin Minimum desired runtime tn Migration time of final solute
tr Retention time
THF Tetrahydrofuran
µef Effective mobility
µeof Electroosmotic flow mobility UAlg Universidade do Algarve
USP Universidade do São Paulo
UV/Vis Ultraviolet visible
V Applied voltage
Veof Electroosmotic velocity
Vef Effective velocity
Vap Apparent velocity
Vm Column dead volume
x Analyte concentration corresponding to the measured signal x1 Smallest value in result series
xn Largest value in result series
Wb Peak width at baseline
Table of Contents
Acknowledgement ... 1 Abstract... 3 List of Figures ... 4 List of Tables ... 6 Objective of Study ... 121. Introduction and Literature Review... 13
1.1 Pharmaceuticals: Emerging Pollutants in Water ... 13
1.2 Compounds of Study: Ibuprofen and Metabolites ... 14
1.3 Water Quality Legislation and Monitoring ... 16
1.4 Environmental Detection and Risk Assessment of Ibuprofen and Metabolites ... 18
1.5 Wastewater Treatment of Ibuprofen and Metabolites ... 19
1.6 Aerobic Granular Sludge ... 20
2. Analytical Methodology ... 24
2.1 Analytical Methods Employed to Analyse Ibuprofen in the Aquatic Environment ... 24
2.2 High Performance Liquid Chromatography (HPLC) ... 25
2.2.1 Reverse Phase Chromatography ... 25
2.2.2 Chromatographic Quality Parameters ... 27
2.2.3 Optimization of Chromatographic Separation... 30
2.3 Capillary Electrophoresis (CE) ... 30
2.3.1 Micellar Electrokinetic Capillary Chromatography ... 35
2.3.2 On-line Preconcentration: Stacking ... 36
2.4 HPLC and CE UV/Vis Detectors ... 37
2.5 Experimental Design ... 37
2.6 Chromatographic Response Functions ... 38
2.7 Solid Phase Extraction (SPE) ... 39
2.8 Internal Standard Calibration ... 41
2.9 Method Validation ... 42 2.9.1 Specificity... 42 2.9.2 Linearity ... 43 2.9.3 Range ... 43 2.9.4 Precision ... 43 2.9.5 Limit of Detection ... 44 2.9.6 Limit of Quantification ... 45 2.9.7 Accuracy... 45 2.9.8 Robustness ... 45
2.10 Statistical Analysis ... 45
2.10.1 Student’s t-test ... 45
2.10.2 Hartley’s Fmax Test... 46
2.10.3 Dixon’s-Q Test ... 46
3. Materials and Methods ... 47
3.1 Reagents and Materials ... 47
3.1.1 Reagents ... 47
3.1.2 Materials ... 49
3.1.3 Experimental Preparation ... 49
3.2 Solid Phase Extraction ... 52
3.3 Configuration and Operation of Sequencing Batch Reactors ... 53
3.3.1 SBR set-up... 53
3.3.2 Operation ... 54
3.3.3 Introduction of Ibuprofen and Samples ... 55
3.4 High Performance Liquid Chromatography ... 55
3.4.1 Instrumentation ... 55
3.4.2 Method Development and Optimization ... 57
3.4.3 Identification and Quantification of Ibuprofen and Metabolites ... 59
3.5 Capillary Electrophoresis ... 59
3.5.1 Instrumentation ... 59
3.5.2 Method Development and Optimization ... 60
3.5.3 Stacking ... 60
3.5.4 Background Electrolyte Preparation ... 61
3.5.5 Identification and Quantification of Ibuprofen and Metabolites ... 61
3.6 Supporting Instruments, Equipment, Materials ... 61
3.7 Experimental Design ... 63
3.7.1 HPLC: Optimization of Critical Resolution ... 63
3.7.2 MEKC: Optimization of Critical Resolution and Migration time ... 63
3.8 Method Validation ... 64
3.9 Application of HPLC and MEKC Methods to SBR Samples ... 65
4. Results and Discussion ... 66
4.1 Overview of Thesis Experimental Plan and Work ... 66
4.2 SPE ... 67
4.3 HPLC ... 68
4.3.1 Method Development and Optimization ... 68
4.3.2 Validation ... 72
4.4.1 Method Development and Optimization ... 74
4.4.2 Stacking ... 80
4.4.3 Method Validation ... 81
4.5 Application of HPLC and MEKC Methods to Real Samples ... 83
4.6 Comparison of the Methods and Robustness ... 86
4.7 Comparison to Published Literature ... 87
4.8 Performance of Aerobic Granule SBRs ... 91
5. Conclusions ... 94
6. Future Perspectives ... 96
7. Bibliography ... 97
8. Annexes ... 120
Annex 1. Statistical Tests and Critical Tables311 ... 120
Annex 2. SPE Results ... 123
Annex 3. HPLC Method Development Calculations and Chromatograms ... 124
Annex 4. HPLC Validation Graphs and Calculations ... 126
Annex 5. CE Electropherograms ... 129
Objective of Study
The first objective of the study was to develop, optimize and validate new analytical methods for the detection and quantification of ibuprofen and the three metabolites, 1-hydroxyibuprofen, 2-hydroxyibuprofen and carboxyibuprofen in synthetic wastewater. The compounds were chosen due to frequent detection in wastewater treatment plants (WWTP) influent and effluent, surface (rivers/lakes/streams), ground and drinking waters. The methods developed were high performance liquid chromatography (HPLC) initiated at the
Universidade do Algarve (UAlg) and completed at the University of São Paulo and capillary electrophoresis (CE) at the University of São Paulo (USP). Both methods were used to detect and quantify the compounds in synthetic wastewater samples taken from two aerobic granular sequencing batch reactors (SBRs). Separation conditions for both methods were optimized for resolution of compound peaks and analytical time, then validated for the application. Solid phase extraction was performed to pre-concentrate the analytes, facilitating analysis at the trace concentration range commonly detected in the environment and for the dosage applied to the reactors. The performance of both methods would be compared statistically using student’s t test for the results of sample analysis. Solvent and synthetic wastewater calibration curves would also be compared using student’s t-test to assess matrix effect on validation parameters.
The second objective of the study was the construction and operation of two aerobic granule SBRs at laboratory scale. Both SBRs were operated using different cycles,
anaerobic/aerobic and aerobic conditions respectively to compare the efficiency of this wastewater treatment and the type of operating cycle on the degradation and removal of ibuprofen and the metabolites. Samples for analysis were taken at selected timepoints during one cycle for analysis by the HPLC and CE methods.
1. Introduction and Literature Review
1.1 Pharmaceuticals: Emerging Pollutants in Water
Pharmaceuticals are indispensable to the preservation of global public health1. Consumption has increased concurrent to prolonged human life expectancy, shifting population demographics, rising global population, rapid urbanization, research advancement and enhanced market availability and affordability1–3. Consequently, pharmaceuticals, their metabolic and transformation products are increasingly detected in trace concentrations (ng to µg/L) in the aquatic (surface, ground and drinking waters) and terrestrial (soil and manure) environment and wastewater treatment plants, garnering great concern as emerging environmental pollutants2–7.
Extensive environment studies have been published, with emphasis on the predominantly used therapeutic classes such as nonsteroidal anti-inflammatory drugs (NSAIDs). Current knowledge is limited on the definitive effects of all detected pharmaceuticals. Nevertheless, research has given evidence to the potential damage resulting from the bioaccumulative effects of chronic exposure and continuous introduction into the environment2,3,7–9. Their potentially dangerous environmental impact arises from their inherent ability for unhindered biological activity at sub-therapeutic concentrations2,8,10,11.
Apprehension is greatest for aquatic pollution due to the inescapable life-cycle exposure of these organisms and possible disruption of the food chain at the primary producer level6,8. Metabolic or transformation products may exhibit similar or higher toxicity than parent compounds12,13. A database compiled by the United Nation’s Strategic Approach to International Chemicals Management revealed the detection and quantification of 671 pharmaceuticals inclusive of their metabolic and transformation products in 71 countries. The data, while collected mainly from Western Europe, United States and Canada, indicate that this is a global problem2.
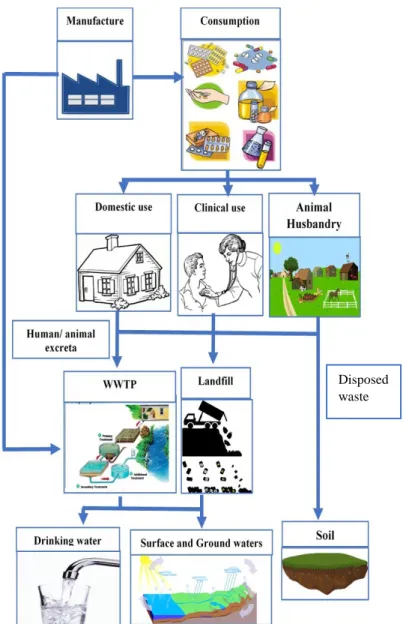
Pharmaceuticals are introduced to the aquatic and terrestrial environment through anthropological activities including industrial production, animal husbandry, household and clinical use and effluent from wastewater treatment plants (WWTPs) (Figure 1) 2,3,7,14. WWTPs are the dominant emission pathway, particularly for the aquatic environment. Human and animal excreta (faeces and urine), remnants of industrial production and discarded clinical and domestic pharmaceutical waste are
transported via the sewage system to WWTPs and released via wastewater effluent into the
environment2,7,10,15,16. The pharmaceuticals detected and their concentration are
contingent upon location of the WWTP, season and
geographical region2,3. This problem arises from the operational intent of WWTPs, which are designed for the treatment of biological waste to reduce carbon, nitrogen and phosphorus loads.
Additionally, WWTPs employ a high degree of dilution during treatment and release, hindering the contact time9. Many pharmaceuticals, their metabolites and transformation
products are resistant to the treatment, hence their persistence in WWTP effluent2,17.
1.2 Compounds of Study: Ibuprofen and Metabolites
This thesis focuses on ibuprofen (IBU), one of the most popular NSAIDs available on the market, and its metabolites - 1hydroxyibuprofen (1OH), 2-hydroxyibuprofen (2OH) and carboxyibuprofen (CBX). Ibuprofen, discovered in 195018, is designated as an essential medicine by the World Health Organization. The pharmaceutical is easily available via prescription and over the counter and used in pain, inflammation and other chronic arthritic treatment19,20. Brazil is a substantial consumer of pharmaceuticals concomitant to its large population but accurate, reliable data on volume and therapeutic classes used, is difficult to obtain21. For Portugal, the latest INFRAMED data shows that 2011 sales of over two million packages 22.
Disposed waste
Figure 1. Pharmaceutical emission pathways into the aquatic and
Pain and/or fever due to infection and/or injury stimulate the cyclooxygenase (COX)
pathway where COX-1, COX-2 are involved in prostaglandin
synthesis. This activates the vertebrate and invertebrate inflammatory response to initiate curative measures. Ibuprofen acts as a non-selective inhibitor through reversible binding to both COX isozymes, reducing their activity and consequently prostaglandin synthesis and inflammation (Figure
2). These enzymes also play critical roles in prostaglandin synthesis in the reproductive, gastro-intestinal, blood and nervous systems 23–25.
Human metabolism produces 1-hydroxyibuprofen, 2-hydroxyibuprofen and
carboxyibuprofen 20,26. Their structure and conversion from the parent compound are shown in Figure 327. These products are observed in environmental studies of
ibuprofen biodegradation in wastewater, except that CBX is produced first and generally has the higher concentration 27–32. The pharmaceutical is almost completely metabolized, with 15% of ingested IBU excreted in urine, 25-26% as 1OH and 2OH and 37-46% as CBX20,33. The compounds are weak hydrophobic acids, possessing carboxyl (COOH) and aromatic benzene ring functional groups. Their chemical names and physicochemical properties are given in Table 127.
Table 1. Structure and physico-chemical properties of compounds of interest
Compound Chemical Name Molecular Weight g/mol pKa Log Kow Ibuprofen 2-(4-Isobutylphenyl)propanoic acid 206.281 4.91 3.97 1-hydroxyibuprofen 2-[4-(1-Hydroxy-2-methylpropyl)phenyl]propionic acid 222.284 4.55 2.69 2-hydroxyibuprofen 2-[4-(2-Hydroxy-2-methylpropyl)phenyl]propionic acid 222.284 4.63 2.37 Carboxyibuprofen 3-[4-(1-carboxyethyl)phenyl]-2-methylpropanoic acid 236.267 3.97 2.78
Figure 2. Ibuprofen mode of action on the COX pathway
Arachidonic acid release COX-1/COX-2 Activation Inflammatory response Prostaglandin synthesis Pain/ Fever/ Infection/Injury Ibuprofen
1.3 Water Quality Legislation and Monitoring
The United Nations highlights the fundamental importance of ecological conservation and sustainability of good, safe and adequate water and treatment of urban wastewater for public health and socioeconomic development34. Countries have enacted regional and/or national legislation to meet this global priority. Brazil legislates water quality and conservation by the National Water
Resource Policy and National Water Resource Management System, reinforced by additional state regulations (Figure 4)35. The European Union (EU) uses the Water Framework Directive 2000/60/EC to establish policies and measures for water quality, safety, resource conservation and pollution reduction. Supplementary directives36–38 are enacted for prioritization and environmental monitoring of selected compounds 39– 42, environmental quality standards42, wastewater collection, treatment and discharge
regulation 43,44 and sewage sludge use in agriculture45 (Figure 5). Recognizing
pharmaceuticals as emerging environmental pollutants, Directive 2013/39/EU, updates the Water Framework Directive to initiate their inclusion to the watch list of
environment priority compounds for monitoring and specific action. The aquatic environment is the predominant matrix of concern. The list is subject to revision arising from research identifying other pharmaceuticals as environment risks.
Brazil
National Law
Water Law, 1997, Law No. 9.433
establishing National Water Resource Policy and Resource Management
System
State Law
E.g. State of São Paulo, Decree No. 32.955,
1991
Figure 4. Water quality and safety legislation in Brazil
2-hydroxyibuprofen
Carboxyibuprofen 1-hydroxyibuprofen
Ibuprofen
Individual member states such as Portugal, enact EU directives through national-specific legislation (Figure 5)35,46.
It is recommended that environmental regulatory agencies focus monitoring programs by selecting priority pharmaceuticals based on country specific consumption and environment risk assessments. This allows the calculation and evaluation of pharmaceutical environmental liability by predicted or measured environmental concentration and toxicity data to three different trophic levels of the aquatic
ecosystem (algae, daphnids and fish). However, the certainty of minimal environmental impact from pharmaceuticals deemed to have no or low risk (≤1), has been questioned for several reasons. Risk assessments are conducted on individual pharmaceuticals, excluding their realistic occurrence in the environment as mixtures with the same or different therapeutic classes and other compounds. Some studies proved significant additive effect and higher toxicities of pharmaceutical mixtures from same or different therapeutic class on algae47–53. Additionally, the ecotoxicological impact of chronic
exposure over the lifespan of aquatic organisms and the toxicity of pharmaceutical metabolites are rarely studied 54–56. These considerations along with the inherent
pharmaceutical ability for biological activity at sub-therapeutic concentrations, have prevented the establishment of maximum permissible limits for ibuprofen and other
Figure 5. Water quality and safety legislation in the EU and Portugal Water resource protection
and conservation
Water Framework Directive 2000/60/EC
Environmental Priority Compound Watch List
Decision 2455/2001/EC Directive 2013/39/EU Environment Quality Standards Directive 2008/105/EC Drinking Water Directive 98/93/EC Bathing Water Directive 2006/7/EC Wastewater regulation Directive 91/271/EEC Directive 98/15/EC Directive 86/278/EEC Shellfish Waters Directive 2006/113/EC EU Portugal Water pollution Decree-Laws No. 58/2005 and 208/2008 Monitoring of environmental priority compounds Decree-Laws No. 83/2011 and 103/2010
pharmaceuticals in surface and ground waters and treated wastewater effluent. Monitoring data and assessments of chronic ecotoxicological effects are required to define these limits and select pharmaceuticals for monitoring programmes22,54,57,58.
1.4 Environmental Detection and Risk Assessment of Ibuprofen and Metabolites
The EU is considering the
addition of ibuprofen to the watch list of
priority
pharmaceuticals of environmental concern, due to the frequent detection in the aquatic environment and potential impact 59–61.
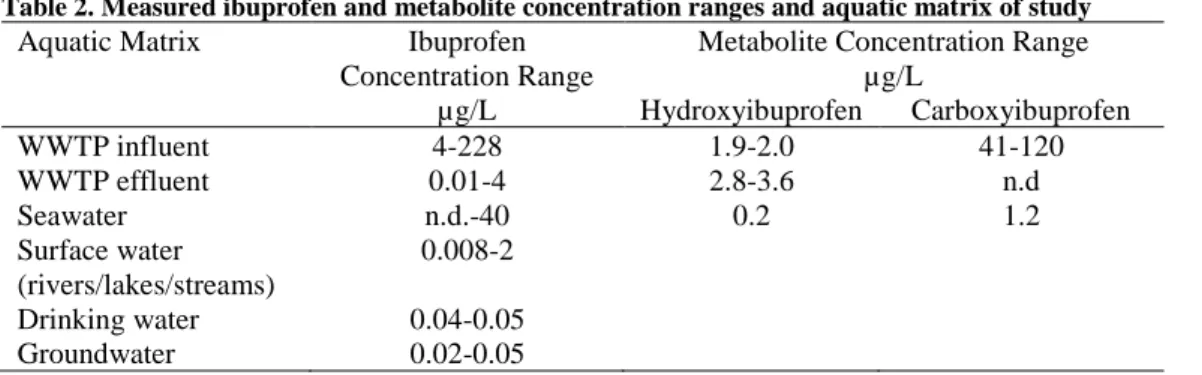
Its medical popularity means it has been extensively studied to evaluate its presence and potential risk in the environment. In literature review for this thesis, wastewater influent and effluent was the most studied environmental matrix and had the highest rate of ibuprofen occurrence as shown in Figure 6 17,22,32,54,57,62–101. In the United Nation Strategic Approach to International Chemicals Management database, ibuprofen is ranked as the third most detected pharmaceutical in surface, drinking and ground waters and is detected in 47 countries2. The concentrations measured and aquatic matrix studied are given in Table 2. Few studies include the metabolites, which were typically found in greater concentration than the parent compound, particularly in WWTP effluent. This indicates degradation and metabolite formation before entry into WWTPs and during the treatment process32,87,102. In the last few years, researchers have recommended extending environmental studies to include metabolites12,55,103,104. Higher concentrations are measured in colder countries, colder seasons and WWTPs close to densely populated areas57,101. In Brazil, studies of several Rio de Janiero WWTPs measured average ibuprofen concentration ranges in influent of 1-27 µg/L and effluent of 4.7- 40 µg/L, consistent to a large population80. In Portugal, measured mean influent concentrations were 3, 3.9, 5.3, 9.80 µg/L in spring, summer, autumn and winter respectively with lower effluent concentrations
4. 2% 33. 19% 10. 6% 58. 33% 58. 33% 6. 4% 2. 1% 4. 2% Ground water Surface waters (rivers/lakes/streams) Seawater WWTP Influent WWTP Effluent Sludge Soil Drinking Water
of 0.16, 0.3, 1.5, 1.8 µg/L in spring, summer, autumn and winter respectively22,57.
The highest concentrations are observed in the Algarve, Alentejo and Center regions in the winter influenced by population size and colder temperatures, where individual WWTPs concentrations could be as high as 30 µg/L.
Table 2. Measured ibuprofen and metabolite concentration ranges and aquatic matrix of study
Aquatic Matrix Ibuprofen Concentration Range
µg/L
Metabolite Concentration Range µg/L Hydroxyibuprofen Carboxyibuprofen WWTP influent 4-228 1.9-2.0 41-120 WWTP effluent 0.01-4 2.8-3.6 n.d Seawater n.d.-40 0.2 1.2 Surface water (rivers/lakes/streams) 0.008-2 Drinking water 0.04-0.05 Groundwater 0.02-0.05
n.d-below limit of detection
Numerous studies have been conducted to assess the environment toxicity and risk of ibuprofen with differing results. Some have classified ibuprofen as low risk in surface and wastewaters22,57,105. In contrast, several authors mark ibuprofen as a
significant environmental risk21,55,77,86,106–108. No risk assessments have been performed for the metabolites. It is believed they have no pharmacological activity109,110, however one study has shown the toxicity of 1OH and 2OH to luminescent bacteria111.
Toxicity studies have proven that ibuprofen is an aquatic environmental hazard, as a single compound or magnified with other pharmaceuticals49,107. Through its
therapeutic action as a COX inhibitor, it causes toxic inhibition of growth, reproductive and inflammatory response of organisms at the trace concentrations commonly
measured in the aquatic environment. These include primary producers - algae50,112–117, phytoplankton50,112, rotifers118 and zooplankton50 and common food sources such as
fish119–123, mussels124–130, clams131 and oysters132. It also promotes the proliferation of
cyanobacteria in competition with algae112. The targeting of primary producers and food sources has potential disruption to the food chain and entire ecosystem.
1.5 Wastewater Treatment of Ibuprofen and Metabolites
Conventional biological and/or chemical methods are used to treat WWTP influent for the production of effluent that meets quality and safety standards43,44,133,134. Pharmaceutical removal from WWTPs is reliant upon its physicochemical properties, the treatment method, operational conditions and season135–137. Research has
including aerobic and anaerobic biodegradation, sorption to WWTP sludge and oxidation 9,134,138. Biological treatment is greatly favoured for its high efficiency, low cost and utilization of the metabolism of naturally occurring microbial communities to remove or transform compounds to nontoxic products139.
Ibuprofen has a high removal percentage in WWTPs ranging from 80-100% from influent to treated effluent, dependent on season and treatment
employed22,57,65,69,78,83,84,93,135,140,141. The metabolites exhibit similar removal, but it is uncertain whether this is mineralization or transformation to other compounds 27,142. Aerobic biodegradation has been confirmed as the key removal method of these compounds in WWTPs9,30,143–146. Studies have isolated the responsible bacterial strains147–152. Their chemical structure allows easy degradation by hydrolysis of the
carboxylic acid group and carbon atoms on the aromatic ring (cleaving the ring). Removal by sludge sorption is minor, due to their hydrophobicity and negative electrostatic charge derived from their Log Kow and pKas (Table 1) 9,143,144,153,154.
Despite its high removal in WWTP, ibuprofen is considered an emerging pharmaceutical pollutant. Widespread usage results in the presence of ibuprofen and the metabolites in WWTP effluent, surface, ground and drinking waters9,22,54,93. Additionally, ibuprofen appears to be merely transformed into compounds of similar complexity and properties instead of being completely degraded. Most studies of its removal, identify and quantify the parent compound only, excluding the metabolites. Furthermore, ibuprofen exists in two isomeric forms and the bacteria responsible for its biodegradation preferentially utilize the pharmacologically inactive isomer, resulting in higher concentration and slower degradation of the pharmacologically active
isomer28,32,88. These dual factors increase the likelihood of environment impact at trace concentrations of ibuprofen and its metabolites and highlight the need for innovation on wastewater treatment methods despite the high removal in conventional WWTPs.
1.6 Aerobic Granular Sludge
The aerobic granular sludge system is an innovative advancement in biological wastewater treatment155,156. It has several advantageous characteristics in comparison to conventional WWTPs, including high biomass retention, faster settling properties, capability of simultaneous COD, nitrogen and phosphate removal, good biosorption properties and high resilience to chemical toxicity and toxic shock load. Its simplicity and flexibility facilitates adaptability of operational cycles and conditions to
characteristics of wastewater influent, weather conditions, actual sludge conversion rates and desired effluent conditions with added benefits of lower operational costs and required operational land space157–161.
Extensive research has been conducted in lab scale to optimize the operational parameters including understanding the
mechanisms and bacterial processes162–167; influential factors for granule formation and maintenance such as optimal diameter, influent composition and start-up
inocolum162,164,168–173; reactor design, dimensions, operational
conditions156,166,174–182 and the compounds
that can be degraded by the granules158,159,167,183–185. The granules form by self-aggregation of microbial communities and have a stratified structure of aerobic and anaerobic layers (Figure 7). During aeration, polyphosphate and glycogen accumulating organisms employ growth metabolic processes using oxygen in the outer layer.
Simultaneously, nitrite oxidation by nitrite oxidizing bacteria in the aerobic zone and nitrite reduction by denitrifiers in the anaerobic zone occur respectively. Hence the granule capability for concurrent removal of COD, phosphorus and nitrogen 162–
168,179,186. Their stability and efficiency is directly dependent on their size (optimum
diameter of 2-4 mm), to which dissolved oxygen saturation levels are critical. Studies have shown the granules are highly resilient to toxic compounds. Their significant potential for application to pharmaceuticals and other toxic compounds lies in the adaptability of their biodegradation properties through tailoring of carbon source, influent composition and operational cycle158,159,167,183–185,187,188.The system is operated in sequencing batch reactors (SBRs) with a four-phase operational cycle as illustrated in Figure 8. Early studies of aerobic granule systems employed mainly aerobic cycles156. Subsequent optimization studies for granule stability, efficiency and effluent production conforming to EU standards, have determined that the anaerobic/aerobic cycle is best suited. Operational differences lie in the longer length of influent feeding and shorter aeration period in the anaerobic/aerobic cycle versus the aerobic cycle. SBRs can be started using activated sludge or already formed granules as inoculum. Several parameters can be monitored and/or measured to assess SBR efficiency and granules
Figure 7. Schematic representation of aerobic granule
consistently managed in operation of aerobic granule SBRs at lab-scale and considered in SBR construction for this study are described in Table 3.
Pilot plants were installed across Europe under the Nereda® company, initiating aerobic granules as a full scale urban wastewater treatment166,189–191. In Portugal, Águas do Portugal has operated the Lisbon Frielas Nereda plant since 2011 producing effluent conforming to EU urban wastewater regulations192. With its success, Águas do Algarve commenced the construction of a Nereda® WWTP plant in 2017, to service the cities of Faro and Olhão. The project was undertaken to address the current limitations of the existing Faro Noroeste and Olhão Nascente WWTP lagoon treatment systems to produce effluent that meet EU regulations due to increased capacity. Águas do Algarve aims to enact protection, rehabilitation, and sustainability measures to reduce pollution of the Ria Formosa Lagoon. The current systems are dual stage treatments, with influent first processed in activated sludge reactors, followed by UV treatment before release into the Ria Formosa193–197.
Studies have shown the great potential of aerobic granules in the treatment of wastewater containing pharmaceuticals (fluoroquinones, chirals, antibiotics and
NSAIDs), with degradation occurring after adaptation to the compounds198–203. Zhao et al. conducted the sole study on aerobic granule efficiency on ibuprofen degradation. An aerobic SBR operated with synthetic wastewater, was dosed with a mixture of ibuprofen, naproxen, prednisolone, norfloxacin, and sulfamethoxazole at a concentration of 50 µg/L respectively. The results showed a removal of only 34-45% compared with the other compounds which had low removal rates in the early stages but increased during the
Influent feeding (no aeration)
Uptake of carbon source by granule microbial communities Aeration Occurrence of nitrification, denitrification, COD, phosphorus and biodegradation Settling (no aeration) Granules allowed to settle to bottom of SBR Effluent Withdrawal (no aeration) Release of treated effluent
operational period. The author noted that the result may be due slower rate of aerobic biodegradation for ibuprofen. No studies thus far have examined the removal of the metabolites formed during wastewater treatment204. Further research is required to confirm the capability of aerobic granules to reproduce similar and/or better degradation patterns as found in conventional WWTPs.
Table 3. Factors critical to aerobic granule formation and SBR operation
Condition Recommendation Impact on Granule Formation and
Reactor Operation Ratio of SBR height to
SBR internal diameter
Large height to internal diameter ratio
Promote high shear force, microorganism proliferation and granule formation through selection of fast settling particles and washout of floccular sludge during settling time and effluent withdrawal
Temperature Room temperature (20-250C) Promotes granule stability as an
optimum condition for COD, nitrogen and phosphorus removal processes
Aeration Controlled air flow that produces
small air bubbles introduced at bottom of SBR
Promotes granule mixing with influent and aeration for COD, nitrogen and phosphorus removal processes Dissolved oxygen
saturation
≥ 20% 20-50% DO ensure granule stability
and efficiency, promoting a larger anaerobic layer with decreased penetration depth of oxygen and promote nitrification/denitrification processes.
pH Monitored and controlled as
necessary 7.0±0.2
Optimum condition for COD, nitrogen and phosphorus removal processes Hydraulic retention
time
< 8 h Promote microorganism proliferation
and granule stability by decreasing suspended biomass growth by washout in effluent withdrawal
Influent • Controlled flow introduced at
bottom of SBR • High COD
Good interaction with granules Promote microorganism proliferation, granule formation and stability.
Effluent withdrawal • At least 40% volume exchange
ratio (percentage difference between reactor volume and volume refilled after withdrawal) • Effluent withdrawal at
approximately SBR mid height
Volume exchange ratio > 40% selects for granule formation.
Withdrawal height selects for fast settling particles
2. Analytical Methodology
2.1 Analytical Methods Employed to Analyse Ibuprofen in the Aquatic Environment
The method of choice for pharmaceutical environment monitoring is high performance liquid chromatography (HPLC) coupled to tandem mass spectrometry (LC-MS/MS), because of high selectivity via unique mass to charge ratio of ionized analytes5,55,60. Literature review reveals numerous analytical methods for ibuprofen
with other pharmaceuticals. Ultraperformance liquid chromatography dominates the field 17,27,30,62,74,87,93,94,97,136,148,150,205–210, followed by LC-MS/MS85,101,204,209,211–216. Gas chromatography requires derivatization of the acidic compound, increasing analytical time32,55,62,95,96,98–100,217–221. Other detectors used are ultraviolet visible (UV/Vis) diode array detectors (DAD)147,222,223, DAD coupled to fluorescent86,153,224–227 and mass spectrometer221. Sample pretreatment by an extraction method was always performed for all studies to enrich pharmaceutical concentration to method detection and
quantification limits. Very few methods include the metabolites27,30,87,142.
Several capillary electrophoresis (CE) methods have been developed for the quantification of ibuprofen in pharmaceutical analysis 228–239 and environmental
analysis in surface water 240,241, tap water 242, wastewater92,243 and bottled water244. The quantity pales in comparison to liquid and gas chromatography. Ahrer et al. assessed ibuprofen analysis in surface water using HPLC-MS and CE-MS and determined that the methods were comparable. However, two extraction procedures were used to boost CE method detection limit comparable to HPLC, one was used for HPLC240. CE has
gained recognition as a viable alternative on par with HPLC, for pharmaceutical and clinical analysis with potential application to environmental analysis232,245–249.
Research potential remains for the development of rapid, simple, accurate and precise methods for environmental monitoring of specific pharmaceuticals, that include their metabolites5,55.Budget and experience limitations may restrict implementation of the complex liquid chromatography methods coupled with mass spectrometry. HPLC coupled to UV/Vis detectors can still be a feasible and cost effective analytical method with desired sensitivity, accuracy and precision. Environment method development can be difficult due to the complex matrices, potential interferences and the low limits of detection and quantification required (ng to µg/L).
2.2 High Performance Liquid Chromatography (HPLC)
The foundation for HPLC was laid in the 1900s by Tswett250,251. More than a century later, research advancements have transformed HPLC into a universal
separation technique for numerous compounds of wide-ranging physico-chemical properties. Its favoured advantages lie in fast, reliable separation, reproducibility, precision and accuracy of results and re-usability of chromatographic columns245,252.
Figure 9 presents the typical HPLC modular system configuration245. High pressure pumps drive mobile phase through
the column at a selected flow rate. Samples are injected manually or by autosampler, passing through the column where separation occurs and analytes generate a response in the detector. The column is installed inside an oven
whose temperature can be regulated. The entire system is monitored and controlled by a computerized software. Responses are displayed in chromatograms with peak area as a function of retention time. Analyte concentration in samples is calculated by comparison of response to that of reference standards245,253. HPLC separates analytes
by their differing affinity and interactions that creates different distributions to a solid column stationary phase and the liquid mobile phase251,254.
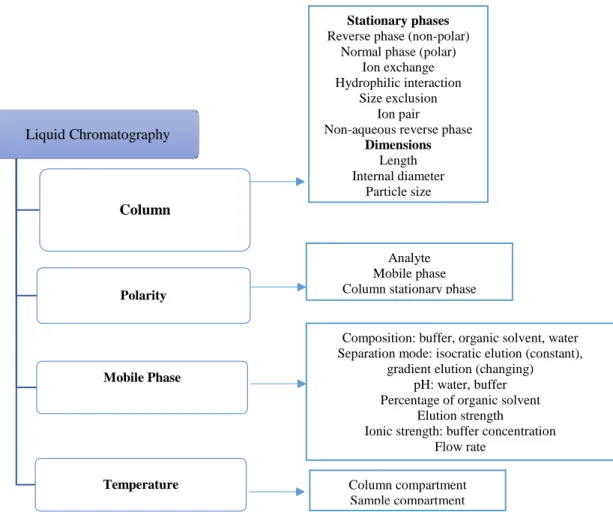
Liquid chromatographic techniques can be sub-divided according to the stationary phase of chromatographic column as shown in Figure 10. Various detectors exist for sample specific, bulk property measurement and hyphenated techniques including UV/Vis, fluorescent, mass spectrometer, tandem mass spectrometer251,254.
2.2.1 Reverse Phase Chromatography
Reverse phase chromatography works by differing analyte adsorption to the stationary phase and is recommended for separating compounds with the same functional group251,254. The stationary phases are non-polar and hydrophobic, while mobile phases are polar and hydrophilic. The principal chromatographic conditions controlling analyte separation are shown in Figure 10 251,254,255.
Figure 9. Schematic representation of HPLC system245
Isocratic or gradient elution modes are employed. Isocratic elution separates analytes using constant mobile phase composition, while gradient elution separates by increasing the percentage of organic solvent (%B) to continuously change mobile phase composition. A linear gradient is the simplest, maintaining constant change in %B during the run. The most appropriate gradient shape for analyte separation is identified in method development. Researchers recommend an exploratory linear gradient run to assess whether isocratic or gradient separation is most suited 255:
∆tr/tG Equation 1
where ∆tr is the difference in retention times of the final and first peaks. tG is the
gradient time. Isocratic elution is possible for values ≤ 0.25, while gradient elution is recommended for values ≥ 0.40. For intermediate values, the best elution mode is determined by experimentation. %B to be used to test isocratic elution is calculated by:
isocratic %B ≈ 6.3 (travg – tD) - 2 Equation 2
where travg is the average of the retention times of the first and last peaks and td is the
hold-up time and is determined by dividing the dwell volume by flow rate.
Liquid Chromatography Column Polarity Mobile Phase Temperature Stationary phases
Reverse phase (non-polar) Normal phase (polar)
Ion exchange Hydrophilic interaction
Size exclusion Ion pair
Non-aqueous reverse phase
Dimensions Length Internal diameter Particle size Analyte Mobile phase Column stationary phase
Column compartment Sample compartment
Composition: buffer, organic solvent, water Separation mode: isocratic elution (constant),
gradient elution (changing) pH: water, buffer Percentage of organic solvent
Elution strength
Ionic strength: buffer concentration Flow rate
1. Columns
Column selectivity is determined by type of stationary phase and analyte molecular structure that cause differing interactions such as hydrophobic and dipole-dipole. The strength of these interactions differs with analyte polarity. Analytes elute from least to most hydrophobic (highest to least polarity)245,251,254. Alkyl silica particles bonded to ligands such as C18 is the preferred reverse phase stationary phase, with pH range 2.5 - 7.5. The silica particle surfaces can also be chemically modified. Column length (typically 10-25 cm) and internal diameter (i.d.) (typically 2.0-4.6 µm) have a direct proportional effect on retention time. This results in reduced analysis time with shorter columns and smaller volumes of mobile phase used as internal diameter decreases. Particle size (typically 1.5–5 µm) is indirectly
proportional to column efficiency, which decreases as particle size increases245,251,252.
2. Mobile Phase
Reverse phase mobile phases are composed of water or buffer (solvent A) with volatile organic solvents usually methanol, acetonitrile or tetrahydrofuran (solvent B). Mobile phase polarity and elution strength are dependent on its composition (water, buffer type and concentration, %B, organic solvent and pH). This dictates analyte retention time, changing their affinities due to the different polarities of the stationary phase and mobile phase. Water is the weakest solvent, followed by methanol and then acetonitrile. Acetonitrile commonly applied for short analysis time. pH controls selectivity according to analyte pKa. pH can be adjusted to convert analytes to neutral or ionic form, changing retention time and elution order245,254,256. Elution strength is also controlled by separation mode, remaining constant during isocratic elution, but increasing incrementally during gradient elution245,256.
3. Temperature
Analyte retention is indirectly proportional to temperature, with retention time decreasing with increasing temperature which lowers mobile phase density245,256.
2.2.2 Chromatographic Quality Parameters
The following parameters are investigated during method development and optimization and then evaluated to assess chromatographic quality and separation:
1. Retention
The retention factor of an analyte is the ratio of the quantity of analyte in the stationary phase to the quantity in mobile phase and calculated using245,257:
Isocratic retention factor, k = (tr - t0)/t0 Equation 3
where tr is the analyte retention time; t0, column dead time, is the retention time of the
solvent peak. t0 is obtained from visual inspection of the chromatogram for the first
baseline disturbance, estimated using flow rate and column dimensions or determined by injection of an unretained compound such sodium nitrate.
Gradient retention factor (k*) = (0.87 tGF)/ Vm∆φS Equation 4
Where tG is the gradient time; ∆φ is the change in %B, S is assumed to be 4 for
analytes with molecular weights of 100 to 500 Da; F is flow rate and Vm is the column
dead volume, which can be directly measured or calculated from t0 by:
Vm =t0F ≈ 5x10⁻⁴Ld2c Equation 5
where L is column length (mm) and dc is column internal diameter (mm).
Chromatographic separation is controlled by adjusting experimental conditions to achieve 1≤ k/k* ≤ 10. If this is not possible, 0.5 ≤ k/k* ≤ 20 is acceptable. Retention time is used for identification of a compound in HPLC245,257.
2. Selectivity
Selectivity is the separation factor (α) between two peaks and calculated as245,257: α = k2/k1 Equation 6
Where k2 is the retention factor of the second peak and k1 the retention factor of the
first peak.
3. Resolution
Resolution (Rs) measures the distance of separation between two peaks and is
the chief objective of method development, particularly for the peak pair (critical peak pair) with the lowest separation (critical resolution). Baseline separation is necessary for accuracy of quantitative analysis and therefore resolution ≥ 2 is desired. If this is unachievable, resolution ≥ 1.5 is accepted245,257. Chromatographic selectivity and
efficiency control resolution by increasing distance between the peaks and reducing peak width respectively. Rs is calculated:
Rs = 2 (tr(2) - tr(1)) Equation 7
Wb(1) + Wb(2)
Where tr(2) is the retention time of the second peak; tr(1) is the retention time of the first
peak; Wb(1) and Wb(2) are the peak widths at baseline for both peaks respectively.
4. Efficiency
Chromatographic efficiency is defined by the plate number (N) which measures peak width compared to its retention time by the equations245:
N = 16 (t2r) Equation 8 or H = L Equation 9
Wb N
Where efficiency is measured per meter column with H as plate height and L as the column length.
Band broadening is controlled by retention times and peak widths, influenced by three effects summarized in the Van Deemter equation and illustrated in Figure 11:
H = A + B/u + Cu Equation 10
Where A is the effect of column packing, B is the effect of longitudinal diffusion as analyte molecules pass along the column and C is the effect of resistance to mass transfer due to analyte affinity between the mobile phase and stationary phase that dictates its retention in either phase.
Mobile phase velocity (flow rate) affects plate efficiency due to the differing
relationships with each effect, A is independent, B is inversely proportional while C is directly proportional.
5. Tailing Factor
Peak asymmetry affects the separation between two peaks and is evaluated by tailing factor. A tailing factor of 1.0 demonstrates good peak separation, > 2 indicates potential problems with separation and creates difficulties for peak integration in quantitative analysis245,255.
Figure 11. Graphical representation of Van Deemter's
2.2.3 Optimization of Chromatographic Separation
Method development focuses on the relationship between plate efficiency, selectivity and retention factor and their contribution towards chromatographic separation (resolution), described by the Purnell equation245,255,257:
Rs = (√N/4) (α-1/α) (k2/1+k2) Equation 11
Systematic adjustment is conducted to optimize each condition until the critical resolution is Rs ≥ 2. Table 4 summarizes the typical chromatographic condition
adjustments and their effect in retention factor, selectivity and efficiency, which helps to focus experimental investigations during method development and optimization. The different effect on retention factor and selectivity between isocratic and gradient elution due column length and flow rate results from the change in %B unless gradient time is changed proportionally to maintain same conditions245.
Table 4. Effect of selected chromatographic separation conditions on retention (k/k*), selectivity (α) and plate number (N)245
Chromatographic Condition Effect
k α N
Column
Stationary phase Minor, major small
Column length Isocratic: no effect
Gradient: major
Isocratic: no effect Gradient: major
major
Particle size no effect no effect major
Mobile Phase
%B major minor small
Organic solvent minor major small
pH for ionizable analytes major major minor
Buffer concentration for ionizable analytes minor minor small
Flow rate Isocratic: no effect
Gradient: major
Isocratic: no effect Gradient: major
minor
Temperature minor minor minor
2.3 Capillary Electrophoresis (CE)
CE is a separation technique based on differing analyte electrophoretic
mobilities (resulting from charge to mass ratio) as charged ions in a capillary under the influence of high electric field and background electrolyte (BGE). Compound migration is also controlled by the electroosmotic flow (EOF) induced in the electrolyte by the electric field, that carries analytes towards the detector258. The technique was developed by substantive innovation of Tiselius’s work in the 1980s and 90s 259.
CE is comparable to HPLC in versatility, capacity to separate analytes of varying physico-chemical properties and flexibility in instrument parameters and experimental conditions. Furthermore, the same detectors used in chromatography can be coupled to CE instrumentation. Several specific techniques exist based on separation
mechanism 246,260. It has significant advantages over the chromatographic techniques
including potentially faster separations, lower reagent and consumable consumption, smaller sample demand (typically nL injected), less waste, use of a single capillary to separate different samples, better separation of enantiomers and simpler equipment. Additionally, detection at low wavelength (190-200 nm) is possible with the short capillary path length, allowing direct detection of acidic analytes without the
derivatisation required in gas chromatography. Therefore, it has good potential in small organic and inorganic compound analysis246,258,261,262. The significant shortcomings in comparison to chromatographic techniques are poorer precision as result of migration time variance and method sensitivity (detection and quantification limits) resulting from small injection volumes and short capillary path length (defined by µm internal
diameter). Precision is generally corrected using internal standards, while off-line (such as SPE) and online-preconcentration is applied to improve method sensitivity 246,247,263–
265.
Figure 12 shows a representation of a typical system. The sample is injected into the capillary, followed by the electrolyte (from its reservoir). Electrodes apply voltage to create the electric field, charging the analytes which migrate by their own mobility and are also carried by the EOF. In normal voltage polarity, EOF flow moves from injection at the anode (positive) to detection at the cathode (negative), in inverted flow, the charges of the electrodes are reversed. Analyte response is generated and displayed as an electropherogram. Hydrodynamic (with pressure) or electrokinetic (with voltage) injection can be performed. The former is preferred to reduce the bias problem that plagues electrokinetic injection, which works based on analyte electrophoretic mobility and EOF266. Figure 13 shows the important factors that affect CE separation.
Figure 12. Schematic representation of a CE system showing ion separation by mass and charge and
generated electropherogram321 R1, R2 – electrolyte containers e1, e2 – electrodes F- power supply D-detector V- radiation source C- computer
Capillary zone electrophoresis, also called free solution, is the simplest CE method. Analyte separation is determined by BGE composition (buffer
concentration/ionic strength, solvent, additives), pH and experiment conditions (temperature, voltage) that control EOF and analyte electrophoretic mobility. Voltage is applied with caution as high values can induce Joule effects (heating) through the capillary. This alters electrolyte viscosity and EOF, causing deterioration in separation and the sample, non-reproducibility, solvent boiling and cessation of analysis260,267. Mobility calculations from theoretical equations is difficult, therefore the values are derived from experiments to measure analyte migration time and EOF marker with267:
Electrolyte electroosmotic flow (veo), cm/s = Length to detector (Ldet) Equation 12
Time of EOF marker (teo)
Equation 13
Electrolyte electroosmotic mobility (µeo), 10-5cm2V-1 s-1 = veo x Total length (Ltot)
Applied voltage (V)
Analyte apparent velocity (vap), cm/s= Ldet Equation 14
Analyte migration time (tap)
Analyte effective velocity (vef), cm/s= vap - vap Equation 15
Analyte effective mobility (µef), 10-5cm2V-1 s-1 = vef x Total length (Ltot) Equation 16
Applied voltage (V) Capillary Electrophoresis Capillary Electrolyte Analyte Properties Coated/ uncoated Dimensions Length Internal diameter Buffer type and concentration Organic solvent and percentage
pH
Percentage of organic solvent Voltage applied
EOF
Surfactant type and concentration
Physico-chemical properties Molecular structure
Charge Electrophoretic mobility
A response function can be calculated from the effective mobilities to identify the best pH for separation. The effective mobilities of each compound are organized in increasing value at a specific pH (0 to 12). The product of the difference between adjacent effective mobilities and the difference between maximum and minimum effective mobilities were calculated. The response function was determined at each pH by dividing the product by the difference. The maximum response function
corresponds to the best pH for separation. The effective mobility curves for each compound and response function was plotted as a function of pH as shown in Figure 30. The maximum value for response function occurs at pH 5.
CE migration time is equivalent to HPLC retention time and also used for compound identification. EOFtime (teo) is the migration time of a neutral solute or the
solvent marker (first significant baseline disturbance). Resolution, tailing factor and efficiency is also used to evaluate quality of CE separation268,269.
1. Capillary
Narrow bore fused silica (silicon dioxide) capillaries are commonly used, with internal diameters of 25 –200 µm and length of 50 –100 cm for the benefits of precision, low electrical conductivity, high thermal conductivity, mechanical resistance and optical transmission over a wide UV range. Capillaries are conditioned when first prepared and before analysis with sodium hydroxide, followed by milli-q water and finally the electrolyte, to ensure the surface is uniformly and fully charged and to remove any residue from previous experiments respectively. Electroosmosis occurs due to analyte interactions with the weakly acidic silanol groups on the capillary wall surface, with some groups dissociating in the aqueous electrolyte to give negative charge to the capillary wall. The inner capillary wall can be chemically modified to change analyte interactions. Joule effects are controlled by the large ratio between the internal surface area and volume and high electrical resistance of the silica material260,267.
2.
Background ElectrolyteThe BGE is necessary to transport and separate samples in the electric field270.
Buffer concentration controls EOF flow by changing analyte adsorption to the capillary wall. Buffer type affects band tailing and symmetry by closeness of electrolyte mobility to anion mobility. pH controls analyte ionization and resulting electrophoretic mobility as a product of the distribution and relative concentrations of