Adaptation of constant effort sampling and of remova! trapping for the
estimation of populations of microscopic organisms in dense substrates
(*)
Abstraet
Lárge numbers of thecamoebae are found in the sand and detritus substrate of small streams in the Amazonian terra firme forest. Their rei ative populatlon densities can be determined by searchlng and countlng thecae under a dissecting microscope for a standard time lnterval (constant effort sampling) . The total population per sample can be calculated from a gradual linear depletion during successive such counts In a given sample (remova! trapping). From a series of such regressions the total number of thecamoebae of any sample can be estlmsted from a single, first count. The method depends on specific conditlons with regard to size of area searched, quantity of substrate per area, density of organisms per substrate and performance of the observers . These conditions are generally valld for similar msthodical treatment of any population of sma!l organisms In any type of dense substrate. The linear regresslon of the depletlon effect implies a constant mean probability for any thecamoeba to be found in the speclfied substrate during the specified ti me interval by any of the three observers involved In the study, and this despite the uncontro!lable sub-jectivity of visual search in a mlcroscopic fíeld .
INT RODUCTION
The necessity to define a sampling method arose from the ai m to characterize populations of thecamoebae, the prevalent protozoan group in the sand and detritus substrate of small Amazonian forest streams. They occur in such quantities that they may actually constitute an important link in the food chains which start with decomposition of submerged leaf litter, and furthermore, they may be suitable indicator organisms for natural water qualit ies and for pollution. Accurate sampling is impossible because of t he inhomogeneity of the substrate. and finding ali organisms in a representative
llse Walker ( .. )
Maryolanda Trindade Lages (* *)
sample of soil, sand, detritus and plant debris is i mpossible as well. As the problems encountered are similar for limnologists, soil biologists, pathologists, and for researchers w hich work with pests of human food stores and animal feeds. our results with thecamoebae might be of a more general interest.
lnhomogeneity of the biotope to be sampled is a problem which faces almost ali ecologists. How ever, working with macroscopic areas and organisms allows for reasonably objective standarization of the constant sampling effort: a constant number of sweeps with sweep nets may be taken to sample grassland insects (Waloff & Solomon, 1973); better sti ll, sampling for fixed periods in a fixed number of spots by mechanical devices (electrit.: aspirators in short vegetation, light and suction traps for flying insects etc; Southwood, 1968) can- if ali precautions are taken-exclude almost ali subjective components . By contrast, i f it comes to visual search under the microscope. almost al i is uncontrollably subjetive, and the issue would be suitable for a study in "Wahrnehmungspsychology". How long is one giving attention to a given observable spot? How large is this spot and to where is one shift ing attention the next instant? When is one deciding to stir up the substrate and when to rotate the petri dish? No matter how the sample is chosen, one is faced with the same questions . Simple counting on a regular grid, as is the case in transparent substrates, is not possible .
l nstead of focusing attention on the micro-behaviour of the observer, one may let severa! observers search for a given period without
( •) - Thls study was supported by a joint project between CNPq, OEA and SUFRAMA: "Ecologia da Floresta Tropical".
giving special instructions with regard to their searching method and see whether resu lts are reproducible within statistically accept ~ .~le
limits. Furthermore, one can test the sensitivi-ty of the search towards the crucial physical parameters of the sample such as amount of solid substrate per petri dish, density of substrate per area and size of area to be searched . What we are really interested in is the density of organisms per substrate. The re-sult of a search for 10 min, for example. should reflect this density and therefore, should be relatively independent of area and amount of material searched. In other words, the method to estimate re!ative densities of orgar.isms should be robust with regard to these para-meters; provided only that there is excess substrate, one should come up with repro-ducible results.
By contrast, estimation of absolute popu-lation numbers by remova! trapping depends on a gradual depletion of the organisms in the sampled area, hence, density of material per area and size of area must be chosen small enough in arder to be sensitive towards a reduction of the density of organisms per substr.ate.
lnitial sampling series of the thecamoebae from severa! localities within the INPA forest reserves produced some rather comforting results. In the following, the methodology is analysed according to the points of view outlined above. The ecological results and list of morphotypes will be published in a later communication. General problems of constant effort sampling and of remova! trapping are reviewed by Southwood (1968) and will, where necessary, be mentioned with the results or in the discussion.
MATERIAL AND SAMPLING METHOD
Some 25 - 35 distinguishable morphotypes of thecamoebae, with their longest diameters ranging from 25,um to ..., SOO.,um are found in the bottom substrate of single small forest streams. The thecae are composed of sand grains and detritus particles which are glued together with the cell's own excretion. A wide
536
-range of species includes no foreign particles at ali, their thecae consist of excretion alone, the structure of which is recognizably species--specific. They live preferably in areas of low current where light detritus particles accumu-late over a sandy substrate . In arder to charac-terize density and composition of these popu-lations along an 80- 100m stretch of a st~eam,
12 samples were taken ata distance of 6- 12 m according to the presence of "amoebae qiotope". This was the first decision to be taken: whether to sample rigorously at a fixed distance, regardless of the character of the bottom substrate, or to choose special sites where amoebae were known to be found and where the substrate allowed for reasonably standardized sampling; one cannot compare a sample of leaf litter with a sample of fine detritus. Transferring the problem to the macroscopic scale it must be said in ali fairness that ecological entomogists, for ex-ample, also choose sample areas where the organisms they are interested in are Jikely to be found. We thus did not sample "the stream" but the sand-detritus biotope of the stream. In arder not to disturb the sample area, samples were taken in the up-stream direction.
Wide-mouthed sample bottles of 250 ml capacity with a bottom diameter of 6 em, were filled carefully with water at the sampl ing spot. then lowered horizontally onto the substrate. With the free hand material was scooped into the bottle in such a way that, after settling, the substrate layer in the bottle was 5.0 + 1.0 mm deep. With a bit of routine, the quantity to be taken can easily be standardized within these I imits. In the laboratory the samples were left to settle for a minimum of 4 hours. Then ali but 120 ± 2 ml of the water carefully decanted, the rest rigorously stirred and 35 + 1 ml of the agitated suspension was transferred, via a calibrated flask, into a petri dish of 8. 3 em diameter. This results in about 2. 3 ± O. 5 ml settled detritus spread out over the petri dish's surface of 54 cm2 • The petri dish was then placed under the dissecting microscope and the material allowed to settle for severa! minutes. (Fortunately, reproduction is practically absent in such freshly taken
samples. In aged, small ecosystems, one or the other species may suddenly break out in a boom, but this was only observed after severa! weeks of laboratory existence (Walker, 1978). As we are also interested in the biology of this hitherto undescribed fauna. we worked with unfixed material throughout). The ob-server was then allowed to search and remove thecamoebae with a fine pipette for 10 minutes without specified instructions on the details of this search. The removed thecae may or may not contain a live cell. This is a difficulty in the estimation of a population we could so far not resolve because at present we have no facility to inspect the material at the sample site, and we do not know what dies during a transport over 80 km on unpaved roads. However, in this study we are concerned only with methodological aspects of sampling and counting. The material is sorted and counted after the remova! during 10 minutes; in this paper only total numbers per 10 min search, irrespective of morphotypes, are considered. Five persons were involved in sampling and four in searching and counting, namely one experienced and t hree initially unexperienced observers. Zeiss and Wild M 7A stereo mi-croscopes were used at magnifications of 30x to 40x.
Modifications of this standard method for experimental reasons will be mentioned with the respective results.
A.NALYSIS OF METHOD
ESTIMATION OF RELATIVE POPULATION DENSITY
First Results
The first two series of 12 samples each compared a black water stream with a clear water stream. The results were sufficiently representative, so that we decided to continue with the formerly described standard sampling. Black water ~ubstrate contained 41.8 ± 14.3 amoebae per 10 min sample, clear water substrate only 17.5 + 4.0 (t-test, P<0.001).
Personal bias
The above samples were ali taken and counted by the experienced observer . .
lntro-ducing 3 assistants to the method necessitated a careful comparison of the performance before results of diverse persons could be included into the evaluation of data.
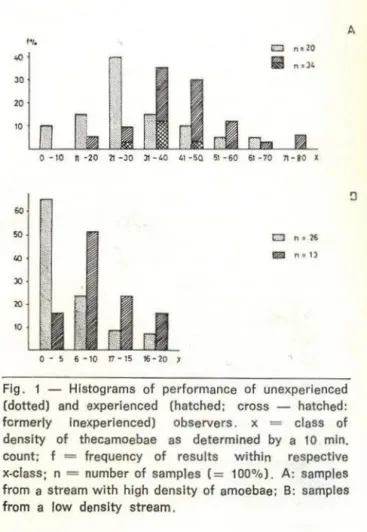
Fig. 1 shows that beginners find consider-ably less amoebae per sample, both in high density and low density series, but that eventually comparable results are obtained.
Ouantity of substrate searched
lnstead of 35 ml stirred suspension as in the standard method, 40 and 20 ml were given into the petri dishes. The detritus-sand mixture, when settled over night, is 2. 5 ml in the first case and 1.25 ml in the second . Naturally. half the substrate results in a thinner layer on the petridish. This could have either of two opposing effects: thecae might be more visible and the search facilitated, or local depletion would prolong the search per theca . Two consecutiva samples of 10 min were removed from each petridish in arder to discover a
..
,.
50
40
30
20
10
0 ·10 n·20 21-JO Jl-40 41·50 51 · 60 61-70 11 - 10 l
o- 5 6- 10 17-15 16-20 )
t::l n • 26 lliilll n • 13
A
possible depletion effect . Two experienced observers were involved in counting, both doing ali 4 types of sampling (20 ml, 40 ml, first and second counts). Table 1 shows that within the quantities of substrate searched the method is completely robust, i. e. the result is not influenced by the amount of substrate on the petridish .
TABLE 1 - Robustness of method with regard to quantity of material searched. n
=
number of replicates;X
1•X
2=
mean number of amoebae removed during two consecutiva counts of 10 mln in the same sample dlsh.40 'lllf olsh 31 . 75±5 . 26 31 .50±6.44 8 P ... O 80 p ... 0. 85
20 mlf dlsf\ 30. 33± 6 .25 30 .00± 4.10 6 P ... 0.90
-Area searched
Thirty-five ml of substrate suspension was given on ali petri dishes, but apart from con-trols in which searching was allowed over the whole (1 / 1) area, searching was restricted to sectors o f 1/ 2, 1
I
4 and 1/ 8. Each of these sectors was counted on a different dish. The material for a series of ali 4 areal sizes came from pooled samples, so that differences of results would reflect method rather than sample variation. Three experienccd observers were involved in the counting; two consecutive samples of 10 min. were removed from each sector . Table 2 confirms the robustness of the method with regard to first and second count in the whole dish, although this population is considerably less dense than the one in table 1; furthermore results are similar whether one searches over the whole, or over 1/2 petri dish only in a single first 10 min sample. However, significant depletion appears in the second count if only half of the area is searched . less amoebae are found in 1/ 4 and 1/ 8 dishes, and the depletion effects are accentuated; however, a significant reduction in first counts occurs only when the area is reduced to 1/8. Thus, our initially adopted, intuitive method is highly robust not only with
538-regard to the quantity of substrate, but also with regard to area searched. lt makes no difference, whether observers shift the dish somewhat more or less often , they would still come up with largely the same results. Differ-ences in results reflect above ali different densities of amoebae per substrate, and this is the population parameter one wants to characterize.
Searching time and removing time
lastly, a problem needs to be mentionend which, so far, did not present itself, but will have to be borne in mind whenever one is sampling by searching and remova! . For the constant sampling effort we f ix a standard sampling period b. T. Searching and removing organisms is a time-consuming process; an experienced and efficient observer will l nvest a minimum time interval b.t per organism to find and remove it. The maximum number of animais he can remove per sample is thus b.T
-
b.t, i. e . it is defined by the physical para-meters of the sampling method and not by the density of organisms present . Population
densities above this criticai methodological density cannot be distinguished anynore; in short: if the observer sees more organisms than he has time to remove the method delivers no meaningful results . Seeing one organism whilst one is engaged in removing another are two activities which can take place simultane-ouly, therefore , the minimal remova! time is the limiting factor which determines the criticai upper density for the method. The method depends on the difficulty to see organisms in dense substrate, i. e . on the time int erval between seeing sequentially appearing organ-isms. The observer "searches " i
f
the mean time interva/ between seeing two consecutive organisms is larger than the mean time interval needed to remove one. In actual fact, the method depends on the quantity of substrate per organism, if there is not enough substrate, it breaks down . Should this happen, one could remedy the case by adding neutrai, dense substrate to ali samples of an investigation(for instance pure sand in the case of theca-moebae). This method wou!d be equivalent to
dilution of transparent medium as serum or nutrient solution when counting blood cells or bacteria for example; counting, too, is a physical process which depends on the possi-bility to put a time interval between dis-tiguishing two objects on a field (this method breaks down when there are more organisms per area than one can discern) . There is one interesting point with regard to inexperienced beginners: if they were limited by difficulties in removing the organi sms, the histogram of
the results (Fig. 1) would be skewed towards maximum numbers counted per sample. This is, by the way, also true in the case of the experienced observer when he hits the criticai density; for the unexperienced person, the criticai density would merely be at lower values. lf the beginner were limited by finding
the organisms, then the histogram woul d accentuate the normal asymmetry of the Poisson distribution towards low numbers found per sample. This was, in fact, what happened in our case.
ESTIMATION OF ABSOLUTE POPULATION NUMBERS
Response of depletion to area searched
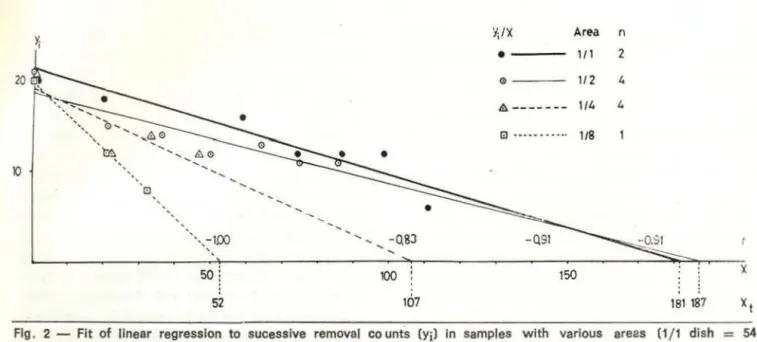
The course of depletion for various sizes of sizes of areas searched is shown in Fig. 2 (these are different samples from Table 2). The number of amoebae tound in each count is plotted against the tot al previously removed. Naturally, the method of plotting the data results in regression as the number found decreases during successive counts while the total removed increases . There is, however.
no compelling reason why this should be a straight line. The mathematical theory of this method was worked out by De Lury (1974) and
Zippin (1956) who departed from the
as-sumption of constant probability to find the organisms. Yet, in the microbiological method these probabilities are subjective and may vary in the course of successive counts (trying harder or t iring for instance) . Thus, we depart from the empirical data and use the caculation of regression - not to prove regression - but to fit the best straight fine and to estimate its "goodness" (correlation coefficients r in Tab!e
5 and Fig. 2; Menhinick 1963, Southwood 1968).
lt appears that the fit is relatively good, and shou!d further counts decrease along the fine, the intersect with the abcissa should give an estimate of the total amoebae present in the area. Table 3 and Fig. 2 give evidence that for the w hole area the method leads to massive underestimation. Assuming that severa I repli-cate counts in the smallest are a ( 1/ 8
=
6. 76cm2) give the most realistic results. the whole dish should contain roughly 8 times that number.
Yet, the 1/2 dish with similar density as the whole shows the same total estimate as the whole dish. The reason for this underesti-mate is probably that the observer does not explore the whole area and depletion may thus be local. An ana!ysis of dep!etion for 15
samples of whol e (1/1) dishes searched certainly suggests that decrease between counts is rather erratic (Tab. 4). what would be expected in the case of irregular search
over the surface of the petri dish. The rei ative
sma!l decreases between first and third counts reflect the robusteness of the method with
regard to areia and substrate .
TABLE 2 - Effect of t he si ze of area searched; the w hole l 1/ 1) dish is 54 cm2. yl' y2
=
mean number of amoeb::e of n r e pl~c a t es removed in 2 consecutive counts of 10 min.Sampllng t - test
1/1 (whole) dlsh 21.50 ± 5 . 45 19 . 75 ± 4 .57 4
o
92 p - 0 . 2510
' ... '
... <;, ...
.... , .... ,~0
- ~ --
' ,'m
Y;/X
•
G
1!:1---1:1 •••••••••••
Area n
1/1 2
1/2
"
111.
"
118
... ' ... - Q83
50
l
52
' '
100 :
1Ô7
150 )(
181187
Flg. 2 - Fit of linear regresslon to sucessiva remova! co unts (Yil in samples with various areas (1/1 dish = 54 i-1
cm2). x
=
r:
yi=
total amoebae previously removed; ~=
total number of amoebae as calculated by regresslon. 1=1Each point represents the mean In n samples of comrarabte initial densities Yl·
The relations between the counts in 1/ 2, 1/ 4 and 1/ 8 dish are more consistent with the simple expectation that doubling area and substrate results in double population size.
y
Y,
I
'
11--- Xi(total)
X
Xtotal
Flg . 3 - Ideal linear regression In remova! counting and constant probabllity (p) to find an organism in a set of samples. y1
=
first remova! cout in a sample ;Yi
=
i - th count in thls sample or the first count in a different sample with a Jower density of organ· lsms. x=
total organlsms removed by previous counts; x i!totol)=
total organisms per sample if y1 is thefirst count; X ;ctotol)
=
total organisms per sample lfY; ls the first count.
Y, Y;
p = - -
=
=
constantX total X l(totol)
540-From this follows, that for absolute, total population estimates smaller areas are recom-mended, in ou r case dishes of 1
o -
20 cm2 with O. 5 - 1. O ml settled ~ubstrat e, covered with sufficlent water to facllitate the search (p. 2); that is, we have to give up robustness of area and quantlty of substrate which are desirable for estimates of relative population density .TABlE 3 - Effect of area searched on the estimated total number amoebae per sample (~
0
tal) as calcu-lated by regressi on (see Fig. 2). y1=
density otamoebae per sample as determined by the first 10 mln count. Xex!)
=
total per sample expected if x101,.1 of the 1/ 8 area ls assumed to represent the most realistic number (*><total = Xexp) .y, ><total ><total
Are a Xexp
---(counted) (calculated) Xexp
1/1 17 164.27 292.48 0.56
20 181.17 418 .53 0 .43
1/ 2 21 187.60 209 . 26 0 .90
1/ 4 21 106.94 104 .63 1.02
1/8 20 52 .32 · 52.32 1.00
17
\
36.58 .36.53 1.00Estimation of total numbers from single, first counts
In our ecological study we want to compare density and diversity of thecamoebae from different streams and hence, we rely on t he robustness of the method. Sti ll , one would like to have an approximate idea on the arder of magnitude of absolute numbers. lt is reason-able to assume that in samples of comparreason-able size and type of substrate, successive depletion results in similar regression lines in samples w ith similar initial densities as reflected in the first cou nt. The total estimate would then be a fu nction of th is initial density and perhaps of a behavioural bias, as initial density may influence the performance of the observer. Without such bias we should get a straight line if we plot the estimated totais against the first counts. This follows by necessity from the
X tcorr = 2X t
1000
500
•
•
10
20
JO
40
fact that a straight line is a reasonable fit for the data of depletion in individual samples. On such a regression line any one of the various Yi could be the first count in a sample w ith a respectively lower density of organisms, and the section xi Ctot,al) of the absissa then
repre-sents the total population of the dish at the beginning of this first count yi (Fig . 3) . yi/xi
(t()l.al )
=
constant, this means that in any onecount of 10 minutes, whether it is the first count in a sample of any density, or the i -th count within a single sample we always remove the same proportion of the population present in the dish. Hence, if we plot our first counts of various samples against the calculated totais we should get a straight line, from which the expected total population can be read off, if we determined the first count only. Fig . 4, representing the data of Table 5, shows, that a straight line is indeed a reasonable fit
60
70•
xt
=
-115.41 • 13.17Y.1
r
= 0. 9780
90/
.
100 Y,
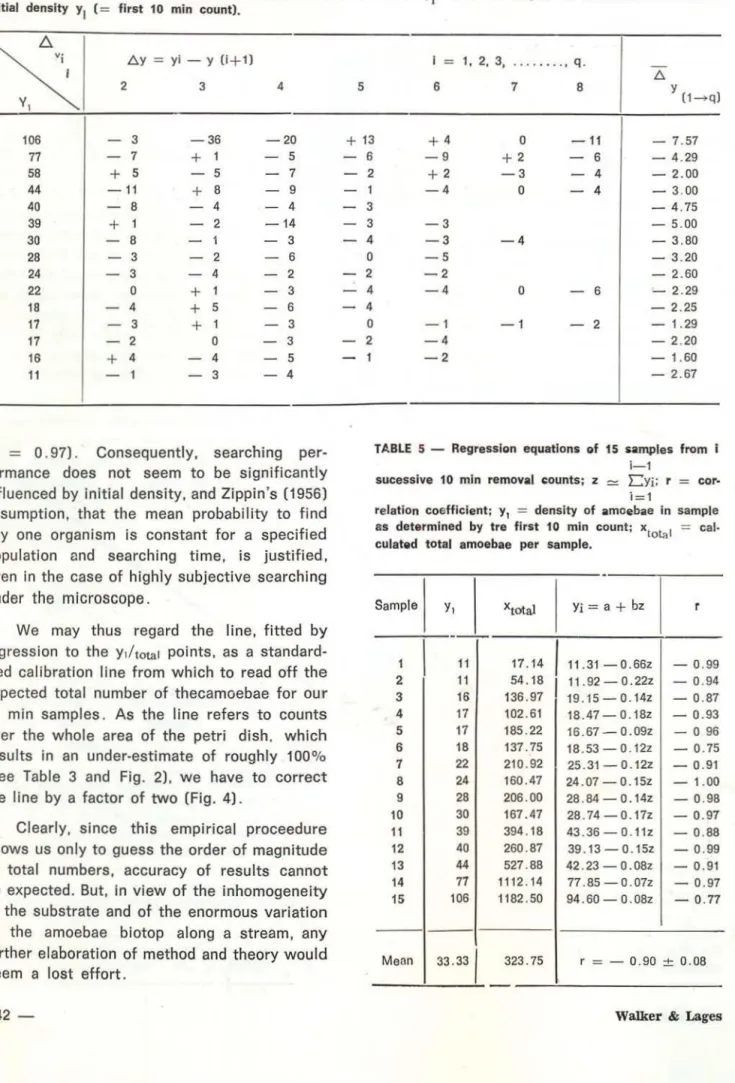
TABLE 4 - Pattern ot difterences between sequential remova! counts Yj within 15 samples as a function ot i and of initial denslty y
1 ( = first 10 min count).
~
D..y = yi- y (i+1l2 3 4
I
106 3 -36 -20
77 7 + 1 5
58 + 5 5 7
44 -11 + 8 9
40 8 4 4
39 + 1 2 -14
30 8 3
28 3 2 6
24 3 4 2
22 o + 1 3
18 4 + 5 6
17
-
3 + 1 317 2 o 3
16 + 4 4 5
11 1 3 4
(r
=
O. 97). Consequently, searching per-formance does not seem to be significantly influenced by initial density, and Zippin's (1956) assumption, that the mean probability to find any one organism is constant for a specified population <:lnd searching time, is justified, even in the case of highly subject ive searching under the microscope.We may thus regard the line, fitted by regression to the Y1ltotat points, as a
standard-ized calibration line from which to read off the expected total number of thecamoebae for our 10 min samples. As the line refers to counts over the whole area of the petri dish. which results in an under-estimate of roughly 100% (see Table 3 and Fig. 2), we have to correct the fine by a factor of two (Fig. 4).
Clearly, since this empirical proceedure allows us only to guess the arder of magnitude of total numbers, accuracy of results cannot be expected. But, in view of the inhomogeneity of the substrate and of the enormous variation of the amoebae biotop along a stream, any further elaboration of method and t heory would seem a lost effort.
542-I = 1, 2, 3, . .. . .... • q .
D.
5 6 7 8 y
(1-+ q)
+ 13 + 4 o -11 - 7 . 57
6 2 1 3 3 4 o 2 4 4 o 2
- 9 +2 6 - 4 . 29
+2 - 3 4 - 2.00
- 4 o 4 - 3 . 00
- 4 . 75
- 3 - 5 . 00
- 3 - 4 - 3.80
- 5 - 3 . 20
- 2 - 2.60
- 4 o 6 - 2 . 29
- 2 . 25
- 1 - 1 2 - 1.29
- 4 - 2 . 20
- 2 - 1 . 60
- 2 . 67
TABLE 5 - Regression equations of 15 samples t rom I
i-1
sucessiva 10 min remova( eount s; z
=
LYi; r=
cor-i=1
relation coefficient; y1
=
density ot amoebae in sample as determined by t re f irst 10 min count; xtota l=
cal· culated total amoebae per sample.Sample yl X total Yi = a+ bz
1 11 17.14 11 . 31 -O. 66z - 0 . 99
2 11 54.18 11 .92- 0.22z - 0 . 94 3 16 136 . 97 19 . 15- 0 . 14z - 0 .87 4 17 102 . 61 18.47- 0.18z - 0.93 5 17 185 . 22 16. 67- 0.09z - o 96 6 18 137 . 75 18 .53- 0 . 12z - 0 . 75 7 22 21 0.92 25 .31- 0 . 12z - 0 .91 8 24 160 . 47 24 . 07 - 0 . 15z - 1 . 00 9 28 206 . 00 28 .84- 0.14z - 0 . 98 10 30 167 . 47 28 .74- 0 . 17z - 0 . 97 11 39 394 . 18 43 .36- 0 . 11z - 0 .88 12 40 260.87 39.13- 0.15z - 0.99 13 44 527 .88 42.23 - o.o8z - 0.91 14 77 1112 . 14 77.85 - 0.07z - 0.97 15 106 1182 . 50 94. 60 - o . 08z - 0 . 77
- - -
-Mean 33 . 331 323.75 r = - O. 90 ± O. 08
Referring to the mean number of amoebae found in two different streams ( 18 and 42, see p ... ). we would expect 230 and 930 per dish respectively; this gives a range of 82 - 404 thecamoebae/ml settled detritus (p. . . ) . Even assuming that only a fraction of these is alive at any one time. it means that stream detritus in Amazonian terra firme forest
is intensively exploited by thecamoebae.
CONCLUSIONS
Ali data support the conclusion that popu-lations of small organisms in dense substrates can be assessed with confidence by the methods of constant effort sampling and- re-mova/ trapping which avoid the tedium of having to find ali organisms in a sample. This is true provided certain precautions are taken . First. the histogram of frequencies of the densities of organisms in a series of samples (called simply "performance" in the following) must show a Poisson distribution; asymmetry towards relatively too many samples with highest densities indicates that the densities are too high to be assessed by the method . and the case must be remedied by diluting the samples with suitable substrate (finest saw dust and desert sand in our case for example). Second, observers must be trained until their performance is constant within statistically tolerable limits. This situation is different from the one with a beginner counting erythrocytes in clear serum for example. A careful beginner delivers the same results as the experienced observer, he merely needs more time to count ali cells in a given number of fields. In the constant effort sampling method the obser-vation time is limited and the unexperienced observer produces different results . Third, if severa! investigators contribute to a joint study, they can be trusted to sample different areas only if their performan'ce is similar, otherwise they must contribute constant fractions of data to each series (for instance each of two observers counts half of the samples of each areal.
Given the enormous possibility for person-al bias in microbehaviour when searching through a microscope, constant probability to
find an organism as implied by straight line regression is surprislng . Three experienced observers produced the data in Table 5 and Fig. 4. This may mean that visual search of known objects in known substrates relies on elementary physico-physiological processes which vary little between individuais. This is a comforting thought, particularly for ecologists. No conceivable machine could pick out dozens of different types of thecae com-posed of sand and detritus from an environ-ment of sand and detritus. but man can. lt may be good to be reminded at times that precise machines are the product of man and not vice-versa. and that trustworthyness of data relies on the criticai mind of the observer, whether he uses h is own sense organs or mechanical substitutas.
ACKNOWLEDGEMENTS
The authors are thanking Dr. R.M. Williams and Sr. Miguel Petrere Júnior for their as-sistance in clarifying theoretical aspects of the depletion process which, however, are not shown in extenso in this paper, but led to the final version of the script (straight line regression and constant probability: Dr. R. M. Williams; other possible depletion curves : Sr. M. Petrere Jr. ); they acknowledge furthermore the assistance of Sr. Luiz Fernandez Alvez and Sr. Joaquim Rodrigues de Melo in counting thecamoebae and are grateful to Dr. M. Goul-ding for critically reaGoul-ding the final script
RESUMO
den-sidade. Se não há procura, o que quer dizer, se são vistos mais organismos de que há tempo de tirar da piaca em 10 min., o método somente pode ser aplica-de se todas as amostras são di luídas com substrato semelhante sem organismos. O método pode ser apli-cado em geral para amostragens de micro-organismos em qualquer substrato denso desde que a quantidade de material por área e a área pesquisada (tamanho da placa ou área da placa) sejam adequados, e que o ob-servador familiarize-se com o material e o método até serem obtidos resultados reproduzíveis.
O método para determinar densidades relativas
é robusto: obtém-se os mesmos resultados com 20 e 40 ml de suspensão de material por placa, mesmo se a procura estende-se sobre a área total ou apenas sobre a metade de placa. Assim, dentre limites metodológi-cos bastante amplos, os resultados refletem a densida-de densida-de amebas por substrato; portanto, a amostragem no igarapé não precisa ser feito com precisão volumétri-ca, o que seria impossível em visto do matenal ser heterogêneo (areia e detritos).
A determinação da densidade absoluta depende da diminuição do número de amebas durante sucessivas contagens de 1 O min. na mesma amostra. O número de amebas tiradas por 1 O min . em relação ao número total já retirados segue uma regressão linear. Isto significa que, apesar da subjetividade individual da pro-cura sob um microscópio, a probabilidade média de en-contrar uma ameba em qualquer amostra por 3 obser-vadores já bem treinados é constante. Dest a regressão calcula-se o número total de amebas por placa. Uma série de tais regressões de amostras com diversas den-sidades, conduz, com precisão matemática (e em rea-lidade), a uma regressão linear entre as primeiras con-tagens e os totais por placa. Portanto, esta linha per-mite estimar o número total de organismos por amos-tra (= por placa) desde que seja conhecido o número de uma única contagem de 10 min. Resultados realísti-cos obtém-se somente se a robustez a respeito da quan-tidade e da área pesquisada é sacrificada: é preciso amostras suficientemente pequenas para serem imedia-tamente sensíveis à dimi nulção de organismos duran-te o processo.
544-A densidade média, absoluta, encontrada em vanos igarapés, varia ent re 82 e 402 tecamebas por 1 ml de substrato sedimentado em uma suspensão aquática. Mesmo que seja uma fração somer.te v iva por tempo (e sempre encontram-se amebas vivas), estes números indicam que as tecamebas são um fator importante na rede al imentar e de decomposição nos igarapés da flo-resta amazônica.
LITERATURE
DELURY, D.B.
1947 - On the estimation of biological populations. Biometrics, 3: 145-167.
MENHINICK, E.F.
1963 - Estímation of insect population density in herbaceous vegetation with emphasis on remova) sweeping. Ecology, 44: 617-621.
SOUTHWOOD, T.R.E.
1968 - Ecological methods. Methuen & Co Ltd. London, 391 pp.
WALKER, I.
1978 - Rede de alimentação de invertebrados das águas pretas do sistema rio Negro. 1 .
Ob-servações sobre a predação de uma ame-ba do tipo Amoeame-ba di5coides. Acta
Ama-zonica, 8 : 423-438.
WALOFF, N. & SoLOMON, M.G.
1973 - Leafhoppers (Auchenorrhyncha: ra) of acid grass land. J . appl. 189-212.
ZIPPTN, C.
Homopte-Ecol., 10 :
1956 - An evaluation of the remova( method of estimating animal populations. Biometrics, 12: 163-189.
(Aceito para publ icação em 22/ 11 /79)