Genotype x environment interaction of melon families based on fruit
quality traits
Fernando Antonio Souza de Aragão1*, Glauber Henrique de Sousa Nunes2 and Manoel Abilio de Queiróz3
Received 24 April 2014
Accepted 31 October 2014
Abstract – Significant genotype vs. environment interaction (G x E) is expected as a result of geographical diversity and differences in management techniques in melon growing. Ninety-six F3 families from the cross between inodorus and conomon melons were evaluated in three environments for studying interaction. The G x E interaction, genetic parameters, and direct and indirect gains were estimated. Average weight of the fruit, pulp thickness, cavity thickness, pulp firmness, and soluble solids were evaluated. The simple part of the G x E interaction was always greater than 99%, except for pulp firmness, where there was predominance of the complex part. The coefficient of genetic variation and genetic variance were overestimated by the G x E interaction. The direct gains from selection were higher than the indirect, except when selection was made by the mean of the three environments. Genotype assessments in more than one location are necessary, but selection should be made by the mean values of families in the environments.
Key words: Cucumis melo, genetic parameters, gains from selection. Crop Breeding and Applied Biotechnology 15: 79-86, 2015 Brazilian Society of Plant Breeding. Printed in Brazil
ARTICLE
http://dx.doi.org/10.1590/1984-70332015v15n2a15
1 Embrapa Agroindústria Tropical, Laboratório de Melhoramento e Recursos Genéticos Vegetais, 60.511-110, Fortaleza, CE, Brazil. *E-mail: [email protected] 2 UFERSA, Departamento de Ciências Vegetais, 59.603-180, Mossoró, RN, Brazil
3 UNEB, Departamento de Tecnologia e Ciências Sociais, 48.905-680, Juazeiro, BA, Brazil
INTRODUCTION
Melon is an important crop in the Brazilian semi-arid region, especially for the states of Rio Grande do Norte and Ceará, with more than 90% of Brazilian production (IBGE 2014) and almost all Brazilian exports (MDIC 2014). In 2012, Brazil was the ninth largest producer worldwide, with 575.4 thousand tons of melon in a harvested area of 22.8 thousand hectares, and third place in value of exports at more than US$ 134 million (FAO 2014). Most of this production is from hybrids of the inodorus group, consider-ing melons of the Canary melon, Santa Claus melon, and Orange Flesh melon. The Canary melon represents more than half of Brazilian exports because of lower production cost, ease of growing, high yield, and long post-harvest keeping qualities (Nunes et al. 2004).
Due to the extension and geographical variations of the melon growing areas in Brazil, the edaphic and climatic diversity, and the variations in management techniques,
significant genotype x environment (G x E) interaction is
expected. Studies on melon have shown the presence of the G x E interaction in experiments for cultivar evaluation (Nunes et al. 2011, Silva et al. 2011).
Phenotypic variations result from the combined action of the genotype, the environment, and their interaction;
consequently, they are reflected in differences in the sensitiv -ity of the genotypes to environmental variations, affecting their behavior and performance (Allard 1999). The G x E
interaction may be defined as the differential response of
the genotypes for a given trait in different environments (Campbell and Jones 2005).
It is known that the G x E interaction may be of a simple or complex nature (Cruz and Castoldi 1991) and that its magnitude may reduce the correlation between the phenotype and the genotype, affecting genetic variance; consequently, parameters such as heritability and genetic gain from se-lection are also affected. For that reason, Vencovsky and
Barriga (1992) affirm that it is not enough to simply detect
the presence of the G x E interaction; its nature should also be considered.
Simple interaction does not cause changes in the
clas-sification of the genotypes among environments, indicating
the presence of genotypes with adaptation to the broad range of environments, which allows recommendation of cultivars in a generalized manner (Romagosa and Fox
1993). However, complex interaction alters the classifica -tion of the genotypes among environments, indicating the presence of genotypes adapted to particular environments,
restricting the recommendation to specific environments
(Vencovsky et al. 2012).
Differential response of the genotypes in distinct en-vironments impedes selection of high-yielding and stable cultivars (Cooper and De Lacy 1994), restricting the
rec-ommendation to specific regions, where they express their
greater genetic potential (Kang and Magari 1996). For that reason, the breeder must carry out experimentation in the greatest number of locations possible and characterize the G x E interaction (Farias et al. 1996). Therefore, selection procedures based on the mean yield of the genotypes in a
given environment are not very efficient (Hopkins et al. 1995).
The G x E interaction may be minimized by the use of
specific cultivars for each environment, or cultivars with
broad adaptability and good stability. Otherwise, the G x
E interaction may be minimized by stratification of the
production region into areas with similar environmental characteristics such that the interaction comes to be
non-significant (Cruz and Carneiro 2006). The second alterna -tive has been most used for diverse crops (Ramalho et al. 1993). Nevertheless, there are few registers of the effect of interaction on the estimates of variance components obtained in evaluations of segregating populations of melon (Silva et al. 2011). Thus, this information is necessary to guide breeders of the crop and allow estimates of more reliable genetic parameters.
In light of these considerations, with the hypothesis that the magnitude of the genotype x environment interaction has
a significant effect on phenotype manifestation, hampering
the work of the breeder in the selection process, the goals of this study were: a) to measure the family x environ-ment interaction and decompose the parts that make it up; b) investigate the effect of the interaction on the genetic parameters, and c) compare the direct and indirect gains.
MATERIAL AND METHODS
As of characterization of the melon accessions from the Active Germplasm Bank of Cucurbitaceae for the Brazilian Northeast region from Embrapa Semiárido, and from elite lines of the genetic breeding program of Embrapa, the two most highly contrasting genotypes for fruit quality traits
were chosen. The parental lines chosen were the accession UFERSA-1, a line obtained by three self-pollination cycles of an accession of the conomon group; and the line CNPH-5, an elite line of the melon genetic breeding program of Embrapa.
Manual pollinations were carried out in all the crosses following the two-way cross arrangement. The P1, P2, and F1 generations were formed of only one individual. The F2 generation consisted of 100 individuals, from which were structured the F3 families.
The experiments were conducted on three commercial
properties of the Jaguaribe-Assu area. The first was carried
out on the Velame II Farm - WG Fruticultura (E1), with
caatinga (xeric shrubland) vegetation and clayey soil, located in the municipality of Baraúna, RN, Brazil, in the Chapada do Apodi (highland plateau). The second was on the Água Farm (E2), which has caatinga vegetation and very heavy clayey soil and is also located in the Chapada do Apodi, but in the municipality of Quixeré, CE. And the third was conducted on the Agrícola Famosa Farm (E3), which has restinga (tropical moist broadleaf forest) vegeta-tion and sandy soil and is located very near the coast, in the municipality of Icapuí, CE.
The crop treatments were those normally used in each property since the experiments were set up in melon com-mercial production areas, in the center part of production lots. In the E1 and E3 environments, the experiments were set up by transplanting seedlings and, in the E2 environment, by direct sowing. The seedlings were produced in 200-cell
plastic trays with a dry coconut fiber substrate.
The experiments were carried out in a completely ran-domized design with 96 F3 families, with three replications in the E1 environment and two replications in the E2 and E3 environments, due to germination of the genotypes. The experimental unit was composed of one six-meter row and a total of 15 plants per plot. Plant spacing was 2.0 m between rows and 0.4 m between plants.
The traits evaluated were FW – fruit weight (kg); PT – pulp thickness (mm), measured with a caliper rule; CT – cavity thickness (mm), measured with a caliper rule;
FP – firmness of the fruit pulp (N), measured with a pen -etrometer; and SS – soluble solids (°Brix), measured with a digital refractometer. For all the characteristics, the mean
value of five fruits harvested at random from different plants
was considered.
To estimate the variance components and the genetic and phenotypic parameters, a mixed model was considered,
family and the family x environment interaction. The vari-ance components were estimated by the REML (Restricted Maximum Likelihood) method through the PROC MIXED procedure of the SAS program. Estimates of the variance components were obtained in accordance with Vencovsky and Barriga (1992).
For estimation of the simple and complex parts of the G x E interaction, analyses of variances were carried out in pairs of locations, according to the methodology of Cruz and Castoldi (1991) as follows:
2 3
' ' '
[( ) / 2 . ] [ (1 ) ]
FA j j j j j j
QM = QM − QM +k QM QM + −r QM QM
simple complex
, in which:
QMFA: Mean square of the family x environment in-teraction;
QMj and QMj' : Mean squares of the effect of families on the environments j and j’;
r : Genetic correlation coefficient between the families
in the j and j’ environments;
k : is a constant, obtained by the following expression: 3
1 (1 )
k= − −r −r .
Estimates of the progress expected from selection were obtained from the expressions proposed by Cruz and Car-neiro (2006) as follows:
i) Direct progress – selection by performance in environ-ment (j) and progress in environenviron-ment j.
GS(J / J ) = DSJ. h 2
j , in which:
DSJ: selection differential based on individuals of best performance in environment j;
h2
j: heritability of the trait in environment j.
ii) Indirect progress – selection in environment (j) and progress in another environment (j´).
GS(J / J ') = DS(J / J '). h
2
j, in which:
DS(J / J '): differential of selection in environment j, in which the individuals selected exhibited the best perfor-mances in environment j´;
h2
j: heritability of the trait in environment j.
iii) Selection based on individual environments (j) and progress in the mean of the environments (m)
GS(J / m) = DS(J/m). h
2
j , in which:
DS(J / m): differential of selection in environment j, in which
the individuals selected exhibited the best performances in the mean of the environments;
h2
j: heritability of the trait in environment j.
iv) Selection based on the mean of the environments (m) and progress in individual environments (j)
GS(J / m) = DS(J / m). h
2, in which:
DS(J / m): differential of selection in environment j, in which the individuals selected exhibited the best performances in the mean of the environments;
h2: heritability of the trait in environment m.
v) Selection based on the mean of the environments (m) and progress in the mean of the environments
GSm = DSm. h2
m , in which:
DSm: differential of selection of individuals of best performance in the mean of the environments;
h2
m: heritability of the trait in the mean of the
environ-ments (combined analysis).
RESULTS AND DISCUSSION
Estimates of variance components and genetic parameters
The estimates of the environmental coefficients of varia -tion (CVe’s) obtained in the present study (Table 1), may be
considered high according to the classification established
for melon by Lima et al. (2004). In genetic breeding experi-ments, precision is indispensable so that differences between genotypes may be detected, and the CVe is the measure most used when comparing experimental precision. These high estimates may be associated with the fact of the experiment not having been carried out in an experimental area.
In regard to the variability of the families, there was hetero-geneity for all the traits in the individual and combined analyses since all the estimates of genetic variance (σ2
g) were significant
(χ2 < 0.05) (Table 1). The estimates of the genetic coefficient of variation (CVg) and of the heritabilities in the broad sense corroborate the results obtained for genetic variance among
families, confirming the existence of genetic variability
in the population. However, in almost all the situations, these estimates of CVg and heritability, in individual and combined analyses, indicate that the magnitude was not so high. The CVg indicates the release of genetic variability, and the greater its estimate, the greater the genetic variability among the genotypes.
fruit weight, especially in the E1 environment. This situa-tion is unfavorable for promoting selecsitua-tion (Vencosky and Barriga 1992). Similar results were observed by Silva et al. (2011) upon evaluating families of Gália melon in four municipalities of the Mossoró-Assu area.
The heritability estimates obtained may be considered medium for the traits evaluated; however, they also
cor-roborate the results of the genetic coefficients of variation
(Table 1). The greater the heritability, the more assurance the breeder has in selecting truly superior genotypes (Falconer and Mackay 1996).
Reports of heritability estimates in the melon crop are
few in the scientific literature. Silva et al. (2002), evaluating
two populations of half-sib families in the municipalities of Mossoró and Baraúna, observed values similar to those seen in this study. However, Silva et al. (2011) observed lower values than those shown in this study. Nevertheless, it should be emphasized that caution must be taken in comparison of heritability estimates in different studies because in the context of quantitative genetics, heritability is affected by the environment, by the population, and by the genetic structure of the population (Lynch and Walsh 1998).
The genetic variability observed among the families was expected by the fact of their being derived from the cross of two different botanical varieties of melon (inodorus
and conomon). On the other hand, within a more statistical context, it is noteworthy that the high number of families
evaluated allows significance to be detected in the fam -ily source of variation with greater ease, a fact shown by
significant estimates of genetic variance among families.
For mean fruit weight, there were no differences among the estimates of genetic variation in the three locations, but they differed from that obtained in combined analysis. Furthermore, for this trait, greater CVg was observed in environment E1, indicating greater release of variability in this location. However, this divergent value in relation to the estimates obtained in the other locations and in combined analysis is due to the lower mean value of fruit weight in E1 since the CVg, just as the CVe, is affected by the overall mean of the test. Greater heritability was obtained in environment E2 because of lower variance of error, in relation to the estimates of environments E1 and E3 and of combined analysis.
In relation to pulp thickness, the greatest estimates of genetic variance and of CVg were obtained in E1. Neverthe-less, except for combined analysis, the lowest heritability was seen in this location. A possible explanation is in the greater estimate of environmental variance in E1, which increases phenotypic variance and, consequently, reduces heritability.
Table 1. Estimates of the genetic and environmental parameters of the F3 families of melon
Trait Location Mean σˆ 2
g
CVe
(%) CV(%)g σˆ 2g σˆ
2
fe hˆ 2
Fruit weight
E1 0.762 0.107 42.93 118.64 0.133* - 55.34
E2 1.078 0.053 21.36 83.74 0.129* - 70.80
E3 0.970 0.108 33.88 93.34 0.137* - 55.91
Combined 0.913 0.093 33.40 98.47 0.119* 0.01 53.26
Pulp thickness
E1 2.12 0.156 18.63 43.46 0.194* - 55.46
E2 2.74 0.058 8.79 32.94 0.129* - 68.91
E3 2.41 0.111 13.82 38.13 0.184* - 62.46
Combined 2.38 0.118 14.43 38.07 0.139* 0.03 49.03
Cavity thickness
E1 4.40 0.532 16.58 22.07 0.555* - 51.08
E2 5.34 0.331 10.77 17.81 0.467* - 52.58
E3 4.57 0.536 16.01 21.28 0.571* - 51.60
Combined 4.72 0.485 14.75 20.37 0.455* 0.02 47.24
Pulp firmness
E1 25.03 39.262 25.03 4.79 37.813* - 49.06
E2 20.27 27.516 25.88 5.82 27.589* - 50.07
E3 28.73 53.169 25.38 4.26 57.075* - 51.77
Combined 24.67 40.811 25.90 4.79 26.367* 10.14* 35.77
Soluble Solids
E1 4.21 0.506 16.90 22.97 0.595* - 50.36
E2 5.06 0.953 19.29 19.62 0.867* - 47.65
E3 5.97 0.894 15.84 16.69 0.928* - 50.94
Combined 4.96 0.732 17.25 19.64 0.513* 0.16 39.91
*/significant at 5% probability by the Chi-square test. CVe (%): environmental coefficient of variation, CVg (%) : genetic coefficient of variation, σˆ
2
g: environmental variance,
σˆ 2
g: genetic variance; σˆ
2
The heritabilities for cavity thickness were similar in the three locations, even with the lower estimates of the CVg and of genetic variance in environment E2. In relation
to pulp firmness, although the genetic variances differed
in magnitude, estimates of heritability and CVg that were very similar in the three environments were observed, which was also seen for soluble solids. In addition, in all the traits, it may be observed that heritability in combined analysis was always less than the heritabilities estimated in each environment.
In relation to the fixed effect of environments, homoge -neity was seen, especially for the mean values of the traits of pulp thickness, cavity thickness, and soluble solids. For fruit weight, the estimate in environment E1 was less than that of environments E2 and E3. For pulp firmness, there was greater heterogeneity among the environments.
The ratio between the component of genetic variance among the families (σ2
g) and the interaction variance (σ
2
fe)
was greater than one, for pulp firmness. The greater the value
of this ratio, the less the contribution of the component of the G x E interaction will be for phenotypic manifestation (Cruz and Castoldi 1991). Thus, although not prevalent in relation to σ2
g, the component of σ
2
fe was significant for pulp
firmness, in contrast with the other traits (Table 1).
Family x environment interaction
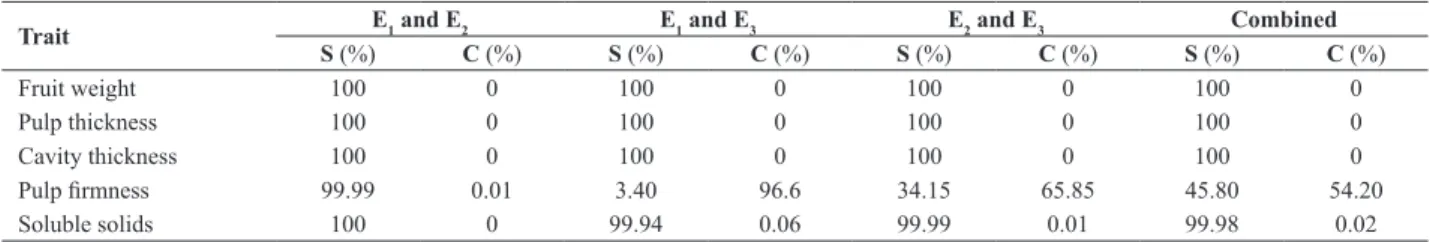
The G x E interaction was decomposed into simple and complex parts in evaluations of the environments, two by two (Table 2). For all the traits, in all the pairs of environ-ments, the simple part was greater than 99%, except for
pulp firmness, with broad predominance of the complex
part among the E1 and E3 environments. As a result, the G
x E interaction was significant only for this trait because the estimate of the component of variance was significant.
Although at a lower scale, there was also predominance of the complex part in the E2 and E3 pair and in combined analysis. The great superiority of the complex part indicates
the presence of families with specific adaptation to an evalu
-ation environment for pulp firmness.
When there is predominance of the simple part, the
breeder’s work is easier because the genotypic classification
does not change. In contrast, when the complex part is more
expressive, decision-making becomes more difficult since there are genotypes more adapted to specific environments
(Cruz and Carneiro 2006). The G x E interaction may be utilized by the breeder through the selection of determined genotypes for a determined environment or region. In this case, the interaction is capitalized, increasing the phenotypic value of the trait. Silva et al. (2011) observed predominance of the complex part of the families of Gália melon x environment interaction, but Nunes et al. (2011) observed prevalence of the simple component of the interaction when they evalu-ated Gália melon hybrids in 12 environment of Rio Grande do Norte. In addition, Nunes et al. (2006) observed a large variation among genotypes, environments, and interaction, with superiority of the complex component in the yield and soluble solids traits of Canary melon hybrids.
The presence of the G x E interaction shows inconsis-tent behavior of the families in the different environments (Ramalho et al. 1993). The G x E interaction has been seen in other studies on melon. Gurgel et al. (2005) and Nunes
et al. (2006) found significant interaction between Canary
melon hybrids and environments. Silva et al. (2011), evalu-ating melon families of the Gália type in four locations of Rio Grande do Norte, also observed the presence of the G x E interaction.
In addition, the occurrence of the G x E interaction shows the need for evaluation in various environments so that there is greater assurance in recommendation of the best genotypes. In evaluations in only one environment, the estimate of the σ2
g is overestimated by the component of the
G x E interaction, which cannot be estimated. In contrast, in evaluations in more than one environment, the interaction component can be estimated and separated from the genetic effect, making the estimate of σ2
g more precise and exact
(Ramalho et al. 2000). The G x E interaction obviously also affects the heritability estimate (Falconer and Mackay 1996). In this study, overestimation of the estimates of the components of σ2
g and of heritability was striking upon
Table 2. Estimates of the simple (S) and complex (C) parts of the genotype x environment interaction of traits of melon families evaluated in three environments, two by two, and in combined analysis
Trait E1 and E2 E1 and E3 E2 and E3 Combined
S (%) C (%) S (%) C (%) S (%) C (%) S (%) C (%)
Fruit weight 100 0 100 0 100 0 100 0 Pulp thickness 100 0 100 0 100 0 100 0 Cavity thickness 100 0 100 0 100 0 100 0
Pulp firmness 99.99 0.01 3.40 96.6 34.15 65.85 45.80 54.20
comparing the estimates of individual analyses with the combined analyses (Table 1).
The G x E interaction plays a fundamental role in phenotypic manifestation (Lynch and Walsh 1998). When this is marked, it greatly affects the selection process of promising genotypes (Bos and Caligari 1997). As cited, the interaction overestimates the components of variance when the location of the experiment does not represent the region or when the evaluation is made in only one location.
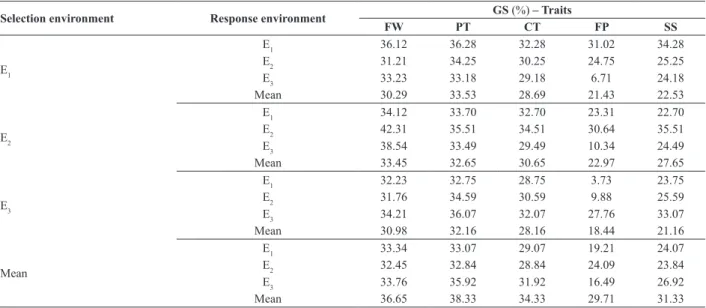
Gains through family selection
For all the traits and in all the environments, direct gains, characterized when the selection and the response happen in the same environment, were greater than indirect gains
(Table 3), defined when selection and the response occur
in different environments.
For mean fruit weight, the indirect genetic gains were similar when selection was carried out in E1, with an am-plitude of only 2.94%. When selection was carried out in environment E2, the amplitude was a little greater, but still small. The selection made in E3 led to an amplitude of gains of only 1.25%. Selection made in the mean of the environ-ments also led to low amplitude among the environenviron-ments, only 1.31%.
In relation to pulp thickness, the amplitudes of gain from indirect selection when selection was made in the E1, E2, and E3 environments and in the mean of the environments were 1.07, 1.05, 2.43, and 3.44%, respectively. And, for cavity thickness, gains from indirect selection in the E1, E2,
and E3 environments and in the mean of the environments were 1.57, 3.21, 2.43, and 3.08%, respectively.
For pulp firmness, due to the G x E interaction, there was
greater amplitude in the gains from indirect selection (Table 3). The lowest genetic gains were observed in combined analyses in the E3 environment, in which predominance of the complex part of the interaction was observed (Table 2).
For soluble solids content, the gains through indirect selection exhibited greater magnitude than in the other traits, except for selection made in E1, where the gains equaled the responses obtained in the other traits.
In a general way, it was seen that the genetic gains from selection were less for all the traits evaluated when the selection was carried out in each environment and the response was observed in the mean of the environments (Vencovsky et al. 2012); nevertheless, the gains were nearer the direct genetic gains when selection in the mean of the three locations was practiced.
For pulp firmness, the lower gains indicate low correlation
of the mean values of the families between two environments because there is no coincidence between the best families
between two locations. This may be verified in the analyses
that involve environment E3 (Table 3), probably because this environment has edaphic and climatic characteristics different from environments E1 and E2.
The reduction in indirect gains indicates that the families should be grown only in the location of selection. Consider-ing that in breedConsider-ing the main objective is a melon cultivar
Table 3. Direct and indirect gains from selection for traits of melon families evaluated in three environments
Selection environment Response environment GS (%) – Traits
FW PT CT FP SS
E1
E1 36.12 36.28 32.28 31.02 34.28 E2 31.21 34.25 30.25 24.75 25.25 E3 33.23 33.18 29.18 6.71 24.18 Mean 30.29 33.53 28.69 21.43 22.53
E2
E1 34.12 33.70 32.70 23.31 22.70 E2 42.31 35.51 34.51 30.64 35.51 E3 38.54 33.49 29.49 10.34 24.49 Mean 33.45 32.65 30.65 22.97 27.65
E3
E1 32.23 32.75 28.75 3.73 23.75 E2 31.76 34.59 30.59 9.88 25.59 E3 34.21 36.07 32.07 27.76 33.07 Mean 30.98 32.16 28.16 18.44 21.16
Mean
E1 33.34 33.07 29.07 19.21 24.07 E2 32.45 32.84 28.84 24.09 23.84 E3 33.76 35.92 31.92 16.49 26.92 Mean 36.65 38.33 34.33 29.71 31.33
that exhibits good performance in most of the production region, the results of this study are unfavorable only for
pulp firmness since it was the characteristic most affected
by the genotype x environment interaction.
The selection carried out in an environment with re-sponse expected in the mean of the environments also led to reduction in genetic gains, even though small in most cases. This fact shows that selection in the individual environment does not lead to satisfactory gains, not even in the mean of the environments. An alternative is selection based on the mean of the families in the three selection environments. In this situation, all the gains are positive and nearer to direct gains (Table 3).
Thus, it is recommended that the evaluations be carried out in divergent environments and that selection be made based on the mean of these locations. This is a good strategy since interaction had very little effect on the traits, except
for pulp firmness. Even for pulp firmness, the genetic gains
from evaluation made by the mean of the three locations exhibit reasonable magnitudes when compared to direct gains. That occurs because the predominance of the com-plex part for this trait is low in relation to the simple part in combined analysis.
Therefore, the G x E interaction directly affects gains from selection due to the lack of correlation between the mean values of the genotypes in the evaluation
environ-ments (Xie and Mosjidis 1996). Thus, when selection is made in one environment and the response is observed in another, in the presence of a strong G x E interaction, the gain expected from selection is reduced.
It was observed that the direct gains were always greater than the indirect gains in all the situations and for all the traits, which reinforces the presence of the G x E
interaction. However, except for pulp firmness, it should be
emphasized that the differences in direct and indirect gains were reduced for all the traits, showing little effect of the G x E interaction in selection. Therefore, selection based on mean behavior of the families leads to greater gains from selection in relation to the gains obtained based on selection in the individual environment.
It may be concluded that the selection work carried out by the breeder is facilitated upon evaluating families when there is predominance of the component of a simple nature of the G x E interaction. Nevertheless, when the magnitude of the G x E interaction is high, with predominance of the component of a complex nature, the estimates of the CVg and of σ2
g in an environment are overestimated by the
com-ponent of this interaction. Consequently, the direct gains from selection are greater in relation to indirect gains. In these situations, evaluations in more than one location are necessary, but selection should be practiced by the overall mean of the genotypes in the environments evaluated.
Interação genótipo x ambiente de famílias de meloeiro por meio de caracteres
de qualidade dos frutos
Resumo – Devido à diversidade geográfica das regiões cultivadas com melão e ao manejo, significante interação genótipo x ambiente (G x A) é esperada. Visando estudar essa interação, 96 famílias F3 do cruzamento entre melões inodorus e conomon foram avaliadas em três ambientes. Foram estimados: interação G x A, parâmetros genéticos e ganhos diretos e indiretos. Foram avaliadas: massa do fruto, espessura da polpa, espessura da cavidade, firmeza da polpa e sólidos solúveis. A parte simples da interação superou 99%, exceto para firmeza da polpa, que predominou a complexa. A herdabilidade na análise conjunta foi inferior àquelas estimadas em cada ambiente. O coeficiente de variação genético e a variância genética foram superestimados pela interação. Os ganhos diretos foram maiores do que os indiretos, exceto com a seleção pela média dos locais. Portanto, é necessário avaliar genótipos em mais de um local, desde que a seleção seja praticada pela média dos ambientes.
Palavras-chave: Cucumis melo, parâmetros genéticos, ganhos por seleção.
REFERENCES
Allard RW (1999) Principles of plant breeding. John Willey, New York, 485p.
Bos I and Caligari P (1997) Selection methods in plant breeding. Chapman e Hall, New York, 347p.
Campbell BT and Jones MA (2005) Assessment of genotype x environment
interactions for yield and fiber quality in cotton performance trials. Euphytica 144: 69-78.
Cooper M and De Lacy IH (1994) Relações entre os métodos de análise
utilizados para estudar a variação genotípica e pelo genótipo-ambiente de interação no melhoramento de plantas multi-experimentos ambiente. Theoretical Applied of Genetics 88: 561-572.
Cruz CD and Carneiro PCS (2006) Modelos biométricos aplicados ao melhoramento genético. Vol 2, UFV, Viçosa, 585p.
Cruz CD and Castoldi FL (1991) Decomposição da interação genótipos x ambientes em partes simples e complexa. Revista Ceres 38: 422-430. Falconer DS and Mackay TFC (1996) Introduction to quantitative
FAO (2014) FAOSTAT. Available at <http://faostat.fao.org/site/567/ DesktopDefault.aspx?PageID=567#ancor>. Accessed in January 2014.
Farias FJC, Ramalho MAP, Carvalho LP and Moreira JAN (1996) Parâmetros de estabilidade em cultivares de algodoeiro herbáceo avaliadas na Região Nordeste do Brasil. Pesquisa Agropecuária Brasileira 31: 877-883.
Gurgel FL, Krause W, Schmildt ER and Sena LCN (2005) Indicação de híbridos de melão para o Rio Grande do Norte. Revista Ceres 52:
115-123.
Hopkins AA, Vogel KP, Moore KJ, Johnson KD and Carlson IT (1995) Genotype effects and genotype by environment interactions for traits of elite switchgrass populations. Crop Science 35: 125-132. IBGE (2014) SIDRA: Sistema IBGE de recuperação automática. Available
at <http://www.sidra.ibge.gov.br/bda/pesquisas/pam/default.asp>. Accessed in January 2014.
Kang MS and Magari R (1996) New development in selection for phenotypic stability in crop breeding. In Kang MS and Gauch HG (Eds) Genotype by environment interaction. CRC, Boca Raton, p. 1-14.
Lima LL, Nunes GHS and Bezerra Neto F (2004) Coeficientes de variação de algumas características do meloeiro: uma proposta de classificação.
Horticultura Brasileira 22: 14-17.
Lynch MC and Walsh B (1998) Genetics and analysis of quantitative traits. Sinauer Associates, Sunderland, 980p.
MDIC (2014) ALICEWEB: Sistema de análise das informações de comércio exterior. Available at <http://aliceweb.mdic.gov.br/index/ home>. Accessed in February 2014.
Nunes GHS, Santos Júnior JJS, Vale FA, Bezerra Neto F, Almeida AHB and Medeiros DC (2004) Aspectos produtivos e de qualidade de híbridos de melão cultivados no pólo Mossoró-Assú. Horticultura
Brasileira 22: 744-747.
Nunes GHS, Madeiros AES, Grangeiro LC, Santos GM and Sales Júnior R (2006) Estabilidade fenotípica de híbridos de melão amarelo avaliados no pólo agrícola Mossoró-Assú. Pesquisa Agropecuária Brasileira 41: 1369-1376.
NunesGHS, Santos Júnior H, Grangeiro LC, Bezerra Neto F, Dias CTS and Dantas MSM (2011) Phenotypic stability of hybrids of Galia melon in Rio Grande do Norte state, Brazil. Anais da Academia Brasileira de Ciências 83: 1421-1434.
Ramalho MAP, Santos JB and Zimmermann MJ (1993) Genética quantitativa em plantas autógamas. UFG, Goiânia, 272p. Ramalho MAP, Ferreira DF and Oliveira AC (2000) Experimentação
em genética e melhoramento de plantas. UFLA, Lavras, 326p. Romagosa I and Fox PN (1993) Genotype x environment interactions
and adaptation. In Hayward MD, Bosemark NO and Romagosa I (Eds) Plant breeding: principles and prospects. Chapman e Hall, London, p. 375-390.
Silva RA, Bezerra Neto F, Nunes GHS and Negreiros MZ (2002) Estimação de parâmetros e correlações em famílias de meio-irmãos de melões Orange Flesh. Caatinga 15: 43-48.
Silva JM, Nunes GHS, Costa GG, Aragão FAS and Maia LKR (2011) Implicações da interação genótipos x ambientes sobre ganhos de seleção em meloeiro. Ciência Rural 41: 51-56.
Vencovsky R and Barriga P (1992) Genética biométrica no fitomelhoramento. Revista Brasileira de Genética, Ribeirão Preto, 486p.
Vencovsky R, Ramalho MAP and Toledo FHRB (2012) Contribution and perspectives of quantitative genetics to plant breeding in Brazil. Crop Breeding and Applied Biotechnology 12: 7-14.