1
CHAPTER 3
Three-Compartment Model: Critical Evaluation Based Upon Neutron
Activation Analysis
1Analiza M. Silva, Wei Shen, ZiMian Wang, John F. Aloia, Miriam E. Nelson, Steven B. Heymsfield, Luis B. Sardinha, Stanley Heshka
ABSTRACT
There is renewed interest in Siri’s classic three-compartment (3C) body composition model, requiring body volume (BV) and total body water (TBW) estimates, as dual-energy x-ray absorptiometry (DXA) and in vivo neutron activation (IVNA) systems cannot accommodate subjects with severe obesity. However, the 3C model assumption of a constant mineral (M) to total body protein (TBPro) ratio (α) and related residual mass density (DRES) based on cadaver analyses might not be valid across groups differing in sex, race, age, and weight. The aim of this study was to derive new 3C model coefficients in vivo and to compare these estimates to those derived by Siri. Healthy adults (n=323) were evaluated with IVNA and DXA and the measured components used to derive α and DRES. For all subjects combined, α and DRES (mean ± SD, 0.351 ± 0.043; 1.565 ± 0.023 kg/L) were similar to Siri’s proposed values of 0.35 and 1.565 kg/L, respectively. However, α and DRES varied significantly as a function of sex, race, weight, and age. Expected errors in percent body fat arising by application of Siri’s model were illustrated in a second group of 264 adults,
including some whose size exceeded DXA limits, but whose BV and TBW had been measured by hydrodensitometry and 2H2O dilution, respectively. Extrapolation of predictions by newly developed models to very high weights allowed percent fat error estimation when Siri’s model is applied in morbidly obese subjects. The present study results provide a critical evaluation of potential errors in the classic 3C model and present new formulas for use in selected populations.
“Even when the laws have been written down, they should not always remain unchanged.”
Aristotle
1
INTRODUCTION
Behnke et al. (1, 2) introduced the now-classic two-compartment body
composition model more than five decades ago. The model characterized body mass as two components, fat with a density of 0.9007 kg/L and lean or fat-free mass (FFM) with a density of 1.100 kg/L (3). Two measurements were required to calculate fat mass and FFM in vivo, body volume by underwater weighing and body mass using a conventional scale.
While Behnke’s approach (1) filled a critical methodology gap for body fat measurement, workers in the following two decades noted model concerns, notably the assumption that FFM density is constant across all subjects in health and disease, including in patients with severe obesity (4). The FFM component at the molecular body composition level includes total body water (TBW), protein (TBPro), soft tissue minerals (Ms), bone minerals (Mo), and glycogen (G) (5). Any actual subject
differences in the proportions of these components from those assumed stable based on cadaver studies by early two-component model developers (1, 3) will lead to fat and FFM estimation errors.
ratio (i.e. α) of 0.35 as estimated from the five cadavers with a corresponding density of 1.565 kg/L.
In recent years Siri’s 3C model (7) has been supplanted by more complex four and six component models as estimation of Ms and Mo became possible with in vivo
neutron activation (IVNA) analysis (11, 12) and dual-energy x-ray absorptiometry (DXA) (13). However, most DXA and IVNA systems cannot accommodate subjects with severe or morbid obesity, leaving underwater weighing or the recently introduced air-plethysmography methods for body volume measurement along with TBW
measurement by isotope dilution as viable means by which to quantify fat and FFM. Therefore, renewed interest is now directed to Siri’s 3C model with the rising
prevalence of obesity (14). This led us in the current study to critically evaluate Siri’s 3C model (7) as it applies across sex, age, weight, and race groups. We specifically focused our attention on the assumed value of α and the related density of the
combined compartment including M, TBPro, and glycogen. In vivo neutron activation analysis and DXA techniques, unavailable during Siri’s era, allowed us to evaluate Ms, Mo, TBPro, and glycogen in a large sample of healthy adults.
METHODS
Protocol and Subjects
Hospital in New York City. The next study day subjects underwent delayed- and prompt- in vivo neutron activation analysis and whole-body 40K counting at Brookhaven National Laboratory (BNL), in Upton, Long Island.
Subjects were a convenience sample of 323 healthy adults participating in other unrelated investigations. A physical examination and routine blood studies indicated that each of these individuals was in good health. The sex and race distribution of this sample was dictated by the original planned studies.
In a second phase of our study we examined potential biological errors inherent in the Siri formula compared to the new models developed in the initial study group. These errors were modelled for illustrative purposes in a second convenience sample of 293 healthy adults who had body volume and TBW measured by underwater weighing and deuterium dilution (2H2O), respectively, measured on the same day. These subjects participated in other on-going investigations (15) and did not complete neutron
activation analysis studies. The sample includes subjects at the extreme upper range of body weight whose size necessitates the development and improvement of alternative practical evaluation methods. The investigation was approved by the Institutional Review Boards of St. Luke’s-Roosevelt Hospital and BNL.
Body Composition Measurements
Total Body Potassium (TBK). Total body potassium was estimated from the
Total body nitrogen, calcium, sodium, and chlorine (TBN, TBCa, TBNa,
TBCl). These elements were quantified using the in vivo neutron activation analysis facilities at BNL (12, 18). Nitrogen was measured with ~3.5 MeV neutrons provided by the prompt-γ system from a collimated 238PuBe source positioned beneath the recumbent subject. Sodium iodide detectors quantify produced γ rays, H at 2.223 MeV and N at 10.83 MeV. Hydrogen is used as an internal standard to estimate TBN. The CV for repeated phantom measurements is 2.8% for TBN (18).
The BNL delayed-γ neutron activation system was used to measure TBCa, TBNa, and TBCl (18). Fast neutrons of ~3.5 MeV are produced with 14 encapsulated 238
PuBe sources positioned below and above the recumbent subject resting inside the irradiation chamber. The subject is irradiated with fast neutrons for five minutes and then moved to a counting area where the following reactions are monitored for TBCa, TBNa, and TBCl: 48Ca + n → 49Ca* → 49Ca + γ (3.10 MeV); 23Na + n → 24Na* →
24Na + γ (2.75 MeV); and 37Cl + n → 38Cl* → 38Cl + γ (2.17 MeV)). The CV’s for repeated phantom measurements of TBCa, TBNa, and TBCl are 1.5%, 1.6%, and 1.7%, respectively (19).
therefore converted to total body bone mineral (Mo = BMC/0.9582). The precision of the DXA system used is 1.3% for bone mineral (21).
Total body water. TBW, expressed in kg, was measured by deuterium dilution
corrected for 4% isotope exchange and water density at 36ºC (22).
Body volume (BV). BV, expressed in L, was determined by underwater
weighing. Body weight during submersion was recorded by a platform force
transducers during a 5-s maximal expiration. After a series of practice trials, 10 runs were performed and the density results were averaged. Corrections in density were made for residual lung volume by using a closed-circuit oxygen-dilution system described by Wilmore (23). Residual volume was measured immediately after the underwater weighing procedure. The between-day coefficient of variation (CV) for body volume technique is 1.7% body fat on the basis of repeated studies in five weight-stable individuals in this laboratory.
General 3C Model Derivation
Body minerals were quantified from total body amounts of Ca, K, Na, and Cl by a combination of whole-body 40K counting and delayed-γin vivo neutron activation methods, and total body bone mineral (Mo) from DXA. Specifically, soft tissue
mineral was calculated from TBK, TBNa, TBCl, and TBCa (all in kg) as (5, 24), Ms = 2.76 × TBK + TBNa + 1.43 × TBCl − 0.038 × TBCa (1) total body mineral (M) was calculated as:
Total body protein was calculated from TBN measured in vivo using prompt-γ
neutron activation analysis (25, 26) as TBPro = 6.25 x TBN. Glycogen (G) was calculated from TBPro as G = 0.044 x TBPro (27).
According to equation 2, the M/TBPro ratio was calculated as:
M/TBPro = α = (Mo+Ms)/TBPro (3) The residual mass (RES) is the sum of soft tissue and bone minerals, protein, and glycogen mass:
RES = Mo + Ms + TBPro + G (4) Dividing by the respective densities,
RES/DRES = Mo/2.982 + Ms/3.317 + TBPro/1.34 + G/1.52 (5) where DRES is the density of residual. Considering equation 5, DRES can be expressed
as:
DRES = 1 / (fMo/2.982 + fMs/3.317 + fTBPro/1.34 +fG/1.52) (6) Where fMo, fMs, fTBPro, and fG are the fractions of residual mass as bone mineral,
soft-tissue mineral, protein, and glycogen, respectively. Body mass (BM) and volume (BV) models can be written as,
BM = FM + TBW + RES (7) BV = FM/0.9007 + TBW/0.9937 + RES/ DRES (8) where FM is fat mass. Resolving the simultaneous equations 7 and 8, a 3C fat model can be derived as follows:
We derived a general 3C model based on measurable BM, BV, TBW, and DRES. This allowed us to examine the effects of varying mineral and protein proportions on estimates of fat mass.
The general 3C model is:
FM = C1xBV – C2xTBW – C3xBM (10) where FM is in kg, BV is in L, TBW is in kg and BM is in kg. Each coefficient can be calculated from the following equations:
C1 = DRES /(1.1102x DRES - 1) (11) C2 = (1.0063x DRES -1)/(1.1102x DRES -1) (12) C3 = 1/ (1.1102x DRES -1) (13) Updated Siri 3C Model
Siri combined body mass, volume, and TBW estimates in developing his 3C model (7). The model requires density estimates for the three components, fat, water, and residual mass. The original Siri 3C equation reported in 1961 (7) (FM = 2.118xBV – 0.780xTBW – 1.354xBM) uses a value of 0.9000 kg/L for the density of fat and 0.9933 kg/L for the density of water at 37º C. Although body core temperature approximates 37º C, the average body temperature under basal conditions in a comfortable environment is 1-2º C lower (28). We therefore used 0.9007 kg/L and 0.9937 kg/L, respectively, for the densities of fat and water at 36º C (28). We adjusted Siri’s original 3C model (7) accordingly:
Statistical Methods
All group results are expressed as the mean and standard deviation. Analyses were carried out using the statistical program SPSS v11.5 (SPSS Inc., 2002).
The simple linear correlations between M and TBPro were examined and the groups mean TBPro and residual mass density values were compared between men and women. One-sample t-tests were used to compare the mean densities of residual mass and the α values between subjects in the present study and the mean values reported by Siri (7) (1.565 kg/L and 0.35). Independent sample t-tests were used to compare the mean residual mass density across sex and race groups.
Multiple regression analysis was then used to develop residual mass density prediction equations with sex, age, weight, and race, and interactions between these variables as potential covariates. Separate analyses were carried out for males and females. Interactions of race with other variables were included in the models performed for each gender. Final sex and race-combined residual mass density prediction equations were developed and the normality of the residuals was tested.
RESULTS
Subject Characteristics
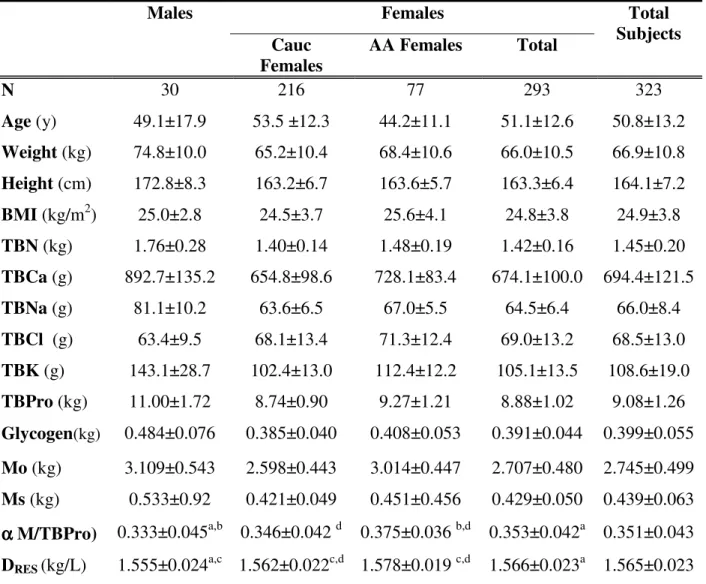
Three hundred and twenty-three subjects, 293 females and 30 males, underwent the study protocol. From the female sample, 216 were Caucasian and 77 were African American. In the male sample, 6 were Caucasians, 13 were African American, 4 were Asians, and 7 were Hispanics. Subject characteristics for the model development sample are presented in Table 3.1.
The table provides separate information on the Caucasian and African
Table 3.1. Subject characteristics and body composition results.
Males Females
Cauc
Females
AA Females Total
Total Subjects
N 30 216 77 293 323
Age (y) 49.1±17.9 53.5 ±12.3 44.2±11.1 51.1±12.6 50.8±13.2 Weight (kg) 74.8±10.0 65.2±10.4 68.4±10.6 66.0±10.5 66.9±10.8 Height (cm) 172.8±8.3 163.2±6.7 163.6±5.7 163.3±6.4 164.1±7.2 BMI (kg/m2) 25.0±2.8 24.5±3.7 25.6±4.1 24.8±3.8 24.9±3.8 TBN (kg) 1.76±0.28 1.40±0.14 1.48±0.19 1.42±0.16 1.45±0.20 TBCa (g) 892.7±135.2 654.8±98.6 728.1±83.4 674.1±100.0 694.4±121.5 TBNa (g) 81.1±10.2 63.6±6.5 67.0±5.5 64.5±6.4 66.0±8.4 TBCl (g) 63.4±9.5 68.1±13.4 71.3±12.4 69.0±13.2 68.5±13.0 TBK (g) 143.1±28.7 102.4±13.0 112.4±12.2 105.1±13.5 108.6±19.0 TBPro (kg) 11.00±1.72 8.74±0.90 9.27±1.21 8.88±1.02 9.08±1.26 Glycogen(kg) 0.484±0.076 0.385±0.040 0.408±0.053 0.391±0.044 0.399±0.055 Mo (kg) 3.109±0.543 2.598±0.443 3.014±0.447 2.707±0.480 2.745±0.499 Ms (kg) 0.533±0.92 0.421±0.049 0.451±0.456 0.429±0.050 0.439±0.063
α α α
α M/TBPro) 0.333±0.045a,b 0.346±0.042 d 0.375±0.036 b,d 0.353±0.042a 0.351±0.043 DRES (kg/L) 1.555±0.024a,c 1.562±0.022c,d 1.578±0.019 c,d 1.566±0.023a 1.565±0.023 Abbreviations: AA, African American; Cauc, Caucasian; BMI, body mass index; α(M/TBPro), ratio mineral to protein; N, number of subjects; SD, standard deviation; TBCa, total body calcium; TBCl, total body chlorine; TBK, total body potassium; TBN, total body nitrogen; TBNa, total body sodium; TBPro, total body protein; Mo, bone mineral; Ms, soft tissue mineral; DRES, residual mass density. a Significant different between males and females (p<0.05) b Significantly different from the proposed Siri (7) ratio mineral to protein=0.35 (p<0.05) c; Significant different from the proposed Siri (7) density of mineral plus protein=1.565 kg/L (p<0.05) d Significant different between Black and Caucasian females (p<0.05) Results are expressed as mean ± SD.
The subjects ranged in weight from a low of 44.1 kg to a high of 96.0 kg with an overall BMI (mean±SD) and range of 24.9 ± 3.8 kg/m2 and 18.1-36.1 kg/m2, respectively. The group as a whole was age 50.8 ± 13.2 yrs with a range of 23-90 yrs.
Caucasian and 24 African American) and 74 males (31 Caucasians, 19 African American, 17 Asians, 7 Hispanics). The characteristics of subjects in this group are presented for Caucasian and African American females and pooled males in Table 3.2.
Table 3.2. Physical characteristics and body composition results from the independent validation sample.
Males Caucasian
Females
AA
Females
N 74 166 24
Age (y) 39.0±17.1 41.1±11.2 47.4±14.0 Weight (kg) 78.8±12.8 75.3±12.4 75.3±15.1 Height (cm) 176.9±6.8 161.4±6.6 163.7±8.3 BMI (kg/m2) 25.1±3.5 28.9±4.7 28.1±5.2 TBW (kg) 45.9±6.9 32.7±3.9 35.1±3.7 BV (L) 75.1±12.7 74.7±13.2 74.1±16.1 DRES (kg/L) 1.565±0.013a 1.565±0.012b 1.616±0.015b,c
%FM Siri-3C 20.80±7.30a 40.13±7.40 35.31±9.90 %FM Adjusted-3C 20.77±7.40a 40.15±7.37 b 35.97±9.96b %FM Differences-3C -0.04±0.23a -0.02±0.18b 0.66±0.13b,d
Abbreviations: AA, African American; BMI, body mass index; BV, body volume; DRES, residual mass density; N, number of subjects; %FM, percent fat mass; SD, standard deviation; TBW, total body water. a
Significantly different between males and females (p<0.05)b; significantly different between African American and Caucasian females (p<0.05)c; significantly different from the proposed Siri (7) density of mineral plus protein=1.565 kg/L (p<0.05) d; significantly different from 0 (p<0.05).
Ratio of Mineral to Protein
Total body mineral was highly correlated with TBPro accounting for 52.1% and 50.0% of the between-individual variation in M for the males (p<0.001) and females (p<0.001), respectively. The value for α of 0.351 ± 0.043 for the whole sample matched closely Siri’s proposed α value of 0.35 (p = 0.549) and did not differ significantly from this value in the pooled female sample (p = 0.174) or in the Caucasian females alone (p = 0.116) (Table 3.1). However, a lower mean α was observed in the male sample (0.333 ± 0.045, p = 0.044) and a higher α (0.375±0.036, p<0.001) was present in the African American females compared to Siri’s α value of 0.35. Four of the cadavers reported by Siri (6, 7) were males and one was a female.
Density of Residual Mass
Propagated measurement error. In the present study we selected IVNA-estimated
soft tissue minerals, TBPro, and glycogen as the criterion because measurement precision is high for total-body potassium, sodium, chlorine, and calcium. The error associated with measurement of the IVNA model components ( Ms) can be estimated for the healthy subjects by assuming an average body composition as shown in Table 3.1 and measurement precisions as stated in Methods. Accordingly,
2
Ms = (2.76 x 0.1086 x 0.010)2 + (1 x 0.066 x 0.015)2 + (1.43 x 0.0685 x 0.016)2 + (0.038 x 0.6944 x 0.017)2 = 0.00001262 kg2
2
TBPro = (6.25 x 1.450 x 0.028)2 = 0.0644 kg2 2
G = (0.275 x 1.450 x 0.028)2 = 0.0001 kg2
The error associated with measurement of the DXA components ( Mo) can be estimated as follows,
2
Mo = (1 x 2.745 x 0.013)2 = 0.0013 kg2
For the final residual mass the propagation of error would be: 2
Res = 2Mo + 2Ms + 2TBPro + 2G= 0.0658 kg2,( Res = ~257 g)
In vivo observations. The residual mass density (Table 3.1) matched closely
observed in the female African American subjects, 1.578±0.019 kg/L (p<0.001) compared to Siri’s (7) value of 1.565 kg/L.
The relationships between residual mass density and age and weight are
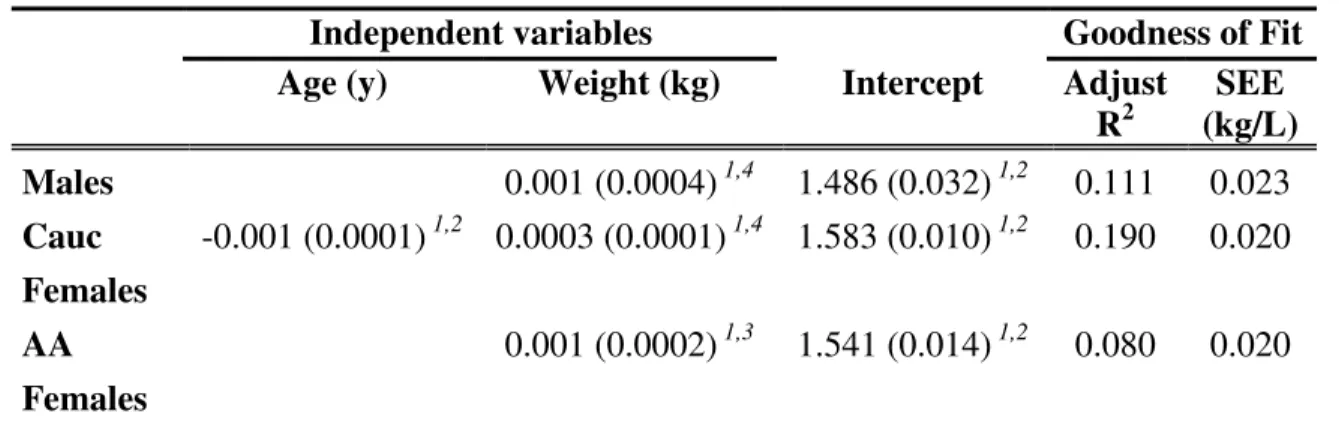
Multiple regression analysis models for residual mass density are presented in Table 3.3. Sex, age, weight, race, and two-way interactions of these variables were
examined as potential covariates in the model with all subjects combined.
Table 3.3. Models for predicting residual mass density.
Abbreviations: AA, African American; Cauc, Caucasian; Adust R2, Adjusted coefficient of determination; SEE, standard error of estimation.
1
Estimate of regression coefficient; SEE in parentheses.
2
P < 0.001, 3 P = 0.01, 4P < 0.05.
There was a significant sex × age interaction (p <0.001), leading us to carry out the remaining analyses in men and women separately. For males, there were no race ×
age (p = 0.292) or race × weight interactions (p = 0.072). In contrast, the race × age interaction in females was significant (p = 0.004), leading us to develop sex and race-specific regression models.
The model predicting residual mass density in males only had weight as a significant predictor variable (p = 0.040). In Caucasian females, age and weight were significant residual mass predictor variables (age: p < 0.001; weight: p = 0.021). For the African American females, only weight was a significant predictor variable in the model (p = 0.007).
Independent variables Goodness of Fit Age (y) Weight (kg) Intercept Adjust
R2
SEE (kg/L)
Males 0.001 (0.0004) 1,4 1.486 (0.032) 1,2 0.111 0.023 Cauc
Females
-0.001 (0.0001) 1,2 0.0003 (0.0001) 1,4 1.583 (0.010) 1,2 0.190 0.020
AA
Females
Application to Independent Sample
Total body water and body volume were used to calculate FM using our adjusted 3C model coefficients and Siri’s 3C model coefficients (7). The results are expressed as percent (%) FM.
The %FM difference was correlated with weight in males, African American females, and Caucasian females and with age for Caucasian females (all p<0.001, Figure 3.3).
There were no differences in the two %FM estimates for males at a weight of about 80 kg, however. Siri’s model overestimated %FM by 0.5% and underestimated %FM by 0.5% at weights of about 60 kg and 100 kg, respectively.
DISCUSSION
The classical 3C model suggested by Siri in 1961 now fills an important gap in metabolism research. No other approach is presently capable of providing reliable fat and FFM estimates in patients with severe obesity. This renewed importance of the 3C model led us in the current study to critically evaluate fundamental model assumptions.
Siri developed his 3C model based upon the limited data available at the time (6, 7). We made minor revisions to his formula, as noted earlier (i.e., equation 14), for the density of fat and water values adjusted for average body temperature (36oC) rather than core temperature (37oC). Siri assumed residual mass consisted of two
components, M and TBPro that are present in the ratio (M/TBPro, α) of 0.35. This assumption of stable proportionality of M and TBPro then allowed calculation of residual mass density, an assumed constant in the 3C model. At the time of model development, Siri only had values for bone ash and TBPro on five cadavers, four males and one female. He applied this data with a rough estimate of mineral density (3 kg/L) to derive a value for α and DRES. No corrections were made to convert the cadaver bone mineral ash to total mineral or to consider the separate contributions of soft tissue and bone minerals, limitations he acknowledged (6, 7).
Despite these rough cadaver-based estimates of α and DRES, Siri’s
An important speculation made by Siri was that the SD of α in the general population was likely less that 0.1 (7). With this SD, he estimated the range of biological error to be only 1-2% of fat expressed as a percentage of body weight. For example, with a 30% change in α, the estimation error in fat mass will be as little as 2.0% of body weight. We confirmed Siri’s estimation of M/TBPro variation in our subjects who had an α range of –28% to 32% and a SD of only 0.043. These
considerations combined with the fortuitous agreement between Siri’s DRES estimate and our own suggest that equation 14 should serve, with limitations recognized, as a useful operational 3C model for general use.
Nevertheless, analysis of separate groups in our study revealed DRES is not actually “constant” across subjects but varies predictably with sex, race, age, and weight. Accordingly, we developed sex and race-specific DRES formulas to the extent possible given the limiting nature of our evaluated convenience sample. Residual mass density tends to be lower in men (1.555±0.024 kg/L) than in women (1.566±0.023 kg/L), in old compared to young subjects, and in Caucasian (1.562±0.022kg/L)
compared to African American (1.578±0.019 kg/L) females. Thus, the specific features of our study sample, particularly the much larger number of women, ultimately
determined the observed “average” DRES of 1.565 kg/L. The DRES prediction models (Table 3.3) or these average DRES values (Table 3.1) could be used to develop more specific 3C fat mass estimation formulas for each of the respective groups.
magnitude of these error estimates can be viewed by taking an extreme example, elderly normal-weight Caucasian women compared to obese African American
women. The %FM estimate in elderly Caucasian women would be high by ~1% and in the African American women low by ~1%, a difference of ~2%. While these are not relatively large errors in estimating relative fatness, the biases might become important when examining questions such as subtle race differences in resting energy expenditure (29).
A related question, one that prompted the current study, is the %FM estimation errors arising when Siri’s 3C model is applied in persons with severe obesity. To estimate these errors we must extrapolate residual mass density estimates beyond that of the maximum model development group weight of about 100 kg. This is a
reasonable extension as no curvilinear components were observed in our developed DRES prediction model in the present study cohort. We can estimate the expected error in %FM for males and African American females by a simple extension of the
regression lines presented in Figure 3.3 which illustrates the differences between the original and corrected models when applied to an independent sample of subjects. Siri’s model would underestimate %FM by 1.5% to 2.0% in males and African American females when weights are in the severely obese range of 150 kg to 200 kg. As noted earlier, these are not extremely large errors but their significance must be judged in the context of the measurement application.
Study Limitations
The current study applied state-of-the art methods that allowed the first
the present investigation. Our convenience sample did not have an adequate size, racial diversity, and weight variation to accommodate all of the issues surrounding 3C model development, although our findings do reveal potential sources of model error. Our analyses were based on a cross-sectional sample and the extent to which subjects changing weight over time conform to the model predictions is unknown. We anticipate that our revised 3C model may find application to the study of body composition changes, for example, in subjects undergoing bariatric surgery, but such studies should be viewed with caution pending validation of the revised models on longitudinal data.
CONCLUSION
REFERENCES
1. Behnke, A. R., Jr., Feen, B. G. & Welham, W. C. (1942) The specific gravity of healthy men. Body weight divided by volume as an index of obesity. 1942, J
Am Med Assoc, 118, 495-498.
2. Behnke, A. R. & Royce, J. (1966) Body size, shape, and composition of several types of athletes, J Sports Med Phys Fitness, 6, 75-88.
3. Brozek, J., Grande, F. & Anderson, J. T. (1963) Densitometry analysis of body composition: Revision of some quantitative assumptions., Ann N Y Acad Sci, 110, 113-140.
4. Das, S. K., Roberts, S. B., Kehayias, J. J. et al. (2003) Body composition assessment in extreme obesity and after massive weight loss induced by gastric bypass surgery, Am J Physiol Endocrinol Metab, 284, E1080-8.
5. Wang, Z. M., Ma, R., Pierson, R. N., Jr. & Heymsfield, S. B. (1993) Five-level model: reconstruction of body weight at atomic, molecular, cellular, and tissue-system levels from neutron activation analysis, Basic Life Sci, 60, 125-8. 6. Siri, W. E. (1956) The gross composition of the body, Adv Biol Med Phys, 4,
239-280.
8. Forbes, R. M., Cooper, A. R. & Mitchell, H. H. (1953) The composition of the adult human body as determined by chemical analysis, J Biol Chem, 203, 359-366.
9. Mitchell, H. H., Hamilton, T. S., Steggerda, F. R. & Bean, H. W. (1945) The composition of the adult human body and its bearing on the biochemistry of growth, J Biol Chem, 158, 625-637.
10. Widdowson, E. M., McCance, R. A. & Spray, C. M. (1951) The chemical composition of the human body, Clin Sci (Lond), 10, 113-125.
11. Cohn, S. H., Vartsky, D., Yasumura, S. et al. (1980) Compartmental body composition based on total-body nitrogen, potassium, and calcium, Am J
Physiol, 239, E524-E530.
12. Cohn, S. H. & Dombrowski, C. S. (1971) Measurement of total-body calcium, sodium, chlorine, nitrogen, and phosphorus in man by in vivo neutron
activation analysis, J Nucl Med, 12, 499-505.
13. Pietrobelli, A., Formica, C., Wang, Z. & Heymsfield, S. B. (1996) Dual-energy x-ray absorptiometry body composition model: A review of physical concepts,
Am J Physiol, 271, E941-E951.
14. Wyatt, H. R. (2003) The prevalence of obesity, Prim Care, 30, 267-279. 15. Pietrobelli, A., Allison, D. B., Heshka, S. et al. (2002) Sexual dimorphism in
16. Pierson, R. N., Jr., Wang, J., Colt, E. W. & Neumann, P. (1982) Body
composition measurements in normal man: the potassium, sodium, sulfate and tritium spaces in 58 adults, J Chronic Dis, 35, 419-428.
17. Cohn, S. H. & Parr, R. M. (1985) Nuclear-based techniques for the in vivo study of human body composition. Report of an Advisory Group of the International Atomic Energy Agency, Clin Phys Physiol Meas, 6, 275-301. 18. Dilmanian, F. A., Weber, D. A., Yasumura, S. et al. (1990) Performance of the
delayed- and prompt-gamma neutron activation systems at Brookhaven National Laboratory, Basic Life Sci, 55, 309-315.
19. Dilmanian, F. A., Lidofsky, L. J., Stamatelatos, I. et al. (1998) Improvement of the prompt-gamma neutron activation facility at Brookhaven National
Laboratory, Phys Med Biol, 43, 339-49.
20. Friedl, K. E., DeLuca, J. P., Marchitelli, L. J. & Vogel, J. A. (1992) Reliability of body-fat estimations from a four-compartment model by using density, body water, and bone mineral measurements, Am J Clin Nutr, 55, 764-770.
21. Heymsfield, S. B., Wang, J., Heshka, S., Kehayias, J. J. & Pierson, R. N. (1989) Dual-photon absorptiometry: comparison of bone mineral and soft tissue mass measurements in vivo with established methods, Am J Clin Nutr, 49, 1283-1289.
23. Wilmore, J. H. (1969) A simplified method for determination of residual lung volumes, J Appl Physiol, 27, 96-100.
24. Heymsfield, S. B., Lichtman, S., Baumgartner, R. N. et al. (1990) Body composition of humans: comparison of two improved four-compartment
models that differ in expense, technical complexity, and radiation exposure, Am J Clin Nutr, 52, 52-8.
25. Heymsfield, S. B., Wang, Z. & Whithers, R. T. (1996) Multicomponent molecular level models of body composition analysis, in: Roche, A.,
Heymsfield, SB, and Lohman, TG (Ed.) Human Body Composition, pp. 129-147. Champaign, IL, Human Kinetics.
26. Cunningham, J. J. (1994) N x 6.25: recognizing a bivariate expression for protein balance in hospitalized patients, Nutrition, 10, 124-7.
27. Snyder, W. S., Cook, M. J., Nasset, E. S. et al. (1984) Report on the task group
on reference man. Oxford, Paergamon Press.
28. Withers, R. T., Laforgia, J. & Heymsfield, S. B. (1999) Critical appraisal of the estimation of body composition via two-, three-, and four-compartment models,
Am J Human Biol, 11, 175-185.