2255-4823/$ – see front matter © 2013 Elsevier Editora Ltda. All rights reserved.
ASSOCIAÇÃO MÉDICA BRASILEIRA
REVISTA DA
7PMVNFt/ÞNFSPt/PWFNCSP%F[FNCSPt*44/t*44/ 0OMJOF
www.ramb.org.br
ARTIGOS
ARTIGOS ORIGINAIS _____________Qualidade da informação da internet disponível para pacientes em páginas em português ___________________________________________________________645 Acesso a informações de saúde na internet: uma questão de saúde pública? ______650 Maus-tratos contra a criança e o adolescente no Estado de São Paulo, 2009_______659 Obesidade e hipertensão arterial em escolares de Santa Cruz do Sul – RS, Brasil ___666 Bone mineral density in postmenopausal women with and without breast cancer ___673 Prevalence and factors associated with thoracic alterations in infants born prematurely __________________________________________________679 Análise espacial de óbitos por acidentes de trânsito, antes e após a Lei Seca, nas microrregiões do estado de São Paulo ___________________________________685 Sobrevida e complicações em idosos com doenças neurológicas em nutrição enteral ______________________________________________________691 Infliximab reduces cardiac output in rheumatoid arthritis patients without heart failure ______________________________________________________698 Análise dos resultados maternos e fetais dos procedimentos invasivos genéticos fetais: um estudo exploratório em Hospital Universitário _______________703 Frequência dos tipos de cefaleia no centro de atendimento terciário do Hospital das Clínicas da Universidade Federal de Minas Gerais __________________709 ARTIGO DE REVISÃO ______________Influência das variáveis nutricionais e da obesidade sobre a saúde e o metabolismo __714
EDITORIAL Conclusão: como exibir a cereja do bolo 633 PONTO DE VISTA
Os paradoxos da medicina contemporânea 634 IMAGEM EM MEDICINAObstrução duodenal maligna: tratamento
endoscópico paliativo utilizando prótese metálica autoexpansível 636 Gossypiboma 638
DIRETRIZES EM FOCO Hérnia de disco cervical no adulto: tratamento cirúrgico 639 ACREDITAÇÃOAtualização em perda auditiva: diagnóstico radiológico 644
SEÇÕES ____________________________
www.ramb.org.br
Revista da
ASSOCIAÇÃO MÉDICA BRASILEIRA
REV ASSOC MED BRAS. 2013;59(5):475-486
Original article
Validity of the methods to assess body fat in children
and adolescents using multi-compartment models
as the reference method: a systematic review
q
Danilo R.P. Silva
a,*, Alex S. Ribeiro
a, Fernando H. Pavão
a,
Enio R.V. Ronque
a, Ademar Avelar
a, Analiza M. Silva
b, Edilson S. Cyrino
aa Universidade Estadual de Londrina, Londrina, PR, Brazil
b Exercise and Health Laboratory, Faculdade Motricidade Humana, Universidade Técnica de Lisboa, Cruz-Quebrada, Portugal
A RT I C L E I N F O
Article history:
Received 16 January 2013 Accepted 23 March 2013
Keywords:
Adiposity Validity Youth
q Study conducted at the Universidade Estadual de Londrina, Londrina, PR, Brazil.
* Corresponding author.
E-mail: [email protected] (D.R.P. Silva).
A B S T R A C T
Objective: To analyze the validity of methods to assess body fat in children and adolescents
using a systematic review.
Methods: The search was performed by two independent researchers using the MEDLINE,
BioMed Central, SciELO, and LILACS electronic databases. For inclusion, the articles should have been written in English or Portuguese, and must have used multi-compartment models as the criterion measure of the model, with body fat measurement of the whole body in non-athlete children and adolescents.
Results: A preliminary search resulted in 832 studies. After all selection steps were performed,
12 articles were included. The selected studies were published between 1997 and 2010, whose samples consisted of children and adolescents with levels of relative body fat ranging from 20.7% to 41.4%. The methods used were: dual energy X-ray absorptiometry (58.3%), isotope dilution (41.6%), skinfold thickness (33.3%), hydrostatic weighing (25%), bioelectrical impedance analysis (25%), air displacement plethysmography (16.6%), and total body electrical conductivity (8.3%).
Conclusions: Based on the analysis of the studies, isotope dilution and air displacement
plethysmography methods were the most reliable, despite the limited number of studies. As for clinical use or for population-based studies, the equation of Slaughter et al. (1988), which uses the triceps and subscapular skinfold thickness, showed the best results for assessment of body fat in this population.
Validade dos métodos para avaliação da gordura corporal em crianças e adolescentes por meio de modelos multicompartimentais:
uma revisão sistemática
R E S U M O
Objetivo: Analisar a validade de métodos para avaliação de gordura corporal em crianças e
adolescentes.
Métodos: A busca foi realizada por dois pesquisadores independentes, nas bases eletrônicas
MEDLINE, BioMed Central, SciELO e LILACS. Como critérios de inclusão, os artigos deveriam ser escritos nas línguas inglesa ou portuguesa, ter utilizado como medida critério modelos multicompartimentais, com medida de gordura corporal em crianças e adolescentes não atletas.
Resultados: A busca preliminar resultou em 832 artigos, e após todas as etapas de seleção
12 compuseram esta revisão. Os trabalhos selecionados foram publicados entre 1997 e 2010, com amostras formadas por crianças e adolescentes com níveis de gordura corporal relativa de 20,7-41,4%. Os métodos utilizados foram: absortometria radiológica de dupla energia (58,3%), diluição de isótopos (41,6%), espessura de dobras cutânea (33,3%), pesagem hidrostática (25%), impedância bioelétrica (25%), pletismografia por deslocamento de ar (16,6%) e condutividade elétrica corporal total (8,3%).
Conclusão: A partir da análise dos estudos, concluímos que os métodos diluição de isótopos
e pletismografia por deslocamento de ar foram os que se apresentaram mais confiáveis, apesar do número reduzido de investigações. Já para a utilização clínica e em estudos populacionais, a equação de Slaughter et al., que utiliza a espessura das dobras cutâneas tricipital e subescapular, foi a que apresentou melhores resultados para avaliação da gordura corporal nessa população.
© 2013 Elsevier Editora Ltda. Todos os direitos reservados.
Palavras-chave:
Adiposidade Validade Jovens
Introduction
With the advances in methods and techniques used to assess body composition, together with the development of new equipment that allow for more precise identification of different body components, the use of multi-compartment models has become prevalent in the research field. However, despite the high-quality of data produced, multi-compartment models (four or more compartments) still have some disadvantages compared to the two- or three-compartment models, such as the need for sophisticated, high-cost, and difficult to use equipment, which limits their use in different fields of professional activity, both in clinical settings and in population-based studies.
In this sense, relatively simple and lower financial and operational cost methods have been preferred by professionals from the health care and sports areas for the assessment of body composition in different populations. However, to obtain more reliable diagnoses that are less susceptible to misinterpretation, these methods must be validated through on reliable models, with analysis based on appropriate statistical procedures.
In children and adolescents, body composition assessment appears to be even more challenging, as, depending on the growth and biological maturation, there is a large variation in the different body components (water, protein, minerals,
etc.), from birth to adulthood. This variation can significantly affect the estimate of fat mass (FM) and fat-free mass (FFM), especially in two-compartment models. Furthermore, other factors, such as gender and ethnicity, may favor increased estimation errors of these components.1
Thus, the purpose of this study was to analyze the validity of the methods used to estimate body fat in non-athlete children and adolescents, through a systematic review.
Methods
REV ASSOC MED BRAS. 2013;59(5):475-486
477
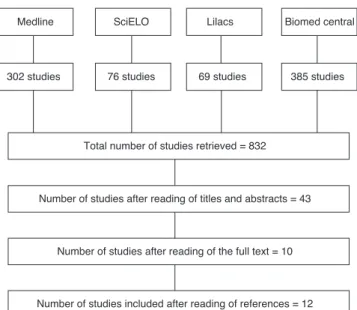
A preliminary search resulted in 832 articles. After the initial selection through the analysis of titles and abstracts, 591 articles were shown to be unrelated to the topic of the review, 153 did not meet the age group of interest, and 45 did not adopt the multi-compartment model as the reference method. Thus, 43 articles were selected for full reading. Of these, seven studies were conducted with athletes, and 26 did not use the established reference method; thus, a total of 10 articles met all previously selected inclusion criteria. Subsequently, based on the analysis of references in these articles, two more studies that met all the criteria were identified, establishing the final total of 12 articles. The study selection process according to the database is shown schematically in Figure 1.
Results
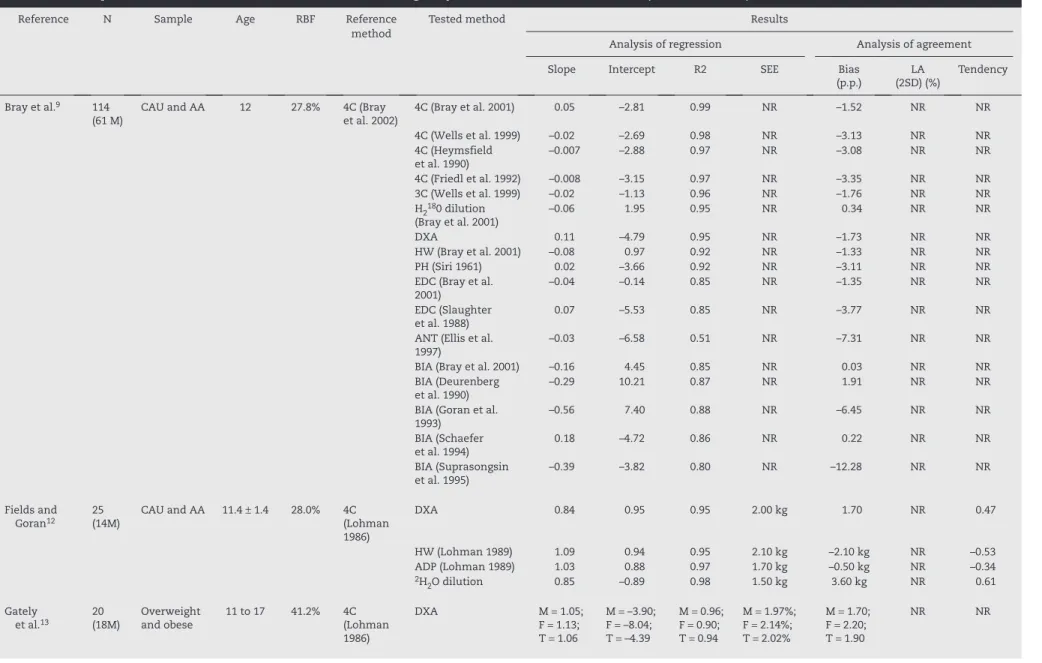
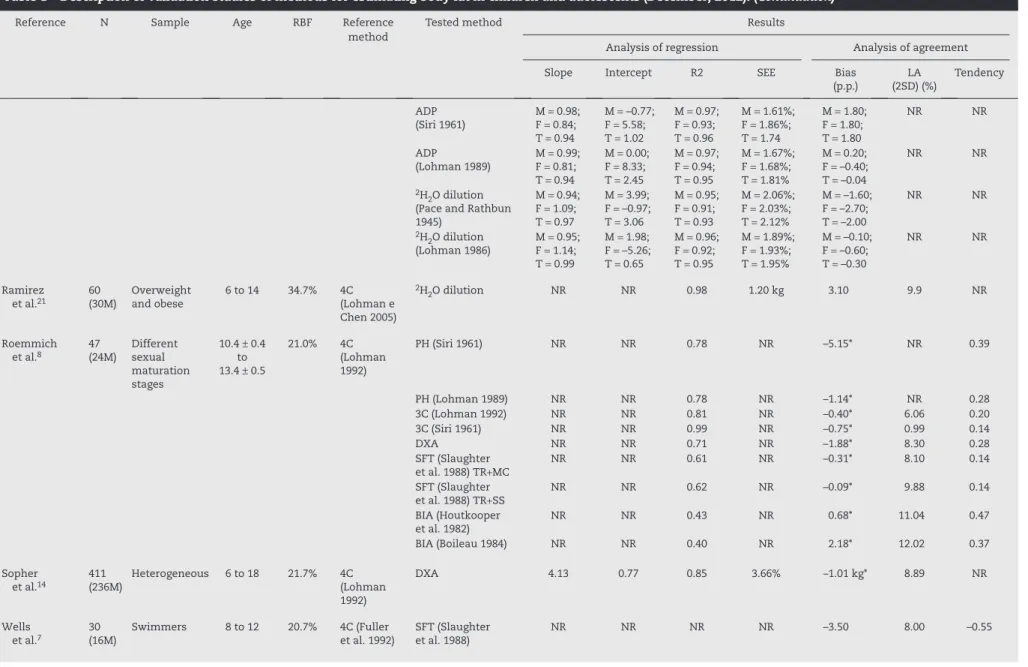
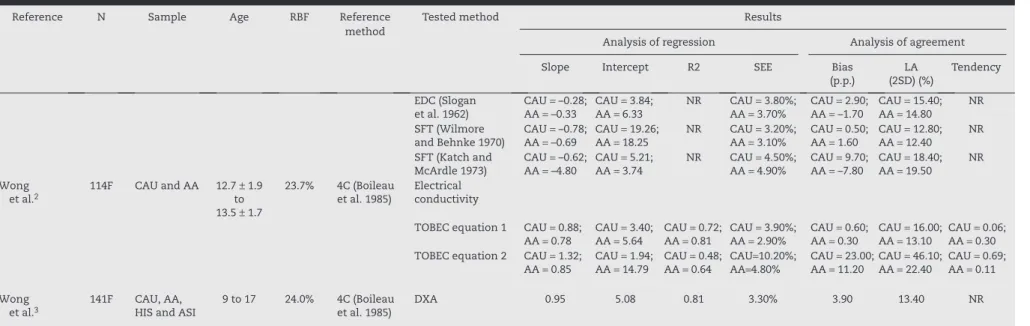
Table 1 shows the description of studies that tested the validity of methods for estimating body fat in children and adolescents that were included in this review.
The 12 studies included and analyzed in the review were published between the years 1997 and 2010. These studies have several distinct characteristics, from the specific characteristics of the study population to the methodological procedures and techniques used for assessing body composition. The samples ranged from 20 to 411 subjects and, with the exception of three studies that investigated only young women,2-4 all others
were performed with individuals of both sexes. Due to the heterogeneity between subjects, a concern for controlling possible confounding variables when interpreting data was observed. The main concerns are shown in Figure 2.
Age range varied from 5 to 21 years. Only five studies had samples consisting only of adolescents (10-19 years). A wide variation was also observed regarding the levels of body fat in young individuals (20.7% to 41.4%).
Six different four-compartment (4C) models were used as reference, 50% of which used the models of Fuller et al.5 or
Boileau et al.6 Three studies7-9 that used other three- and
four-compartment models were used for comparison. Among the tested methods, dual X-ray absorptiometry (DXA) (58.3%), isotope dilution (41.6%), skinfold thickness (SFT) (33.3%), hydrostatic weighing (HW) (25%), bioelectrical impedance analysis (BIA) (25%), air displacement plethysmo-graphy (ADP) (16.6%), and total body electrical conductivity (TOBEC) (8.3%) were the most often used. In some cases, different formulations and techniques were used to assess relative body fat (RBF).
Regarding statistical procedures used, all studies performed Bland-Altman analysis of agreement10 among the measures,
and only four did not use the parameters obtained in the multiple regression analysis. It was observed that there was a wide variation in slope (−4.80 to 4.13) and intercept (−8.33 to 19.26) values, depending on the method analyzed. For the coefficient of determination (R2) values, 27% were higher than
0.95, 58% were greater than 0.89, and 79% were higher than 0.80. Furthermore, only 48% of the standard errors of estimate (SEEs) could be considered excellent.11 Biases ranged from
near zero (3C – Fuller et al.7) to 23 percentage points2 (TOBEC
– Equation 2), whereas only 20% of the limits of agreement (LA) (2SD) analyzed were less than 5%. Regarding the main confounding variables, it was observed that the tendency to measurement deviation varied widely (r = −0.77 to r = 0.69) depending on the variable, as well as the order used (reference/ alternative method) in the agreement analysis.
Discussion
Throughout time, many differences can be observed in the validation studies of methods for reliable estimation of the
Fig. 1 – Search strategy for validation studies of methods to estimate body fat in children and adolescents (December 2012).
Medline SciELO Lilacs Biomed central
385 studies 69 studies
76 studies 302 studies
Total number of studies retrieved = 832
Number of studies after reading of titles and abstracts = 43
Number of studies after reading of the full text = 10
Number of studies included after reading of references = 12
Fig. 2 – Major confounding factors used by the 12 studies selected for this review. BMI, body mass index.
Chronological age
BMI
Sexual maturation
Number of studies
Ethnicity
Sex
REV
ASSOC MED BRAS
. 2013;
59(5)
:475-486
Reference N Sample Age RBF Reference Tested method Results
method
Analysis of regression Analysis of agreement
Slope Intercept R2 SEE Bias
(p.p.)
LA (2SD) (%)
Tendency
Bray et al.9 114
(61 M)
CAU and AA 12 27.8% 4C (Bray
et al. 2002)
4C (Bray et al. 2001) 0.05 –2.81 0.99 NR –1.52 NR NR
4C (Wells et al. 1999) –0.02 –2.69 0.98 NR –3.13 NR NR
4C (Heymsfield et al. 1990)
–0.007 –2.88 0.97 NR –3.08 NR NR
4C (Friedl et al. 1992) –0.008 –3.15 0.97 NR –3.35 NR NR
3C (Wells et al. 1999) –0.02 –1.13 0.96 NR –1.76 NR NR
H2180 dilution
(Bray et al. 2001)
–0.06 1.95 0.95 NR 0.34 NR NR
DXA 0.11 –4.79 0.95 NR –1.73 NR NR
HW (Bray et al. 2001) –0.08 0.97 0.92 NR –1.33 NR NR
PH (Siri 1961) 0.02 –3.66 0.92 NR –3.11 NR NR
EDC (Bray et al. 2001)
–0.04 –0.14 0.85 NR –1.35 NR NR
EDC (Slaughter et al. 1988)
0.07 –5.53 0.85 NR –3.77 NR NR
ANT (Ellis et al. 1997)
–0.03 –6.58 0.51 NR –7.31 NR NR
BIA (Bray et al. 2001) –0.16 4.45 0.85 NR 0.03 NR NR
BIA (Deurenberg et al. 1990)
–0.29 10.21 0.87 NR 1.91 NR NR
BIA (Goran et al. 1993)
–0.56 7.40 0.88 NR –6.45 NR NR
BIA (Schaefer et al. 1994)
0.18 –4.72 0.86 NR 0.22 NR NR
BIA (Suprasongsin et al. 1995)
–0.39 –3.82 0.80 NR –12.28 NR NR
Fields and
Goran12
25 (14M)
CAU and AA 11.4 ± 1.4 28.0% 4C
(Lohman 1986)
DXA 0.84 0.95 0.95 2.00 kg 1.70 NR 0.47
HW (Lohman 1989) 1.09 0.94 0.95 2.10 kg –2.10 kg NR –0.53
ADP (Lohman 1989) 1.03 0.88 0.97 1.70 kg –0.50 kg NR –0.34
2H
2O dilution 0.85 –0.89 0.98 1.50 kg 3.60 kg NR 0.61
Gately
et al.13 20 (18M) Overweight and obese 11 to 17 41.2% 4C (Lohman
1986)
DXA M = 1.05;
F = 1.13; T = 1.06
M = –3.90; F = –8.04; T = –4.39
M = 0.96; F = 0.90; T = 0.94
M = 1.97%; F = 2.14%; T = 2.02%
M = 1.70; F = 2.20; T = 1.90
NR NR
REV
ASSOC MED BRAS
. 2013;
59(5)
:475-486
479
Reference N Sample Age RBF Reference Tested method Results
method
Analysis of regression Analysis of agreement
Slope Intercept R2 SEE Bias
(p.p.)
LA (2SD) (%)
Tendency
ADP (Siri 1961)
M = 0.98; F = 0.84; T = 0.94
M = –0.77; F = 5.58; T = 1.02
M = 0.97; F = 0.93; T = 0.96
M = 1.61%; F = 1.86%; T = 1.74
M = 1.80; F = 1.80; T = 1.80
NR NR
ADP (Lohman 1989)
M = 0.99; F = 0.81; T = 0.94
M = 0.00; F = 8.33; T = 2.45
M = 0.97; F = 0.94; T = 0.95
M = 1.67%; F = 1.68%; T = 1.81%
M = 0.20; F = –0.40; T = –0.04
NR NR
2H
2O dilution
(Pace and Rathbun 1945)
M = 0.94; F = 1.09; T = 0.97
M = 3.99; F = –0.97; T = 3.06
M = 0.95; F = 0.91; T = 0.93
M = 2.06%; F = 2.03%; T = 2.12%
M = –1.60; F = –2.70; T = –2.00
NR NR
2H
2O dilution
(Lohman 1986)
M = 0.95; F = 1.14; T = 0.99
M = 1.98; F = –5.26; T = 0.65
M = 0.96; F = 0.92; T = 0.95
M = 1.89%; F = 1.93%; T = 1.95%
M = –0.10; F = –0.60; T = –0.30
NR NR
Ramirez
et al.21 60 (30M) Overweight and obese 6 to 14 34.7% 4C (Lohman e
Chen 2005)
2H
2O dilution NR NR 0.98 1.20 kg 3.10 9.9 NR
Roemmich
et al.8 47 (24M) Different sexual
maturation stages
10.4 ± 0.4 to 13.4 ± 0.5
21.0% 4C
(Lohman 1992)
PH (Siri 1961) NR NR 0.78 NR –5.15* NR 0.39
PH (Lohman 1989) NR NR 0.78 NR –1.14* NR 0.28
3C (Lohman 1992) NR NR 0.81 NR –0.40* 6.06 0.20
3C (Siri 1961) NR NR 0.99 NR –0.75* 0.99 0.14
DXA NR NR 0.71 NR –1.88* 8.30 0.28
SFT (Slaughter
et al. 1988) TR+MC
NR NR 0.61 NR –0.31* 8.10 0.14
SFT (Slaughter et al. 1988) TR+SS
NR NR 0.62 NR –0.09* 9.88 0.14
BIA (Houtkooper et al. 1982)
NR NR 0.43 NR 0.68* 11.04 0.47
BIA (Boileau 1984) NR NR 0.40 NR 2.18* 12.02 0.37
Sopher
et al.14 411 (236M) Heterogeneous 6 to 18 21.7% 4C (Lohman
1992)
DXA 4.13 0.77 0.85 3.66% –1.01 kg* 8.89 NR
Wells et al.7
30 (16M)
Swimmers 8 to 12 20.7% 4C (Fuller
et al. 1992)
SFT (Slaughter et al. 1988)
NR NR NR NR –3.50 8.00 –0.55
REV
ASSOC MED BRAS
. 2013;
59(5)
:475-486
Reference N Sample Age RBF Reference Tested method Results
method
Analysis of regression Analysis of agreement
Slope Intercept R2 SEE Bias
(p.p.)
LA (2SD) (%)
Tendency
SFT (Johnston et al. 1988)
NR NR NR NR –7.80 8.60 –0.33
SFT (Deurenberg et al. 1990)
NR NR NR NR 1.40 8.40 –0.59
SFT (Brook 1971) NR NR NR NR 5.20 10.50 –0.06
BIA (Deurenberg et al. 1989)
NR NR NR NR 5.90 8.60 –0.77
BIA (Davies et al. 1988)
NR NR NR NR 13.70 8.50 –0.29
BIA (Houtkooper et al. 1989)
NR NR NR NR –2.70 7.90 0.43
BIA (Danford et al. 1992)
NR NR NR NR 6.70 7.20 –0.45
HW (Weststrate and Deurenberg 1989)
NR NR NR NR –2.00 5.60 –0.07
HW (Lohman 1989) NR NR NR NR –1.15 5.20 –0.04
DXA NR NR NR NR –0.20 6.50 0.08
2H
2O dilution NR NR NR NR 0.60 4.90 0.30
3C (Fuller et al. 1992) NR NR NR NR 0.00 0.90 –0.30
Wells
et al.15 153 (96F) Overweight 5 to 21 40.8% 4C (Fuller et al. 1992) DXA NR NR NR NR M F == 0.96 kg; 0.6 9kg;
T = 0.86kg
M = 3.07; F = 4.74; T = 4.10
M = –0.19; F = 0.30; T = 0.17
Williams
et al.16 89 (48F) O and NO 5 to 18 NOO == 41.4% 22.0% 4C (Fuller et al. 1992) DEXA NR NR NR NR NOB NOG == –1.74; –0.03;
OB = 1.41; OG = 1.03
NOB = 3.52; NOG = 3.51; OB = 2.59; OG=3.50
NOB = 0.09; NOG = 0.44; OB = –0.54; OG = –0.52
Wong
et al.4 112F CAU and AA 9 to 17 23.9% 4C (Boileau et al. 1985) Wormersley 1974)SFT (Durnin and CAU AA = –0.29= 0.30; AA CAU = 10.62= 10.05; NR CAU AA = 4.00%= 3.90%; CAU AA == 3.80 2.80; CAU AA == 16.10 15.70; NR
EDC (Brook 1971) CAU = 0.16;
AA = 0.01
CAU = –1.28; AA = 2.55
NR CAU = 4.70%;
AA = 4.90%
CAU = 2.60; AA = 4.60
CAU = 18.80; AA = 19.60
NR
SFT (Durnin and Rahaman 1967)
CAU = –0.40; AA = –0.48
CAU = 13.83; AA = 17.35
NR CAU = 3.60%;
AA = 3.70%
CAU = 4.40; AA = 5.80
CAU = 14.30; AA = 14.90
NR
SFT (Slaughter et al. 1988)
CAU = –0.09; AA = 0.04
CAU = 2.25; AA = 0.04
NR CAU = 5.10%;
AA = 4.50%
CAU = 0.10; AA = 2.10
CAU = 20.40; AA = 17.70
NR
SFT (Jackson et al. 1980)
CAU = –0.003; AA = 0.01
CAU = –7.00; AA = –4.78
NR CAU = 4.50%;
AA = 4.00%
CAU = –7.10; AA = –4.60
CAU = 17.80; AA = 16.00
NR
REV
ASSOC MED BRAS
. 2013;
59(5)
:475-486
481
Reference N Sample Age RBF Reference Tested method Results
method
Analysis of regression Analysis of agreement
Slope Intercept R2 SEE Bias
(p.p.)
LA (2SD) (%)
Tendency
EDC (Slogan et al. 1962)
CAU = –0.28; AA = –0.33
CAU = 3.84; AA = 6.33
NR CAU = 3.80%;
AA = 3.70%
CAU = 2.90; AA = –1.70
CAU = 15.40; AA = 14.80
NR
SFT (Wilmore and Behnke 1970)
CAU = –0.78; AA = –0.69
CAU = 19.26; AA = 18.25
NR CAU = 3.20%;
AA = 3.10%
CAU = 0.50; AA = 1.60
CAU = 12.80; AA = 12.40
NR
SFT (Katch and McArdle 1973)
CAU = –0.62; AA = –4.80
CAU = 5.21; AA = 3.74
NR CAU = 4.50%;
AA = 4.90%
CAU = 9.70; AA = –7.80
CAU = 18.40; AA = 19.50
NR
Wong
et al.2 114F CAU and AA 12.7 to ± 1.9
13.5 ± 1.7
23.7% 4C (Boileau
et al. 1985)
Electrical conductivity
TOBEC equation 1 CAU = 0.88;
AA = 0.78
CAU = 3.40; AA = 5.64
CAU = 0.72; AA = 0.81
CAU = 3.90%; AA = 2.90%
CAU = 0.60; AA = 0.30
CAU = 16.00; AA = 13.10
CAU = 0.06; AA = 0.30
TOBEC equation 2 CAU = 1.32;
AA = 0.85
CAU = 1.94; AA = 14.79
CAU = 0.48; AA = 0.64
CAU=10.20%;
AA=4.80%
CAU = 23.00; AA = 11.20
CAU = 46.10; AA = 22.40
CAU = 0.69; AA = 0.11
Wong et al.3
141F CAU, AA,
HIS and ASI
9 to 17 24.0% 4C (Boileau
et al. 1985)
DXA 0.95 5.08 0.81 3.30% 3.90 13.40 NR
3C, three-compartment model; 4C, four-compartment model; AA, African-American; ADP, air displacement plethysmography; ANT, anthropometry; ASI, Asian; BIA, bioelectrical impedance analysis; CAU, Caucasian; DXA, dual energy X-ray absorptiometry;
F, female; HIS, Hispanic; HW, hydrostatic weighing; LA, limits of agreement; M, male; NO, non-obese; NOB, non-obese boys; NOG, non-obese girls; NR, not reported; OG, obese girls; pp, percentage points; O, obese; OB, obese boys; RBF, relative body fat measured by the reference method; SEE, standard error of estimate; SFT, skinfold thickness;
T, total;
TR + MC, skinfolds of the triceps + medial calf region;
TR + SS, skinfolds of triceps and subscapular regions;
TOBEC, total body electrical conductivity. * 4C alternative method.
different components of body composition, whether regarding the sample, methods and techniques used, or the treatment of information. Thus, when analyzing the data available in the literature, it is essential to verify the method used, the quality of measurements, and the statistical analysis employed for data treatment. In this sense, the statistical procedures most often used for this purpose have historically been Student’s
t-test and coefficients of correlation (r) and determination (R2). However, the main researchers in the field of body
composition have shown that these methods, when used alone, do not appear sufficient to discriminate the quality of the measurements, especially because they do not allow for any inference about the agreement of individual values. Therefore, the method should be submitted to an analysis, not only within the set of values, but also on the basis of individual assessment, so that clinical decision-making can be safer in different situations.
All the studies that met the inclusion criteria of this review used the analysis of agreement proposed by Bland and Altman.10 However, although all bias values were identified
(mean difference between the scores of the investigated method and the reference method), limits of agreement and trend analysis could not be extracted from all studies due to the lack of information or data inaccuracy. Therefore, the importance of presenting all parameters of this analysis for better understanding and interpretation of results is highlighted.
The Bland and Altman plotting method10 has been used
to assess agreement between two methods employed to measure the same data (same measurement unit). This analysis allows for the comparison of the magnitude of the differences between the scores of the two methods, and whether the difference between the means is related to intersubject variations. Another important advantage is the possibility to verify this association in each individual that comprises the sample. This difference indicates the average discrepancy between the two methods. Obviously, the bias is expected to be low, the limits of agreement relatively low, and the trend not confirmed (r values close to zero), showing low inter-subject variability.
Regarding regression analyses, eight studies showed R2 values and seven had intercept and slope values. The
expectation of regression analysis is that the values of the intercept and slope fit the characteristics close to the so-called line of identity (intercept = 0 and slope = 1), that the coefficient of determination (R2) is high, and that the standard error of
estimate is reduced.
Dual energy X-ray absorptiometry
Among all methods for estimating body fat in healthy children and adolescents, the most tested in the analyzed studies was DXA (58.3%). In general, this method appears to underestimate
RBF3,8,12-16 when compared to the multi-compartment
methods. However, no statistically significant difference was observed in any of the investigations.7 The bias in the
estimate of RBF by DXA may be partly explained by the assumption of constant values for FFM hydration (73.2%),
which can range from 67% to 85%,17 mainly according to
individual characteristics and biological maturation phase. Thus, the higher the values of body hydration, the higher the overestimation of RBF values. It is noteworthy that the criterion values for body water may vary according to the equipment manufacturer. Thus, FM is an important intervening factor in the bias magnitude, as it tends to be overestimated in fatter individuals14-16 and underestimated
in thinner ones.12,14,16
Moreover, the amount of FM and FFM may also influence the bias due to differences in tissue thickness.18 In this
sense, deep tissues (> 20-25 cm) result in an increase in the attenuation of low-energy photons and can lead to an overestimation of body fat.19 Although some studies have
reported that this bias may also be related to sex and stage of sexual maturation,8,15,16 other studies have not confirmed
this hypothesis for gender,13-15 sexual maturation,3,14 or even
ethnicity.3,14
This conflicting information may be associated with important methodological differences between the studies, such as the type and size of the selected sample, as well as the instruments used, as equipment produced by different manufacturers use different algorithms to convert the radiographic information into of body fat values, and additionally, some devices do not have specific algorithms for young populations. Furthermore, the precision can also vary if the beams are emitted in the form of pencil or fan.20 Thus, generally speaking, when compared to the
4C model, it has been observed that DXA shows high LA, which, when added to the bias, especially when analyzing individuals with extreme fat percentage, limits its validity in the assessment of body fat in children and adolescents, thus requiring caution in its use.
Isotope dilution
The second most commonly used method in the validation studies analyzed was isotope dilution (deuterium or oxygen-18). Of the studies selected in this review, five compared the results obtained by isotope dilution with the 4C model. Of these, four found good estimates of FM,7,9,13,21
and only one had an unfavorable outcome.12 In the latter,
Fields and Goran12 assessed children of different ethnicities
and observed a tendency to underestimate body fat in leaner individuals and overestimate in fatter individuals. However, the sample had a lower body hydration value when compared to other studies, which may have caused errors in the constants used by the method, thus contributing to the finding of biased RBF values. Therefore, in spite of the reduced number of studies, the use of isotope dilution, when compared to 4C models, was shown to be reliable for the assessment of body fat in young individuals.
Hydrostatic weighing
The HW method was tested in only three7,8,12 of the
REV ASSOC MED BRAS. 2013;59(5):475-486
483
HW as a measure of body volume/density for the multi-compartment models. The estimate of body fat by this method is based on the measurement of body density to discriminate the components of body composition. In this sense, there are different equations to estimate RBF from body density. Two equations are frequently used for this purpose, that of Brozek et al.22 and that of Siri.23 However,
both equations were obtained from samples comprising adults, and therefore, they assume constant values for FM (0.9007 g/cm3) and FFM (1.100 g/cm3) densities that are not
accurate, particularly during the processes of growth and sexual maturation.1
Another important limitation is the assumption that the FFM components are equally distributed and have similar densities in different populations. In this sense, Lohman24 proposed an adaptation in the constants of the
formula of Siri,23 according to age and sex, and the results
were more reliable.13
In the present study, it was observed that different equations to estimate RBF based on body density were used, and Lohman’s25 equation was most frequently used (two
studies). Overall, it was observed that equations developed in adults showed less reliable estimates. However, even when using an equation adapted for the age group,25 it was
not possible to establish a pattern of behavior, and, although both studies showed a negative bias (criterion – alternative), Fields and Goran12 identified a tendency to underestimate in
individuals with higher RBF and overestimate in leaner peers, while Wells et al.7 did not observe any indications regarding
this effect.
The small number of validation studies on HW in children and adolescents can be explained, at least partially, by the fact that several researchers still consider it the gold standard for measuring body fat.
Air displacement plethysmography
Of the selected articles, five used ADP, all through the BOD POD® – Body Composition Tracking System – plethysmographic
chamber. Among them, only two12,13 aimed to verify the
validity of this method, while others used the measurement of body volume/density in the multi-compartment models. ADP, although a more expensive method when compared to HW, eliminates the discomfort of submersion in water, and requires less cooperation of the evaluated individual. These characteristics have made ADP gradually gain more interest, especially in studies with pediatric populations.
As in the HW method, the equation most often used to estimate RBF was that by Lohman.25 As expected, the
most important bias was observed in the generalized equation.23 Estimates based on Lohman’s equation25 did
not differ from the line of identity, presented low standard errors of estimate and reduced biases, and did not appear to be affected by body fat levels or sex. Thus, it is suggested that plethysmography, when the standard procedures and specific equation are followed, can be a reliable method for the measurement of body fat in children and adolescents. However, it is worth mentioning that only two studies
verified this finding. Thus, although the preliminary results are promising, further studies with representative samples are needed.
Bioelectrical impedance analysis
The estimation of body fat by the BIA method was compared to the 4C model in three7-9 of the analyzed studies. This
method provided the least satisfactory assessment of RBF, when compared to other methods tested. Many equations inappropriately estimate RBF, both individually and in groups.26-30 The major confounders in the analysis of data
obtained from this method are the amount of body fat,9 sex,
and sexual maturation.8 In general, the equations overestimate
RBF in lean subjects and underestimate it in fatter individuals. One explanation for this problem are the characteristics of the method.
BIA was developed to estimate body water based on the data provided by the impedance of an electric current. Therefore, the data suggest that, with the increased amount of body fat, the electrical conductivity is systematically changed, as the FM has lower hydration than the FFM. Additionally, other factors can affect the quality of results, among which are the level of hydration, skin temperature, time of collection, menstrual cycle, and the presence of metal objects close to the body.1 Therefore, although it is a simple, easy to use, and
low-cost method, BIA apparently does not provide a good estimate of body fat in young individuals. However, the most often accepted equations appeas to be that of Bray et al.31 and
that of Schaefer et al.32
Total body electrical conductivity
The body fat assessment method based on different levels of electrical conductivity in tissues, known as TOBEC, was compared to the 4C model in only one study. Wong et al.,2 when testing two equations for predicting FFM in girls
based on TOBEC data, one based on a quadratic model and the other in a linear model, observed better indicators of validity (bias, SEE, and LA) in the former. However, it is an incipient method and requires a larger number of studies.
Skinfold thickness
The SFT method was compared with the 4C model for estimating body fat in four studies. In these, 12 different predictive equations were tested, eight of which were developed in young individuals, and only one33 was based
on the 4C model. These characteristics probably contributed to the fact that the equation of Slaughter et al.33 was the
only one present in all four studies. This equation has two models: one that uses the triceps and subscapular folds (TR + SS), and another that replaces the subscapular skinfold with the medial calf (TR + MC).
Roemmich et al.8 compared both equations with the
although the TR + SS equation presented better results. The TR + MC equation was shown to be more influenced by body adiposity, in which the predictions tended to be worse in fatter individuals. Furthermore, the trend analysis also showed sex as a potential confounder regarding data interpretation. The TR + MC equation overestimated RBF more often in boys than in girls, while the equation TR + SS tended to underestimate RBF in girls and overestimate it in boys.
Wong et al.,4 when testing eight predictive equations in
girls, observed that the equation of Slaughter et al.33 (TR + SS)
showed the highest validity (relative bias = 0.1%), although the equation of Jackson et al.34 was the most accurate (SEE = 4.5%),
but it underestimated RBF. Additionally, both showed no tendency to data distortion with RBF variation, indicating that despite the low accuracy, the equation by Slaughter et al.33
can be considered a good alternative for this population. It is noteworthy that, in addition to having been developed specifically for young populations, this equation uses only two skinfolds, which makes it simpler and less error-prone when compared to that of Jackson et al.,34 which uses four skin folds
and one circumference measure.
In general, it was observed that some predictive equations tend to underestimate RBF,4,7,9 whereas others tend to
overestimate.4,8,9 The estimation of body fat by SFT is widely
used in clinical practice and population studies; however, this method is one of the most susceptible to measurement errors, such as the indiscriminate use of equipment from different manufacturers, often without proper calibration, as well as the fact that it critically depends on the skill and experience of the examiner.35,36 The bias of this method also
depends on the level of body fat (difficulty in performing the measurement), and it is not specifically indicated for obese individuals. Moreover, another limitation to be considered is that the prediction equations use FFM density as the constant; however, it tends to differ among ethnic groups, and change with age.
Over the years, several SFT-based equations were developed to predict RBF. These equations can be generalized, when developed from population studies with heterogeneous groups, or specific, when they are based on studies of homogeneous groups. In theory, generalized equations can be used in all types of individuals, but the results are not as accurate as would be desired. Regarding specific equations, they should only be used in individuals or groups that have very similar characteristics to those of the population for which they were developed. When this is not taken into account, a great variability in the results with the different equations is observed.24,25 Thus, to
prevent marked errors, it is very important, when choosing an equation, to ascertain what kind of population the equation was designed: men, women, children, young adults, elderly, active individuals, athletes, etc.35,36
The data obtained indicates the existence of a few SFT equations that are appropriate to estimate the RBF in children and adolescents. Thus, new equations must be developed and validated using reference methods as the gold standard, considering ethnicity, sex, and chronological and biological age, as well as the specific densities of the components of the MLG.
Final considerations
To the best of the authors’ knowledge, this is the first syste-matic review of the validity of methods for assessing body fat in children and adolescents. In the present study, only 12 articles were selected.
Considering the existence of a wide range of methods and the importance of assessing body fat in this population, there are a limited number of studies in the literature. This finding can be explained by the use of the 4C-model as the criterion for study selection, which limited the inclusion of several validation studies of weaker methods. Many studies use DXA- or HW-criterion methods.37 However, based on the
information of this review, caution should be exercised in using these methods, both in assessment and in their use as the gold standard for the validation of alternative methods for estimating body fat in young individuals.
The 4C model is recognized as the gold standard for the assessment of body composition at the tissue level. This model is developed by using the reference methods for each component of body composition, allowing for the isolation and identification of body fat. Nevertheless, most of the regression equations of multi-compartment models were developed in adult individuals, which limits their use in young individuals.9 In the studies that comprised this review, there
was concern regarding the use of specific models. Of the six 4C models used as reference measures, four were developed in adolescents. However, in addition to the concern with the models, measurement errors (intra- and inter-observer, inter-equipment, and inter-laboratory) must be carefully controlled.
Based on the analyzed data, it was observed that, among the currently used laboratory methods to estimate body fat in children and adolescents, isotope dilution and plethysmography methods are the most reliable. Among the methods that are more applicable in clinical practice or population-based studies, the equation of Slaughter et al.,33
which uses the TR +SS and considers ethnicity and sexual maturation stage, is suggested. According to the results, thus far no equation for BIA has satisfactorily predicted body fat in young individuals and, therefore, this method is not recommended for this population. Finally, it is suggested that further studies should be performed and that, within the limitations of the methods, alternative model adjustments should be made in order to minimize analysis biases, as well as to avoid the tendency toward deviation of estimates in certain population groups.
Aknowledgments
REV ASSOC MED BRAS. 2013;59(5):475-486
485
Conflicts of interest
The authors declare no conflicts of interest.
R E F E R E N C E S
1. Malina RM. Body composition in athletes: assessment and estimated fatness. Clin Sports Med. 2007;26:37-68.
2. Wong WW, Stuff JE, Butte NF, Smith EO, Ellis KJ. Estimation of body fat in Caucasian and African-American girls: total-body electrical conductivity methodology versus a four-component model. Int J Obes Relat Metab Disord. 2000;24:1200-6.
3. Wong WW, Hergenroeder AC, Stuff JE, Butte NF, Smith EO, Ellis KJ. Evaluating body fat in girls and female adolescents: advantages and disadvantages of dual-energy X-ray absorptio-metry. Am J Clin Nutr. 2002;76:384-9.
4. Wong WW, Stuff JE, Butte NF, Smith EO, Ellis KJ. Estimating body fat in African American and white adolescent girls: a comparison of skinfold-thickness equations with a 4-compartment criterion model. Am J Clin Nutr. 2000;72:348-54. 5. Fuller NJ, Jebb SA, Laskey MA, Coward WA, Elia M.
Four-component model for the assessment of body composition in humans: comparison with alternative methods, and evaluation of the density and hydration of fat-free mass. Clin Sci. 1992;82:687-93.
6. Boileau RA, Lohman TG, Slaughter MH. Exercise and body composition of children and youth. Scand J Sports Sci. 1985; 7:17-27.
7. Wells JC, Fuller NJ, Dewit O, Fewtrell MS, Elia M, Cole TJ. Four-component model of body composition in children: density and hydration of fat-free mass and comparison with simpler models. Am J Clin Nutr. 1999;69:904-12.
8. Roemmich JN, Clark PA, Weltman A, Rogol AD. Alterations in growth and body composition during puberty. I. Comparing multicompartment body composition models. J Appl Physiol. 1997;83:927-35.
9. Bray GA, DeLany JP, Volaufova J, Harsha DW, Champagne C. Prediction of body fat in 12-y-old African American and white children: evaluation of methods. Am J Clin Nutr. 2002;76: 980-90.
10. Bland JM, Altman DG. Statistical methods for assessing agreement between two methods of clinical measurement. Lancet. 1986;1:307-10.
11. Lohman TG. Advances in body composition assessment. Champaign: Human Kinetics; 1992.
12. Fields DA, Goran MI. Body composition techniques and the four-compartment model in children. J Appl Physiol. 2000;89: 613-20.
13. Gately PJ, Radley D, Cooke CB, Carroll S, Oldroyd B, Truscott JG, et al. Comparison of body composition methods in overweight and obese children. J Appl Physiol. 2003;95:2039-46.
14. Sopher AB, Thornton JC, Wang J, Pierson RN, Jr., Heymsfield SB, Horlick M. Measurement of percentage of body fat in 411 children and adolescents: a comparison of dual-energy X-ray absorptiometry with a four-compartment model. Pediatrics. 2004;113:1285-90.
15. Wells JC, Haroun D, Williams JE, Wilson C, Darch T, Viner RM, et al. Evaluation of DXA against the four-component model of body composition in obese children and adolescents aged 5-21 years. Int J Obes (Lond). 2010;34:649-55.
16. Williams JE, Wells JC, Wilson CM, Haroun D, Lucas A, Fewtrell MS. Evaluation of Lunar Prodigy dual-energy X-ray absorptiometry for assessing body composition in healthy persons and patients by comparison with the criterion 4-component model. Am J Clin Nutr. 2006;83:1047-54.
17. Helba M, Binkovitz LA. Pediatric body composition analysis with dual-energy X-ray absorptiometry. Pediatr Radiol. 2009;39: 647-56.
18. Laskey MA. Dual-energy X-ray absorptiometry and body composition. Nutrition. 1996;12:45-51.
19. Jebb SA, Goldberg GR, Elia M. DXA measurements of fat and bone mineral density in relation to depth and adiposity. Basic Life Sci. 1993;60:115-9.
20. Tylavsky F, Lohman T, Blunt BA, Schoeller DA, Fuerst T, Cauley JA, et al. QDR 4500A DXA overestimates fat-free mass compared with criterion methods. J Appl Physiol. 2003;94:959-65. 21. Ramirez E, Valencia ME, Moya-Camarena SY, Aleman-Mateo
H, Mendez RO. Four-compartment model and validation of deuterium dilution technique to estimate fat-free mass in Mexican youth. Nutrition. 2009;25:194-9.
22. Brozek J, Grande F, Anderson JT, Keys A. Densitometric analysis of body composition: revision of some quantitative assumptions. Ann N Y Acad Sci. 1963;110:113-40.
23. Siri WE. Body composition from fluid spaces and density: analysis of methods. In: Brozek J, Henschel A, editors. Techni-ques for measuring body composition. Washington: National Academy of Science; 1961. p. 223-44.
24. Lohman TG. Applicability of body composition techniques and constants for children and youths. Exerc Sport Sci Rev. 1986; 14:325-57.
25. Lohman TG. Assessment of body composition in children. Pediatr Exerc Sci. 1989;1:19-30.
26. Boileau RA, Lohman TG, Slaughter MH, Ball TE, Going SB, Hendrix MK. Hydration of the fat-free body in children during maturation. Hum Biol. 1984;56:651-66.
27. Davies PS, Preece MA, Hicks CJ, Halliday D. The prediction of total body water using bioelectrical impedance in children and adolescents. Ann Hum Biol. 1988;15:237-40.
28. Goran MI, Kaskoun MC, Carpenter WH, Poehlman ET, Ravussin E, Fontvieille AM. Estimating body composition of young children by using bioelectrical resistance. J Appl Physiol. 1993;75:1776-80.
29. Houtkooper LB, Going SB, Lohman TG, Roche AF, Van Loan M. Bioelectrical impedance estimation of fat-free body mass in children and youth: a cross-validation study. J Appl Physiol. 1992;72:366-73.
30. Suprasongsin C, Kalhan S, Arslanian S. Determination of body composition in children and adolescents: validation of bioelectrical impedance with isotope dilution technique. J Pediatr Endocrinol Metab. 1995;8:103-9.
31. Bray GA, DeLany JP, Harsha DW, Volaufova J, Champagne CC. Evaluation of body fat in fatter and leaner 10-y-old African American and white children: the Baton Rouge Children’s Study. Am J Clin Nutr. 2001;73:687-702.
32. Schaefer F, Georgi M, Zieger A, Scharer K. Usefulness of bioelectric impedance and skinfold measurements in predicting fat-free mass derived from total body potassium in children. Pediatr Res. 1994;35:617-24.
33. Slaughter MH, Lohman TG, Boileau RA, Horswill CA, Stillman RJ, Van Loan MD, et al. Skinfold equations for estimation of body fatness in children and youth. Hum Biol. 1988;60: 709-23.
35. Cyrino ES, Okano AH, Glaner MF, Romanzini M, Gobbo LA, et al. Impact of the use of different skinfold calipers for the analysis of the body composition. Rev Bras Med Esporte. 2003;9:150-3. 36. Okano AH, Carvalho FO, Cyrino ES, Gobbo LA, Romanzini M, Glaner MF, et al. Utilização do adipômetro CESCORF para
estimativa da gordura corporal relativa a partir de equações vali-dadas com o adipômetro Lange. Rev Educ Fís/UEM. 2008;19:431-6. 37. Sant’Anna MSL, Priore SE, Franceschini SCC. Métodos de