Development of a thermoelectric generator for the exhaust of a vehicle
Texto
Imagem
![Figure 1.1- Comparison of CO 2 targets for the EU and other countries [2].](https://thumb-eu.123doks.com/thumbv2/123dok_br/17613050.820415/29.892.236.657.537.786/figure-comparison-targets-eu-countries.webp)
![Figure 2.4- Figure of merit ZT for common TE materials, as a function of temperature [28]](https://thumb-eu.123doks.com/thumbv2/123dok_br/17613050.820415/40.892.221.674.108.470/figure-figure-merit-zt-common-materials-function-temperature.webp)
![Figure 2.9- Maximum output power in function of the hot side temperature with different thermoelectric materials [23] [51]](https://thumb-eu.123doks.com/thumbv2/123dok_br/17613050.820415/47.892.265.634.112.357/figure-maximum-output-function-temperature-different-thermoelectric-materials.webp)
![Figure 2.13- Representation of the TEG installed in the exhaust system of a Chevrolet Suburban, composed by skutterudites and BiTe modules [59] [60]](https://thumb-eu.123doks.com/thumbv2/123dok_br/17613050.820415/49.892.137.767.441.622/figure-representation-installed-exhaust-chevrolet-suburban-composed-skutterudites.webp)
![Figure 2.16- Advancement in the figure of merit ZT along the years [41].](https://thumb-eu.123doks.com/thumbv2/123dok_br/17613050.820415/51.892.268.619.218.538/figure-advancement-figure-merit-zt-years.webp)
![Figure 3.6- The velocity profiles for the law of the wall and for the logarithmic law with experimental data (adapted from [77])](https://thumb-eu.123doks.com/thumbv2/123dok_br/17613050.820415/62.892.236.652.851.1099/figure-velocity-profiles-wall-logarithmic-experimental-data-adapted.webp)
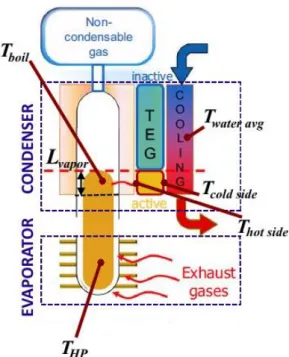
![Figure 4.1- Generator Concept used as reference geometry in the calculations (adapted from [17])](https://thumb-eu.123doks.com/thumbv2/123dok_br/17613050.820415/69.892.236.662.362.947/figure-generator-concept-used-reference-geometry-calculations-adapted.webp)
Documentos relacionados
Ousasse apontar algumas hipóteses para a solução desse problema público a partir do exposto dos autores usados como base para fundamentação teórica, da análise dos dados
A infestação da praga foi medida mediante a contagem de castanhas com orificio de saída do adulto, aberto pela larva no final do seu desenvolvimento, na parte distal da castanha,
Você poderia dizer que a razão maior do porque pessoas procuram um trabalho vocal é porque eles querem “cantar” – e esse desejo de cantar, vem também porque frequente-
i) A condutividade da matriz vítrea diminui com o aumento do tempo de tratamento térmico (Fig.. 241 pequena quantidade de cristais existentes na amostra já provoca um efeito
Isto é, o multilateralismo, em nível regional, só pode ser construído a partir de uma agenda dos países latino-americanos que leve em consideração os problemas (mas não as
didático e resolva as listas de exercícios (disponíveis no Classroom) referentes às obras de Carlos Drummond de Andrade, João Guimarães Rosa, Machado de Assis,
Isto mostra que mesmo a Linhaça possuindo mucilagens e fibras alimentares em sua composição, que de acordo com Alves (2003) são reguladores do apetite, não
É uma ramificação da ginástica que possui infinitas possibilidades de movimentos corporais combinados aos elementos de balé e dança teatral, realizados fluentemente em
