Bayesian inference in a quantitative genetic study of growth traits
in Nelore cattle (
Bos indicus
)
Carina Ubirajara de Faria
1, Cláudio de Ulhôa Magnabosco
2, Arcadio de los Reyes
3,
Raysildo Barbosa Lôbo
1, Luiz Antônio Framartino Bezerra
4and Roberto Daniel Sainz
51
Universidade para o Desenvolvimento do Estado e da Região do Pantanal, Campo Grande, MS, Brazil.
2Embrapa Cerrados/Arroz e Feijão, Planaltina, DF, Brazil.
3
Departamento de Produção Animal, Faculdade de Medicina Veterinária, Universidade Federal de Goiás,
Goiânia, GO, Brazil.
4Departamento de Genética, Faculdade de Medicina de Ribeirão Preto, Universidade de São Paulo,
Ribeirão Preto, SP, Brazil.
5
Animal Science Department, University of California, Davis, USA.
Abstract
The objective of this study was to estimate (co)variance components and genetic parameters for weights (W) and scrotal circumferences (SC) at 365 and 450 days of age, of Nelore (Bos indicus) cattle, using Bayesian inference in single and multiple-trait animal models. The fitted linear models included, besides the animal and residual random ef-fects, the contemporary group (herd-year-season-sex-management group) and age-of-dam as “fixed effects”. The analyses were carried out using a Gibbs sampler implemented through the MTGSAM program. The heritabilities (in parentheses) obtained fitting single-trait models were W365(0.49), W450(0.52), SC365(0.68) and SC450(0.66). Estimates
of means, modes and medians for genetic parameters obtained from marginal posterior distributions were similar for all traits. The W365and SC365can be considered as suitable traits to be included as selection criteria in genetic
im-provement programs, not only because of their relatively high heritabilities but also due to the fact that they can be measured when the animals are relatively young compared to the corresponding traits W450and SC450. The Bayesian
approach appears to be an appropriate alternative for estimating genetic parameters, and has the advantage over point estimation methods of allowing inferences on marginal posterior distributions.
Key words:Bayesian inference, growth traits, genetic parameters.
Received: May 22, 2006; Accepted: January 22, 2007.
Introduction
As markets become more and more competitive and globalized, efficiency becomes a basic condition for any sector. In Brazil, the beef cattle industry is one of the most important segments of the national agribusiness, with an annual turnover of more than three billion dollars.
With reference to beef cattle, it is important to empha-size that zebu cattle (Bos indicus) today represents about 80% of the Brazilian herd. Additionally, as observed by Eleret al.(1996), more than 70% of zebu cattle are of the Nelore breed because, at least in part, of their adaptability to tropical conditions and their high fertility. Nelore cattle exhibit great differences in performance according to re-gion and cattle raising practices, and these differences are
not only related to environmental effects but also due to the genetic make up of the population. These variations can be considered as indicative of the potential for genetic im-provement through selection. Thus, Nelore breed effi-ciency improvement becomes a basic condition for increas-ing livestock productivity in Brazil.
The Nelore Breed Genetic Improvement Program (Programa de Melhoramento Genético da Raça Nelore, PMGRN), seewww.ancp.org.br, has as one of its major goals the genetic improvement of the growth, carcass and fertility traits of Nelore cattle. This program was developed and conducted by the National Association of Breeders and Researchers, and hosted at the Department of Genetics of the College of Medicine of the University of São Paulo, Ribeirão Preto Campus, Ribeirão Preto, São Paulo state, Brazil. To achieve the genetic improvement objectives, the PMGRN relies on sound data collection and processing schemes, including the application of classical genetic
Send correspondence to Carina Ubirajara de Faria. Avenida Mar-cos de Freitas Costa 897, Daniel Fonseca, Uberlândia, 38400328 MG, Brazil. E-mail: [email protected].
evaluation procedures. Most genetic evaluations in animal populations are based on mixed (mainly linear) model methodology and best linear unbiased predictor (BLUP) theory (Henderson, 1984), which require good estimates of (co)variance components among the traits for which indi-vidual animals are evaluated. These components need to be correctly estimated, so that predicted expected progeny dif-ferences (EPD) can serve as an effective instrument for genetic improvement purposes. Additionally, accurate esti-mates of (co)variance components is important to animal breeding due to the fact that prediction error variances for predicted breeding values increase as estimated values de-viate from true values (Henderson, 1975).
Due to their importance, not only to genetics, but also to other areas of knowledge, several statistical methods of (co)variance estimates have been proposed throughout the years. More recently, the introduction of computer inten-sive statistical methods and the increasing adoption of Bayesian approaches and techniques, generally referred to as Markov Chain Monte Carlo (MCMC) methods, has been favored. In this respect, Gibbs sampling (GS) is a Monte Carlo numerical integration method that allows inferences to be made about joint or marginal distributions, even if ap-propriate densities cannot be explicitly formed (Geman and Geman, 1984). The use of GS allows analysis of Bayesian posterior distributions that had been computationally in-tractable due to the numerical integration required to obtain those distributions. The method presents properties of in-terest for animal improvement and extensive statistical resources capable of supplying more and more accurate es-timates.
The objective of the study described in this paper was to apply the Gibbs sampling method for (co)variance com-ponents and the estimation of genetic parameters to growth and scrotal circumference traits using field data from Nelo-re cattle.
Material and Method
We used data and pedigree information from 69,025 Nelore cattle (Bos indicus) from distinct herds participating in the PMGRN. In general, the cattle were raised on pasture in various regions of Brazil, where the predominant climate ranges from subtropical hot humid to tropical hot humid, with two distinct seasons, one dry and the other rainy. The traits studied were weights (W) and scrotal circumferences (SC) at 365 (W365and SC365) and 450 (W450and SC450) days of age. The contemporary groups consisted of the herd-year-season-sex-management group. Birth seasons were divided into four periods: January to March, April to June, July to September and October to December. Age-of-dam effects were grouped into six classes: = 3, 4, 5, 6, 7-10 and = 11 years of age at calving.
The original data were edited using the Statistical Analysis System software (SAS, 1996), with preliminary analyses for general file consistency. The variance
compo-nents necessary for the estimation of genetic parameters were obtained by the Gibbs sampling method, with the ap-plication of the “Multiple Trait using Gibbs Sampler under Animal Model, or MTGSAM program (Van Tassel and Van Vleck, 1996).
The analyses were conducted by fitting single and two-trait animal models. The general mixed linear model, in matrix notation, was:
y=Xβ+Zu+e
whereyis a vector of observations,XandZare known inci-dence matrices relatingβandu, respectively,βis a fixed ef-fects vector,uis a random vector of additive genetic effects andeis a random vector of residuals.
From these definitions, it is considered that:
E[ ]γ =Xβ and Var[ ] Z Z'γ = Σ +R
withΣ= var (u) =Aσa 2
andR=Iσe 2
in the single-trait model, where:σa
2
andσe 2
are additive genetic and residual vari-ances, respectively;Ais the numerator relationship matrix among animals andIis the appropriate identity matrix. Dis-tributional assumptions wereu~N(0,Aσa
2
) ande~N(0, A
σe
2
), respectively. In the two-trait model, Σ = ⊗G A and R= ⊗I R+
, whereGis the matrix of additive genetic ef-fects for the two-trait; andR+is matrix of residuals for the traits measured in each animal.
Prior distributions for the (co)variances were esti-mated from an inverted Wishart (IW) distribution for ani-mal genetic and residual effects of traits (Van Tassel and Van Vleck, 1996). If a random variable,W, is an IW ran-dom variable, then the probability density function ofWis:
p W v V( , )∝K v V( , )W (v m )exp⎛tr⎛⎝⎜− V W ⎞⎠⎟
⎝ ⎜
−1 −1 + + − −
2 1 1 1 1
2
⎞ ⎠
⎟.
W,V> 0;v>m+ 1, where:
K v V V v vm m m v j
i m ( , − ) − ( −) = = ⎛ ⎛⎝⎜ − + ⎞⎠⎟ ⎝ ⎜
∏
1 1 1 2 1 2 1 4 1 1 2 1 2π Γ ⎞
⎠ ⎟ −1
As indicated above, several parameters are needed to model the density functions of the random variables. The parameter v is the degree of freedom corresponding to the Wishart random variable and the degree of belief for the prior distribution. The matrixVdescribes the (co)variance structure of the variableW, and m is the dimension ofV. The mean of W is V-1/v*, where V-1 = v*V0, V0 is the (co)variance matrix specified from prior information.
cycle thinning interval to obtain 1,800 samples of (co)vari-ance components and genetic parameters. The GS was im-plemented using a long chain scheme (Jensenet al., 1994; Sewalem and Johansson, 2000) and after burn-in one sam-ple was collected from every 100 samsam-ples to avoid possible correlation between consecutive samples. The Gibbsit pro-gram of Raftery and Lewis (1994) was used to evaluate burn-in for all (co)variance components and also to calcu-late the thinning interval to determine the frequency of retaining sampled values so that those samples are uncor-related for each parameter. The initial values used reflected no previous knowledge of the parameters.
Results and Discussion
The results obtained for the means, variation coeffi-cients and growth traits minimum and maximum in this study are described in Table 1. The fact that single-trait and two-trait analyses were used did not interfere with these preliminary results. This is because descriptive statistics is a tool for discovering and evaluating the quality and consis-tency of the information, so that (co)variance component estimation analyses can be started with confidence in the data file.
To obtain the (co)variance component and genetic pa-rameter estimates, the analyses were carried out using the long-chain scheme (Jensen et al., 1994; Sewalem and Johansson, 2000), with a view for evaluating the posterior distribution densities obtained from Gibbs chain samples. The results of variance component and heritability esti-mates for growth traits, obtained through GS in single-trait analyses are presented in Table 2.
The high heritabilities estimates obtained for all the traits considered in this study indicated the existence of considerable genetic potential for gains obtainable through selection (Eleret al., 1996). Indeed, the emphasis given to selection for growth in genetic improvement programs has most often provided substantial responses. The heritability estimates for weights and scrotal circumferences at 365 and 450 days were similar. The magnitude of the heritability es-timates for all traits can be considered sufficient to promote substantial genetic gains in the Nelore breed. In this study, the components of variance and heritability estimates ob-tained for growth traits using single-trait analyses were
consistent with analogous values reported in the literature (Gressleret al., 2000; Mercadante et al., 2000; Pereiraet al., 2000; Everlinget al., 2001).
Bayesian analyses allowed the estimation of the mar-ginal posterior densities of the genetic parameters, and with these densities it was possible to visualize the errors in the estimates of these parameters, making them more accurate (Gianolaet al., 1994). Table 2 presents standard deviations, Monte Carlo errors and, for the point estimates, the respec-tive means, modes and medians of the variance and heri-tability components of growth traits in single-trait analyses. It can be observed that, except for SC450, the mean, median and mode estimates for the variance components were sim-ilar, since for heritability values the measures of central ten-dency had identical values as expected in posterior distribu-tions classified as normal distribudistribu-tions. For the SC450value the mode of the heritability estimate was greater than the mean or median, although this difference was small. In re-lation to the Monte Carlo error (Table 2) the standard devia-tions were very small for all variance components and ge-netic parameters, which indicated that the size of the Gibbs
Table 1- Descriptive statistics for all variables included in the analyses.
Trait Number of
records (N)
Mean trait value
Coefficient of variation (%)
Minimum trait value
Maximum trait value
W365(kg) 37,004 220.17 16.35 93.00 378.00
W450(kg) 32,410 257.96 16.69 106.00 444.00
SC365(cm) 8,407 19.37 10.72 11.10 29.00
SC450(cm) 9,456 22.53 12.01 11.40 32.50
W365= weight at 365 days of age; W450= weight at 450 days of age; SC365= scrotal circumference at 365 days of age; SC450= scrotal circumference at 450 days of age.
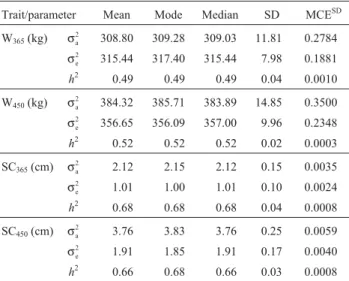
Table 2- Descriptive statistics for variance components and heritabilities estimates for weight at 365 (W365) and 450 (W450) and scrotal circumfer-ence at 365 (SC365) and 450 (SC450) days of age, obtained from single-trait analyses using Gibbs sampling.
Trait/parameter Mean Mode Median SD MCESD
W365(kg) σa 2
308.80 309.28 309.03 11.81 0.2784
σe 2
315.44 317.40 315.44 7.98 0.1881
h2 0.49 0.49 0.49 0.04 0.0010
W450(kg) σa 2
384.32 385.71 383.89 14.85 0.3500
σe 2
356.65 356.09 357.00 9.96 0.2348
h2 0.52 0.52 0.52 0.02 0.0003
SC365(cm) σa 2
2.12 2.15 2.12 0.15 0.0035
σe 2
1.01 1.00 1.01 0.10 0.0024
h2 0.68 0.68 0.68 0.04 0.0008
SC450(cm) σa 2
3.76 3.83 3.76 0.25 0.0059
σe
2 1.91 1.85 1.91 0.17 0.0040
h2 0.66 0.68 0.66 0.03 0.0008
σa 2
: additive genetic variance;σe 2
chain was sufficient to estimate reliable posterior means. The Monte Carlo error is the error in parameter estimation due to the number of samples used from the Gibbs chain (Van Tassel and Van Vleck, 1996), and is inversely propor-tional to the length of the Gibbs chain.
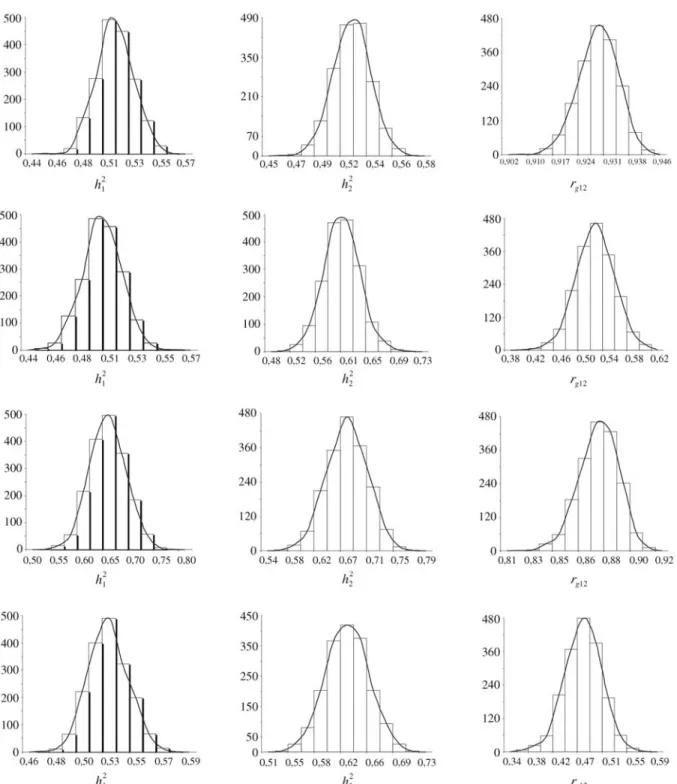
As shown in Figure 1, when the Gibbs sampling is correctly implemented the marginal posterior distributions
appear stable and tend toward normality (Blasco et al., 1998; Garcia Cortéset al., 1998; Sewalem and Johansson, 2000). These distributions are an important aspect of the Bayesian analysis, which provides an alternative of great flexibility in genetic analyses, due to the possibility of gen-erating more accurate estimates arising from marginal pos-terior distributions not possible with the usual Restricted
Figure 1- Histograms of posterior densities estimates of additive genetic variance (σa 2
), residual variance (σe 2
Maximum Likelihood (REML) methodology. Comparing the two methodologies and using Nelore field data, Mag-naboscoet al.(2000) reported that the Gibbs sampling esti-mates were greater than those obtained by REML, but with similar results to those of other previous studies on Nelore cattle (Mercadante et al., 2000; Everling et al., 2001). Resende (2000) reported that Bayesian inference estimates were more precise than REML estimates, and have the ad-vantage of producing standard deviations and confidence intervals for (co)variance components and genetic parame-ters as well as the marginal posterior densities. According to Blasco (2001), both Bayesian and Frequentist schools of inference are well established and it is not necessary to jus-tify why one or the other school is preferred.
Multi-trait analyses can explore inter-trait correla-tions while improving genetic prediction (Henderson, 1984). In our study we carried out two-trait analyses among growth traits, the (co)variance components and genetic pa-rameter estimates obtained being presented in Table 3. The estimates of heritability for the weights at 365 and 450 days of age in two-trait analyses were similar to those obtained with single-trait analyses (Tables 2 and 3). With respect to scrotal circumferences, the two-trait heritability values
were smaller than the single-trait estimates. The mean, mode and median values of (co)variance component esti-mates were similar, and genetic parameters were practi-cally identical (Table 3). This may be confirmed from the marginal posterior distributions shown in Figure 2, in which the measures of central tendency did not differ. The marginal posterior density distributions, classified as Gaus-sian, or normal, distributions were also unaltered. The stan-dard deviation of the Monte Carlo error was very small for all variance components and genetic parameters, indicating that the length of the Gibbs chain was sufficient to estimate reliable posterior means (Table 3).
Figure 2 also shows that the 365 day and 450 day heritability estimates were similar, with a genetic correla-tion of high magnitude. These results indicate that seleccorrela-tion for growth may be made at earlier ages, as with 365 day weight. However, Sarmentoet al.(2003) have argued that the further away from weaning then the more efficient se-lection has to be, because the performance would have a greater direct effect with decreasing influence of maternal effects. It is worth noting that, due to the need to identify earlier maturing and faster growing animals, this factor
Table 3- Descriptive statistics for variance components and heritabilities estimates for weight at 365 days of age (W365) and 450 (W450), scrotal circumference at 365 (SC365) and 450 (SC450) days of age based on two-trait analyses using Gibbs sampling.
Trait Variance components Genetic parameters
σa1
2 σ
a12 σa2
2 σ
e1
2 σ
e12 σe2
2 h
1
2 h
2
2 r
g12
W365
1
W450
2
Mean 317.30 325.53 389.33 311.05 254.59 368.48 0.50 0.51 0.93
Mode 316.90 321.19 384.28 313.90 251.09 365.69 0.50 0.52 0.93
Median 316.96 325.31 389.26 311.17 254.46 368.06 0.50 0.51 0.93
SD 12.14 12.56 14.92 8.15 8.24 9.75 0.01 0.01 0.005
MCESD 0.2862 0.2960 0.3518 0.1921 0.1942 0.2230 0.0003 0.0003 0.0003
W365
1
SC365
2 Mean 308.95 11.93 1.77 315.25 11.26 1.25 0.49 0.59 0.51
Mode 307.97 12.05 1.76 315.96 11.31 1.25 0.49 0.60 0.51
Median 308.74 11.91 1.78 315.32 11.28 1.25 0.49 0.59 0.51
SD 12.12 0.97 0.11 8.12 0.69 0.08 0.01 0.03 0.03
MCESD 0.2857 0.0228 0.0023 0.1914 0.0163 0.0018 0.0003 0.0006 0.0022
SC365
1
SC450
2 Mean 1.95 2.36 3.78 1.14 1.11 1.98 0.63 0.65 0.87
Mode 1.96 2.39 3.66 1.17 1.08 2.00 0.63 0.66 0.87
Median 1.95 2.36 3.76 1.14 1.11 1.98 0.63 0.65 0.87
SD 0.14 0.16 0.24 0.10 0.11 0.16 0.03 0.03 0.01
MCESD 0.0032 0.0037 0.0056 0.0022 0.0026 0.0039 0.0008 0.0007 0.0003
W450
1
SC450
2 Mean 384.62 16.27 3.34 356.48 14.24 2.12 0.52 0.61 0.45
Mode 384.32 16.26 3.24 357.67 14.23 2.09 0.52 0.60 0.45
Median 384.06 16.28 3.33 356.77 14.25 2.11 0.52 0.61 0.45
SD 15.21 1.44 0.20 10.07 1.01 0.14 0.02 0.03 0.03
MCESD 0.3584 0.0340 0.0047 0.2373 0.0237 0.0033 0.0003 0.0006 0.0007
σa1
2
: additive genetic variance of trait 1;σa12: additive genetic covariance between traits 1 and 2;σa2
2
: additive genetic variance of trait 2;σe1
2 : residual variance of trait 1;σe12: residual covariance between traits 1 and 2;σe2
2
: residual variance of trait 2;h1 2
:heritability of trait 1;h2 2
: heritability of trait 2;rg12:
would not be enough to exclude one year weight as a selec-tion criterion.
The genetic correlations between growth and scrotal circumference traits obtained in this study were of medium to high magnitude. Correlated responses in weights when selecting for scrotal circumference were considered by Everlinget al.(2001). Additionally, the genetic correlation obtained for 365 day weight and scrotal circumference was
greater than that found at 450 days of age, a result that also favors selection at 365 days. Similar results were reported by Gressleret al.(2000). As presented in Table 3, the ge-netic correlation estimate between the 365 and 450 days scrotal circumferences was 0.87, indicating that selection on one trait would be reflected directly on the progress of the other. Because of this and the fact that both traits pre-sented high heritabilities, selection for 365 day scrotal
cumference should be adopted (Gressleret al., 2000; Mer-cadanteet al., 2000; Pereiraet al., 2000).
In conclusion, the (co)variance components and ge-netic parameters estimates obtained in this study for growth traits were, in general, similar to most estimates found in the literature for Nelore cattle. For the 365 and 450 day scrotal circumferences, the results showed higher values than those generally reported in the literature, usually em-ploying Restricted Maximum Likelihood methodology. Bayesian inference showed to be an appropriate alternative for estimating (co)variance components and genetic param-eters. It provided reasonable estimates and greater flexibil-ity than the usual likelihood estimates, mainly because of the inferences obtained by employing the posterior mar-ginal distributions. The weight and scrotal circumference at 365 days of age may be considered advantageous as criteria for genetic selection compared to the corresponding traits measured at latter ages, not only because of the similar heritability estimates observed for the traits but because this methodology allows identification of superior geno-types in a shorter time.
Acknowledgments
We are grateful to the breeders participating in the Genetic Improvement Program of the Nelore Breed for pro-viding the data, especially to the National Association of Breeders and Researchers and the Genetics Department of the College of Medicine of the University of São Paulo, campus of Ribeirão Preto. Special thanks go to José Bene-dito de Freitas Trovo for his help in the revision of this manuscript. The first author has a scholarship from the Bra-zilian agency CNPq.
References
Blasco A (2001) The bayesian controversy in animal breeding. J Anim Sci 79:2023-2046.
Blasco A, Sorensen D and Bidanel JP (1998) Bayesian inference of genetic parameters and selection response for litter size components in pigs. Genetics 149:301-306.
Eler JP, Ferraz JBS and Silva PR (1996) Parâmetros genéticos para peso, avaliação visual e circunferência escrotal na raça Nelore estimados por modelo animal. Arq Bras Med Vet Zootec 48:203-213 (Abstract in English).
Everling DM, Ferreira GBB, Rorato PRN, Marion AE, Roso VM and Fernandes HD (2001) Estimativas de herdabilidade e correlação genética para características de crescimento na fase de pré-desmama medidas de perímetro escrotal ao so-breano em bovinos Angus-Nelore. Rev Bras Zootec 30:2002-2008 (Abstract in English).
Garcia-Cortés LA, Rico M and Groeneveld E (1998) Using cou-pling with the Gibbs sampler to assess convergence in ani-mal models. J Anim Sci 76:441-447.
Geman S and Geman D (1984) Stochastic relaxation, Gibbs distri-butions and the Bayesian restoration of images. IEEE Trans-actions on Pattern Analysis and Machine Intelligence. 6:721.
Gianola D, Rodriguez-Zaz S and Shook GE (1994) The Gibbs sampler in the animal model: A primer. In: Foulley JL and Molenat M (eds) Séminaire Modele Animal. INRA, La Colle sur Loup, pp 47-56.
Gressler SL, Bergmann JAG, Pereira CM, Penna VM, Pereira CS, Pereira JCC and Gressler MGM (2000) Estudo das associa-ções genéticas entre perímetro escrotal e características reprodutivas de fêmeas da raça Nelore. Arq Bras Med Vet Zootec 29:427-437 (Abstract in English).
Henderson CR (1975) Comparison of alternative sire evaluation methods. J Anim Sci 41:760-773.
Henderson CR (1984) Applications of Linear Models in Animal Breeding. University of Guelph, Ontario, 426 pp.
Jensen J, Wang CS, Sorensen DA and Gianola D (1994) Bayesian inference on variance and covariance components for traits influenced by maternal and direct genetic effects, using the Gibbs sampler. Acta Agric Scand 44:193.
Magnabosco CU, Lôbo RB and Famula TR (2000) Bayesian in-ference for genetic parameter estimation on growth traits for Nellore cattle in Brazil, using the Gibbs sampler. J Anim Breed Genet 117:169-188.
Mercadante MEZ, Lôbo RB and Oliveira HN (2000) Estimação de (co)variâncias entre características de reprodução e de crescimento em fêmeas de um rebanho Nelore. Rev Bras Zootec 29:997-1004 (Abstract in English).
Pereira E, Eler JP and Ferraz JBS (2000) Correlação genética en-tre perímetro escrotal e algumas características reprodutivas da raça Nelore. Rev Bras Zootec 29:1676-1683 (Abstract in English).
Raftery AE and Lewis SM (1994) Gibbsit version 2.0 Software, http://lib.stat.cmu.edu/general/gibbsit.
Resende MDV (2000) Inferência bayesiana e simulação estocás-tica na estimação de componentes de variância e valores genéticos em plantas perenes. Embrapa Florestas, Docu-mentos 46, 68 pp.
Sarmento JLR, Pimenta Filho EC, Ribeiro MN and Martins Filho R (2003) Efeitos ambientais e genéticos sobre o ganho em peso diário de bovinos Nelore no estado da Paraíba. Rev Bras Zootec 32:325-330 (Abstract in English).
SAS Institute Inc.SAS/STAT (1996) SAS User’s Guide for Win-dows Environment. 6.12 ed. Cary, SAS Institute Inc. Sewalem A and Johansson K (2000) Egg weight and reproduction
traits in laving hens: Estimation of direct and maternal ge-netic effects using Bayesian approach via Gibbs sampling. J Anim Sci 70:9-16.
Van Tassel CP and Van Vleck LD (1996) Multiple-trait Gibbs sampler for animal models: Flexible programs for Bayesian and likelihood-based (co)variance component inference. J Anim Sci 74:2586-2597.