Adaptability and tability of the zinc density in cowpea genotypes
through GGE-Biplot method
1Adaptabilidade e estabilidade da densidade de zinco em genótipos de feijão-caupi via
GGE-Biplot
Diêgo Sávio Vasconcelos de Oliveira2, Luis José Duarte Franco3, José Ângelo Nogueira de Menezes-Júnior3,
Kaesel Jackson Damasceno-Silva3, Maurisrael de Moura Rocha3*, Adão Cabral das Neves3 and Francisco Mauro
de Sousa3
ABSTRACT - Biofortification is a strategy that aims to improve the nutritional quality of foods through genetic breeding. Zinc is an important mineral for human health. It is used in various physiological processes such as immune function, antioxidant protection, growth and development. Therefore, zinc is one of the most studied minerals in the biofortification of grains in cowpea. The objective of this study was to evaluate the adaptability and stability of zinc density in the grain of 12 cowpea genotypes in four environments in the states of Piauí (PI) and Maranhão (MA), Brazil, by using the GGE-Biplot method. A randomized complete block design with four replications was used. Grain samples of each genotype were ground and the resulting flour was subjected to zinc density analysis by using an atomic flame absorption spectrophotometer. Analyses of variance were performed, and the adaptability and stability of zinc density in the grain was evaluated by the GGE-Biplot method. Genotypes showed different behavior depending on the environments tested for zinc concentration. According the GGE-Biplot method, Parnaiba-PI was the most discriminating environment for genotypes. Campo Grande do Piauí-PI and Parnaíba-PI were the most representative environments for selecting genotypes with zinc biofortification in the state of Piauí. Parnaíba-PI was the optimal environment for selection of genotypes adapted to high zinc density in grain. The cultivar BRS Xiquexique was the ideal genotype due to the high zinc density in the grain and high stability according to GGE-Biplot, followed by the lines MNC04-774F-78 and MNC04-782F-108.
Key words:Vigna unguiculata. Micronutrient. Biofortification. Genotype × environment interaction.
RESUMO - A biofortificação é uma estratégia que visa melhorar a qualidade nutricional dos alimentos via melhoramento genético. O zinco é um mineral importante para a saúde humana, por participar de vários processos fisiológicos, tais como função imune, defesa antioxidante, crescimento e desenvolvimento. Por isso, o zinco é um mineral bastante estudado na biofortificação do grão em feijão-caupi. Este trabalho objetivou avaliar a adaptabilidade e a estabilidade da densidade de zinco no grão de 12 genótipos de feijão-caupi em quatro ambientes nos estados do Piauí e Maranhão por meio da análise de GGE-Biplot. Adotou-se o delineamento de blocos completos casualizados com quatro repetições. Amostras de grãos de cada genótipo foram trituradas e as farinhas foram submetidas à análise da densidade de zinco em espectrofotômetro de absorção atômica de chama. Foram realizadas análises de variância e a adaptabilidade e estabilidade da densidade de zinco foram avaliadas via método GGE-Biplot. Os genótipos se comportaram diferencialmente com os ambientes de teste para a concentração de zinco. De acordo com a análise GGE-Biplot, o ambiente considerado mais discriminante em relação aos genótipos foi Parnaíba-PI. Campo Grande do Piauí-PI e Parnaíba-PI foram os ambientes mais representativos para seleção de genótipos biofortificados em zinco testado no Piauí. Parnaíba-PI foi o ambiente ideal para a seleção de genótipos adaptados à alta densidade de zinco no grão. A cultivar BRS Xiquexique foi considerada o genótipo ideal, por apresentar a maior concentração de zinco no grão e alta estabilidade conforme a análise GGE-Biplot, seguido das linhagens MNC04-774F-78 e MNC04-782F-108.
Palavras-chave:Vigna unguiculata. Micronutriente. Biofortificação. Interação genótipos x ambientes.
DOI: 10.5935/1806-6690.20170091 *Autor para correspondência
Recebido para publicação em 10/08/2016; aprovado em 24/11/2016
1Parte da Dissertação do primeiro autor apresentada ao Programa de Pós-Graduação em Alimentos e Nutrição, Departamento de Nutrição, Universidade
Federal do Piauí, Teresina-PI, Brasil; pesquisa financiada pelo Programa HarvestPlus
2Programa de Pós-Graduação em Alimentos e Nutrição, Departamento de Nutrição, Universidade Federal do Piauí, Teresina-PI, Brasil, diegosavio19@
hotmail.com
3Embrapa Meio-Norte, Teresina-PI, Brasil, [email protected], [email protected], [email protected],
INTRODUCTION
Zinc is an important mineral in various areas of the human body and is a cofactor in various enzymes and proteins. Zinc deficiency affects the immune system, and DNA synthesis; prevents combat of free radical formation; causes delayed growth and sexual maturation, hypogeusia, acrodermatitis enteropathica, alopecia, diarrhea, and rashes; and decreases appetite, and cognitive functions
(PEREIRAet al., 2011).
Sufficient amounts of zinc in the diet promotes immunity, resistance to infection, adequate growth, development of the nervous system, and is essential for a healthy pregnancy. Approximately 17.3% of the world’s population is at risk of zinc deficiency due to dietary inadequacy. Other estimates indicate that 25-33% of some populations in the world present inadequate zinc consumption and suffer from health problems due to the lack of zinc in their diet (HOTZ; BROWN, 2004; WESSELLS; BROWN, 2012).
Some solutions have been used to address these micronutrient deficiencies, such as fortification, enrichment, or addition of micronutrients in foods; this aims to increase nutrient concentration and to prevent nutritional deficiencies in the general population and more susceptible groups (VELLOZO; FISBERG, 2010).
Another way to combat these nutrient deficiencies is biofortification. This strategy consists of an increase in the concentration of nutrients by genetic breeding. Research has shown that biofortified foods are an alternative source for the low-income population to access nutritious food in a sustainable and low-cost way
(GONÇALVESet al., 2015).
The development of biofortified cowpea cultivars in iron and zinc is one of the objectives of the cowpea
breeding program (FREIRE FILHO et al., 2011). The
development of biofortified cultivars as a strategy to combat micronutrient deficiency has several stages: germplasm screening, selection of parents, crossings, obtaining of segregant populations, advancing generations, multi-local validation of lines, and release of the cultivar.
The cowpea biofortification program had initially concentrated its efforts on the screening of existing germplasm in the work collection, and then on accessions of the active germplasm bank, with emphasis on the iron and zinc concentrations in the grain, combined with yield and adaptability to the cultivation
regions (ROCHAet al., 2011a). The results have shown
considerable variability in the zinc concentrations in the
grain (DIAS-BARBOSA, 2015; MURANAKA et al.,
2016; ROCHAet al., 2008; ROCHAet al., 2011b).
In the final stage of a breeding program, the best lines are tested and validated in various environments. This allows an investigation of the magnitude of the genotype × environment interaction (G×E) as well as the
genotype’s adaptability and stability (HONGYU et al.,
2015; MURANAKAet al., 2016; SANTOSet al., 2015).
These studies are important because they assist the breeder when recommending cultivars to farmers.
There are several methodologies to evaluate the adaptability and stability of genotypes; those with a multivariate approach is used the most. Among the most commonly used methodologies for cowpea is the AMMI
(BARROSet al., 2013; DDAMULIRAet al., 2015) and
GGE-Biplot (AKANDE; BALOGUN, 2009; CARVALHO, 2015; OLAYIWOLA; SOREMI; OKELEYE, 2015;
OKORONKWO; NWOFIA, 2016; SANTOSet al., 2016);
both are based on Biplot graphs, generated from matrices of means of genotypes obtained in each environment. These methodologies have been most used in cowpea in studies on adaptability and stability for grain yield.
Studies on the adaptability and stability of cowpea genotypes to nutrient concentrations in grain are scarce.
Ddamulira et al. (2015) used the AMMI analysis to
evaluate the adaptability and stability of genotypes for protein concentration. However, studies in this line of research—with minerals and use of GGE-Biplot method— were not found in other studies. Thus, the objective of this study was to evaluate the adaptability and stability of the zinc density in the grain of 12 cowpea genotypes in four environments in the states of Piauí (PI) and Maranhão (MA), Brazil, by using the GGE-Biplot method.
MATERIAL AND METHODS
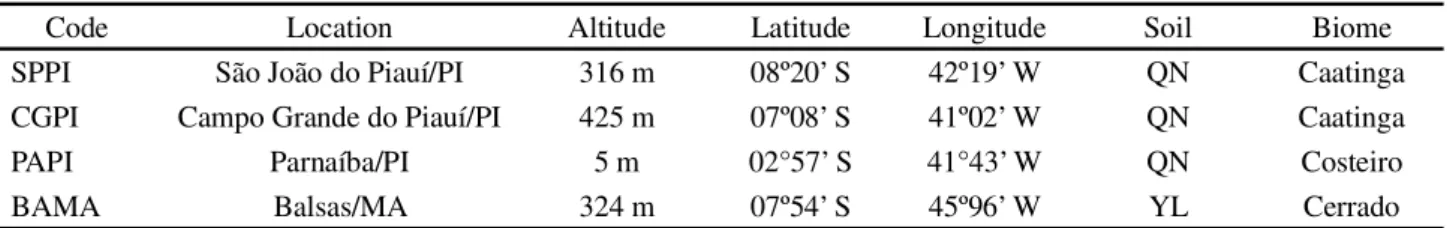
Twelve genotypes of cowpea were evaluated—10 lines and two cultivars (controls)—from the Embrapa Mid-North Cowpea Breeding Program (Table 1). The lines were selected from a screening of 30 genotypes, based on iron and zinc concentrations in the grain (DIAS-BARBOSA, 2015).
The validation tests for grain zinc concentrations were conducted in the dry season in three locations in the state of Piauí (PI)—São João do Piauí, Campo Grande do Piauí, and Parnaíba—and in one location, Balsas, in the state of Maranhão (MA), Brazil (Table 2), during the 2014/2015 crop season. Sowing in Campo Grande do Piauí occurred in February, and in São João do Piauí, Parnaíba, and Balsas, sowing was in March.
Table 1 - Cowpea genotypes evaluated and their genealogy, commercial subclass (CS), and growth habit (GH)
GC = Genotype code; C: Control; ML = Mulato, SV = Sempre-verde, BL= Branco Liso; SP = Semi-prostrate
GC Line/Cultivar Genealogy CS GH
G1 MNC04-769F-55 CE-315 × TE97-304G-12 ML SP
G2 MNC04-782F-108 (TE97-309G-24 × TE96-406-2E-28-2) × TE97-309G-24 SV SP
G3 MNC04-774F-78 TE97-309G-18 × TE97-304G-4 ML SP
G4 MNC04-795F-158 MNC99-518G-2 × IT92KD-279-3 SV SP
G5 MNC04-774F-90 TE97-309G-18 × TE97-304G-4 SV SP
G6 MNC04-769F-45 CE-315 × TE97-304G-12 SV SP
G7 MNC04-769F-31 CE-315 × TE97-304G-12 ML SP
G8 MNC04-769F-26 CE-315 × TE97-304G-12 SV SP
G9 MNC04-792F-146 MNC00-553D-8-1-2-3 × TV × 5058-09C ML SP
G10 MNC04-762F-9 TE96-282-22G × (Te96-282-22G × Vita7) BL SP
G11 BRS Xiquexique (C) TE87-108-6G × TE87-98-8G BL SP
G12 BRS Tumucumaque (C) TE96-282-22G × IT87D-611-3 BL SP
Code Location Altitude Latitude Longitude Soil Biome
SPPI São João do Piauí/PI 316 m 08º20’ S 42º19’ W QN Caatinga
CGPI Campo Grande do Piauí/PI 425 m 07º08’ S 41º02’ W QN Caatinga
PAPI Parnaíba/PI 5 m 02°57’ S 41°43’ W QN Costeiro
BAMA Balsas/MA 324 m 07º54’ S 45º96’ W YL Cerrado
Table 2 - Geographical coordinates, soil types and biomes of the locations used for the cowpea experiments, 2015
QN = Quartzeneic Neosol; YL = Yelow Latosol. Source = Wikipédia (2016), Embrapa (1999)
of 1.5 m x 5.0 m with three 5.0 m rows spaced 0.50 m apart with 0.25 m between plants, and the evaluation area consisted of the central row. Four seeds were sown per hole. The plants were thinned 20 days after sowing, leaving two plants per hole. The experimental areas were not fertilized.
Conventional soil preparation with one plowing and one harrowing were used. Weed control was carried
out with the herbicide Dual Gold (1.2 L ha-1); it was
applied in pre-emergence in Balsas-MA and Parnaíba-PI, and in all studied locations, two manual weeding sessions were carried out during the crop cycle. Insect pest control was carried out with two applications of the insecticides
Dimetoate (20 mL c.p. 20-L water-1) and Thiamethoxam
(5 g c.p. 20-L water-1). The genotypes were harvested
at the physiological maturity stage, when the pods were completely dry and the grains had 15% moisture. The grains were sun dried to reduce their moisture to 13%— ideal moisture for storage; this was determined by a moisture analyzer (GEHAKA AGRI, G650).
Grain samples of each genotype were randomly collected, washed, ground, and 200 mg were put into a
digestion tube; then, 5 ml of the digest solution (2:1 nitro-perchloric solution) was added into it. The tubes were placed in the digester block for approximately two hours until reaching 200 °C. After digestion, the extracts were transparent and clear with an approximate volume of 2 mL.
After the digestion step, extract received distilled water until reaching 20 mL. Afterwards, the extract was homogenized for readings in an atomic flame absorption spectrophotometer (GBC, B462) by using the specific wavelength of the zinc element in the software of the device. The zinc densities were obtained in parts per
million (ppm) and then converted to mg 100 g-1.
Individual analysis of variance were performed for the environments, and joint analysis of variance for the zinc concentration. The joint analysis of variance considered the effect of genotypes as fixed, and the effect of environments as random. The statistical model used followed the equation:
Yijk = µ+gi+ej+geij+βk(j)+εijk (1)
wherein Yijk is the observed value of the genotypei in the
trait;g
i is the effect of the genotypei;ej is the effect of
the environment j; ge
ij is the effect of the interaction of
the genotype i with the environment j; βk(j) is the effect
of the block k within the environment j; and εijk is the
experimental error associated with the plotijk.
The GGE-Biplot methodology (YAN; KANG, 2003; YAN, 2011) was used for the adaptability and stability analyses by applying the double entry table containing the phenotypic means of the genotypes (G) in each environment (E). In other words, GGE is the matrix of the effects of genotypes plus the effects of G×E. The matrix of adjusted means of the G and GE effects was decomposed by SVD (Singular Value Decomposition) with the objective of analyzing the multiplicative part of the GGE-Biplot model, as follows:
(2)
wherein λk is the singular value of the kth axis of the
principal component analysis; γik and αjk are the kth
eigenvectors of then principal components of genotypes
and environments retained in the model; and ρij is the
residue associated with the multiplicative term GGE. Yan and Tinker (2006) proposed an Information Ratio (IR) to evaluate the suitability of a Biplot in
displaying the patterns of a double-entry table with g
(genotypes) ande (environments). The IR can be calculated
for each Principal Component (PC), which is the ratio of
the total variance explained by each PC multiplied byk.
The interpretation is as follows: a PC with IR>1 contains patterns—associations between environments—and a PC with IR<1 does not contain any pattern. The dimension-2 Biplot (PC1×PC2) adequately represents the patterns in the data if at least one of the first two PCs has an IR>1.
The GGE-Biplot method was performed computationally in the R environment (R Development Core Team, 2014) from a script that used the R agricolae
(MENDIBURU, 2014) and GGEBiplotGUI (FRUTOS; GALINDO; LEIVA, 2014).
During the analysis in the R environment— generating of the Biplot graphics by the GGEBiplotGUI
package—the model selected was: no scaling, with
G+GE centered by the tester (tester-centered G+GE), which represents the GGE model; the method by singular partitioning value (SPV) type column metric preserving; and the Biplot type PC1×PC2, which shows the first against the second principal component.
RESULTS AND DISCUSSION
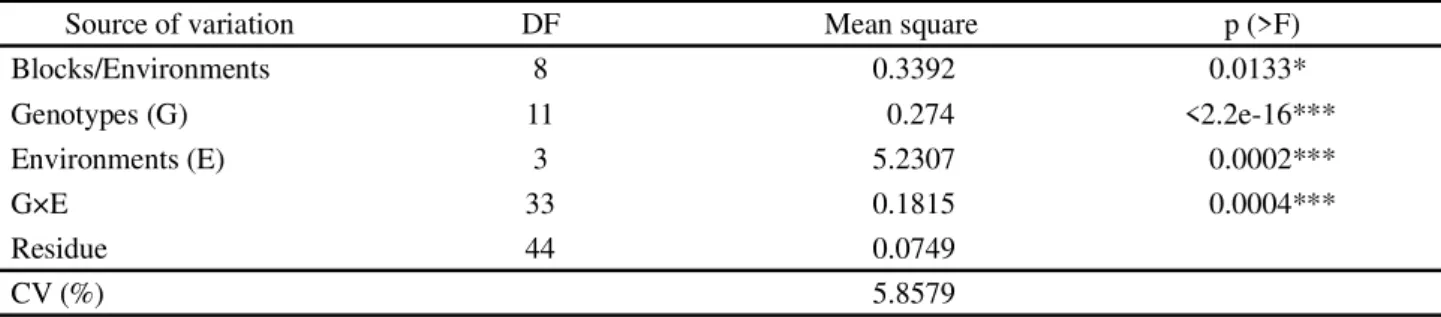
The joint analysis of variance of the grain zinc concentration of the cowpea genotypes is presented
in Table 3. The genotypes differed significantly (p =
0.02%) in the zinc concentration, which denotes the zinc variability, and the possibility for selection and breeding. Although some genotypes show some relation in terms of genetic origin and commercial subclass (Table 1), a significant variation was observed in the grain zinc concentration.
Rocha et al. (2008, 2011b) and Dias-Barbosa
(2015) evaluated cowpea genotypes and also reported the presence of genetic variability in this mineral. However, most of these studies were conducted in a single environment, which may have inflated the estimates of genetic variance as a result of G×E.
The environments also differed for the zinc
concentration (p< 2.2e-16) (Table 3), showing that the
eco-geographic characteristics of the test locations (Table 2), combined with climatic variations, were different for this mineral. Environments that differ for this mineral were
also observed by Rochaet al. (2011b), who evaluated the
eight cowpea genotypes’ adaptability and stability in three environments in the North and Northeast regions of Brazil.
Table 3 - Joint analysis of variance for grain zinc concentration of 12 cowpea genotypes evaluated in four environments of the Mid-North region of Brazil, 2015
p = probability; Significance code: 0 “***” 0.001 “**” 0.01 “*” 0.05 “·” 0.1 “ ” 1. CV = Coefficient of variation; DF = Degrees of freedom
Source of variation DF Mean square p (>F)
Blocks/Environments 8 0.3392 0.0133*
Genotypes (G) 11 0.274 <2.2e-16***
Environments (E) 3 5.2307 0.0002***
G×E 33 0.1815 0.0004***
Residue 44 0.0749
The G×E for zinc concentration was highly
significant (p = 0.0004) (Table 3); this shows the different
behavior of this mineral in genotypes depending on the
testing environment. Rocha et al. (2011b) evaluated a
group of six cowpea genotypes in three environments in the Northeast region of Brazil; and Muranaka et al. (2016) evaluated 20 cowpea genotypes in Nigeria during two crop seasons. Both studies found complex G×E for the zinc concentration in cowpea grains.
According to Hongyu et al. (2015) four main
objectives for multi-environment data (MET) can be carried out by the GGE-Biplot method: 1) investigate the mega-environment to understand the target environment; 2) evaluate genotypes; 3) evaluate the testing environments within each mega-environment; and 4) understand the causes of G×E. The analysis of adaptability and stability of the zinc concentration based on this methodology is presented in Table 4 and Figures 1, 2, 3, and 4.
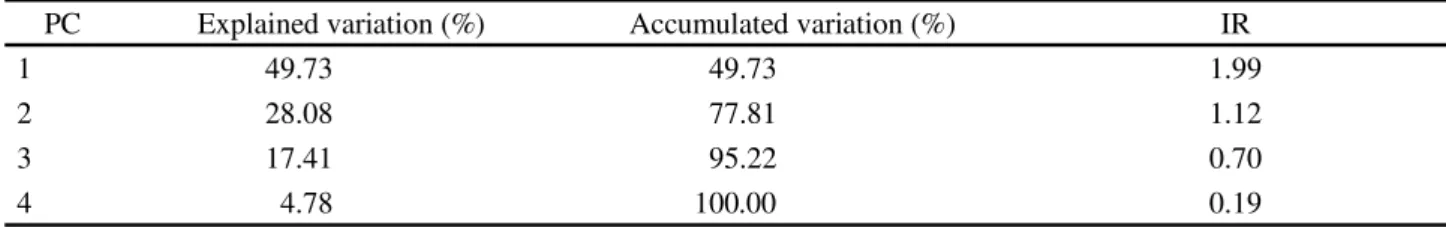
It was observed that the principal components analysis (PCA) decomposed the effect of genotypes + G×E (GGE) into four principal components (PC); the first two, PC1 and PC2, explained 49.73% and 28.08% of the total variation, respectively, exploring 77.81% of the GGE variation (Table 4).
According to the IR of the four PC, only the first two (PC1 and PC2) contain patterns (IR>1). Therefore, the Biplot is considered adequate to represent the data pattern. According to Yan and Tinker (2006), the dimension-2 Biplot adequately represents the patterns in the data, if
only the first two PCs have an IR≥1. The existence of
patterns in the first two PCs confirms the results of the F test of the joint analysis, which detected a significant difference for the effect of the G×E. This shows that the genotypes behaved differently depending on the testing environment with a magnitude that justifies the use of the GGE-Biplot method.
The variation explained by the first two PCs of 77.81% (Table 4) indicates that the singular value decomposition of the effects of the GGE matrix, showed high efficiency. Different results were found by
Akande and Balogun (2009), who evaluated 10 cowpea genotypes in three locations for two years in Nigeria, Carvalho (2015), who evaluated 20 cowpea genotypes in 82 environments in the North, Northeast, and Center-West regions of Brazil. Both studies found that the first two axes of the GGE-Biplot method explained a low percentage (57.61% and 34.5%, respectively) of the GGE effects. However, Okoronkwo and Nwofia (2016), who evaluated the yield adaptability and stability of cowpea genotypes in Nigeria by using the GGE-Biplot, also found high efficiency for this method with the first two principal components explaining 100% of the total GGE variation. These differences, regarding the efficiency percentage of the methodology, in explaining the GGE variation depend on the trait, genotypes, and environments (locations and years) evaluated.
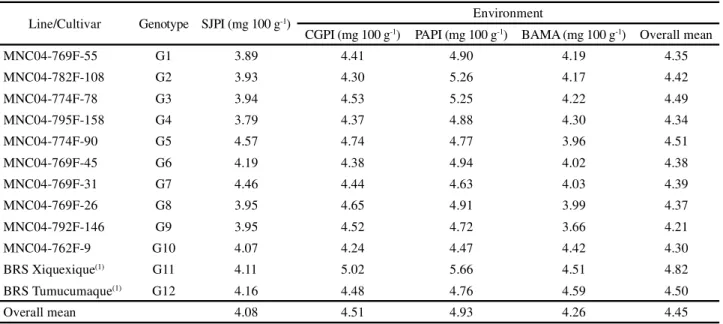
The mean zinc concentrations of the 12 cowpea genotypes obtained in the four testing environments are shown in Table 5. The zinc concentration ranged
from 3.66 mg 100 g-1 (G10 MNC04-792F-146, BAMA)
to 5.66 mg 100 g-1 (G11 BRS Xiquexique, PAPI). This
variation was greater than that observed by Muranaka
et al. (2016), who evaluated 240 cowpea genotypes
with results ranging from 3.27 to 4.78 mg 100 g-1. The
overall mean found in this study (4.45 mg 100 g-1) is similar
to that found by Rochaet al. (2011b) (4.38 mg 100 g-1), who
evaluated 20 lines of black eye cowpea.
The superiority of zinc concentration in the cultivar
BRS Xiquexique was also found by Rocha et al. (2008),
who evaluated 42 cowpea genotypes in Teresina, Piauí,
and found a mean of 5.36 mg 100 g-1, which is higher than
that found in this study. The environments Campo Grande do Piauí-PI (CGPI) and Parnaíba-PI (PAPI) showed the highest zinc concentrations in the grain and the environment São João do Piauí-PI (SJPI) had the lowest concentrations; the later was an unfavorable environment for the grain zinc concentration.
Soil analyses of SJPI, CGPI, PAPI, and Balsas-MA
(BAMA) showed zinc concentration in mg dm-3 of 2.29;
0.49; 0.63; and 0.62 respectively, denoting that even in environments with lower zinc content in the soil, some
Table 4 - Explained and accumulated ratio, and Information Ratio (IR) of the four Principal Components (PC) resulted from the Principal Component analysis, for the grain zinc concentration in 12 cowpea genotypes in four environments of the Mid-North region of Brazil, 2015
PC Explained variation (%) Accumulated variation (%) IR
1 49.73 49.73 1.99
2 28.08 77.81 1.12
3 17.41 95.22 0.70
Line/Cultivar Genotype SJPI (mg 100 g-1) Environment
CGPI (mg 100 g-1) PAPI (mg 100 g-1) BAMA (mg 100 g-1) Overall mean
MNC04-769F-55 G1 3.89 4.41 4.90 4.19 4.35
MNC04-782F-108 G2 3.93 4.30 5.26 4.17 4.42
MNC04-774F-78 G3 3.94 4.53 5.25 4.22 4.49
MNC04-795F-158 G4 3.79 4.37 4.88 4.30 4.34
MNC04-774F-90 G5 4.57 4.74 4.77 3.96 4.51
MNC04-769F-45 G6 4.19 4.38 4.94 4.02 4.38
MNC04-769F-31 G7 4.46 4.44 4.63 4.03 4.39
MNC04-769F-26 G8 3.95 4.65 4.91 3.99 4.37
MNC04-792F-146 G9 3.95 4.52 4.72 3.66 4.21
MNC04-762F-9 G10 4.07 4.24 4.47 4.42 4.30
BRS Xiquexique(1) G11 4.11 5.02 5.66 4.51 4.82
BRS Tumucumaque(1) G12 4.16 4.48 4.76 4.59 4.50
Overall mean 4.08 4.51 4.93 4.26 4.45
1Control. SJPI = São João do Piauí, CGPI = Campo Grande do Piauí and PAPI = Parnaíba, PI, Brazil; BAMA = Balsas, MA, Brazil
Table 5 - Averages zinc concentrations in the grains of 12 cowpea genotypes evaluated in four environments of the Mid-North region of Brazil, 2015
genotypes had the ability to extract and concentrate zinc in the grains. The nutrient uptake by the plant is complex, and are affected by the availability of nutrients and water, climate, genotype, cropping systems, and yield level.
The classification of genotypes based on performance in the environments, and of environments on the genotype performances is shown in Figure 1. Genotypes G1, G4, G10 and G12 formed obtuse angles with all of the environments except BAMA; these genotypes had lower average zinc concentration in most environments. This information is confirmed in Table 3.
Genotypes G2, G3, and G8 formed an acute angle with all the environments, except SJPI (G2 and G3) and BAMA (G8); therefore, this group of genotypes concentrated more zinc in the grain than average in most of the testing environments. The genotype G11 (BRS Xiquexique) formed an acute angle with all environments, also concentrating more zinc in the grain than the average in all environments.
The other genotypes presented acute and obtuse angles, respectively, in two environments each, with zinc concentrations higher than the average in two environments and less than the average in the other two environments. Therefore, this presents specific adaptability to these environments.
According to the average × stability of zinc concentration (Figure 2), the genotypes presented the following zinc concentration in decreasing order:
Figure 1 - GGE-Biplot for the zinc concentrations of 12 cowpea genotypes evaluated in four environments of the Mid-North region of Brazil, 2015
G11>overall mean>G3>G2>G5>G8>G6>G1>G4 = G12>G9>G7>G10. The genotype G11 (BRS Xiquexique) and the line G3 (MNC04-762F-9) stood out with closer
means to the average environment. Rocha et al. (2011a)
The genotypes that had zinc concentration above the average were more stable (line with two arrows perpendicular to the MEA), namely in descending order: G11>G8>G3>G2>G5 (Figure 2). G5 was highly unstable (greater projection in relation to the MEA - dotted green line), presenting a lower zinc concentration than expected in the SJPI environment, and higher iron concentrations in the PAPI and CGPI environments.
The genotype G11 (BRS Xiquexique) had the highest zinc concentration and was the most stable. Therefore, G11 (control) was the ideal genotype for selection and recommendation as a biofortified genotype with zinc, which was expected for this trait, followed
by the G3 line (MNC04-774F-78). Rochaet al. (2011a)
evaluated the stability of six cowpea genotypes in three environments and observed a similar result regarding the stability of the cultivar BRS Xiquexique, but also identified high stability of the cultivar BRS Tumucumaque; however, in the present study, this mineral was unstable in this cultivar.
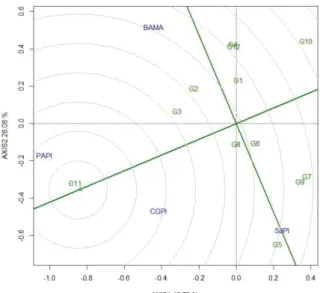
Genotypes located closest to the center of circumscribed circles are the most desirable (Figure 3).
Thus, G11 was the ideal genotype regarding grain zinc concentrations in this dataset, followed by G3, G2, and G8. Although G3 and G2 had zinc concentrations well above G8, they were less stable than G8 according to Figures 2 and 3. The least recommended genotype as a biofortified zinc genotype was G10, with a greater distance from the center of the circumscribed circles,
i.e., it is less able to concentrate the zinc in the grain. According to Yan and Tinker (2006) and Yan (2011), a stable genotype is desired only when it presents high average performance for the characteristics being studied.
Among all genotypes evaluated, G11 (BRS Xiquexique) is the only one that combines genes for stability and adaptability at the same time. Genotypes with these characteristics can be grown in a wide range of environments maintaining a high zinc concentration
in the grain. Rocha et al. (2011b) also found high
stability in this cultivar for grain zinc concentration in a study conducted with six genotypes in three environments.
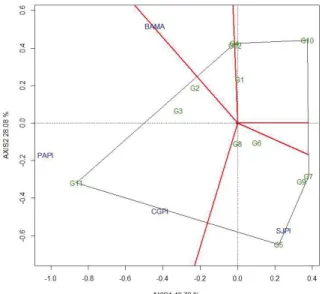
Figure 4 shows that the vertices of the polygon are formed by genotypes G11, G5, G7, G10, and G4. The four environments were cut in 2 mega-environments by the lines that left the biplot origin and classified in two groups of environments: (I) CGPI, PAPI, BAMA, and (II) SJPI. The genotype G11 (BRS Xiquexique) is the vertex of the mega-environment I in which the environments PAPI, CGPI, BAMA were placed; therefore, it is the genotype that had better performance in this mega-environment and the most adapted in this group, followed by the genotypes G2 and G3.
G5 and G7 are vertices of the mega-environment II in which the SJPI environment was placed; therefore, these genotypes are more adapted to this group (Figure 4). In the sectors with G1, G4, G10, and G12, which do not
Figure 2 - Average × stability of zinc concentration with the mean environmental axis (MEA), resulted from the GGE2 Biplot analysis of 12 cowpea genotypes evaluated in four environments of the Mid-North region of Brazil, 2015
contain environments, the genotypes do not present high zinc concentration in any of the testing environments, i.e., these genotypes are the worst genotypes, considering all environments. The number of mega-environments depends on the number and characteristics of the genotypes and environments and the nature of the trait studied.
CONCLUSIONS
1. The environment Parnaíba PI, Brazil, is the most suitable for the selection of adapted genotypes for grain zinc concentration;
2. The cultivar BRS Xiquexique and the lines MNC04-774F-78, MNC04-782F-108, MNC04-769F-26 presented the highest grain zinc concentrations, combined with good adaptability and stability; therefore, these lines are promising as zinc biofortified cultivars for the states of Piauí and Maranhão, Brazil.
ACKNOWLEDGEMENTS
The authors thank the Brazilian Agricultural Research Corporation (Embrapa Meio-Norte) for the experimental fields and laboratories and The Embrapa-Monsanto Research Fund and the BioFORT and HarvestPlus programs for their financial support.
Figure 4 - Mega-environment (which-won-where) of the zinc concentration resulting from GGE2 Biplot analysis of 12 cowpea genotypes evaluated in four environments of the Mid-North region of Brazil, 2015
REFERENCES
AKANDE, S. R.; BALOGUN, M. O. Multi-locational evaluation of cowpea grain yield and other reproductive characters in the forest and Southern Guinea Savanna agro-ecologies of Nigeria.
Electronic Journal of Environmental, Agricultural and Food Chemistry, v. 8, n. 7, p. 526-533, 2009.
BARROS, M. A.et al. Adaptabilidade e estabilidade produtiva
de feijão-caupi de porte semiprostrado.Pesquisa Agropecuária Brasileira, v. 48, n. 4, p. 403-410, 2013.
CARVALHO, L. C. B.Interpretação da interação genótipos x ambientes em feijão-caupi usando modelos multivariados, mistos e covariáveis ambientais. 2015. 115 f. Tese (Doutorado em Genética e Melhoramento de Plantas) - Escola Superior de Agricultura “Luiz de Queiroz”, Universidade de São Paulo, Piracicaba, 2015.
DDAMULIRA, G. et al. Grain yield and protein content
of Brazilian cowpea genotypes under diverse Ugandan environments. American Journal of Plant Science, v. 6, p. 2074-2084, 2015.
DIAS-BARBOSA, C. Z. M. C.Seleção de linhagens elite de feijão-caupi (Vigna unguiculata (L.) Walp.) para biofortificação
de ferro e zinco e características físico-químicas do grão. 2015. 72 f. Dissertação (Mestrado em Alimentos e Nutrição) -Universidade Federal do Piauí, Teresina, 2015.
EMPRESA BRASILEIRA DE PESQUISA AGROPECUÁRIA. Centro Nacional de Pesquisa de Solos. Sistema brasileiro de classificação de solos. Rio de Janeiro: Embrapa Solos, 1999. 412 p.
FREIRE FILHO, F. R. et al. Feijão-caupi no Brasil: produção, melhoramento genético, avanços e desafios. Teresina: Embrapa Meio Norte, 2011. 84 p.
FRUTOS, E.; GALINDO, M. P.; LEIVA, V. An interactive biplot implementation in R for modeling genotype-by-environment interaction. Stochastic Environmental Research and Risk Assessment, v. 28, n. 7, p. 1629-1641, 2014.
GONÇALVES, A. S. F.et al. Uso da biofortificação vegetal: uma
revisão.Revista do Centro Universitário de Patos de Minas, v. 6, p. 75-87, 2015.
HONGYU, K.et al. Comparison between AMMI models and
GGE biplot for multi-environment trials.Revista Brasileira de Biometria, v. 33, n. 2, p. 139-155, 2015.
HOTZ, C.; BROWN, K. H. Assessment of the risk of zinc deficiency in populations and options for its control. International Zinc Nutrition Consultative Group. (Technical Document, 1). 2004. Disponível em: <http://izincg.org/files/ izincgtechdocfnb2004.pdf>. Acesso em: 13 maio 2016. MENDIBURU, F. Agricolae: statistical procedures for agricultural research. R package, version 1.2-1, 2014.
MURANAKA, S.et al. Genetic diversity of physical, nutritional
OKORONKWO, C. M.; NWOFIA, G. E. Yield stability and inter relationships between seed yield and associated traits of 25 cowpea (Vigna unguiculata[L.] Walp.) genotypes.African
Journal of Agricultural Science and Technology, v. 4, n. 5, p. 728-734, 2016.
OLAYIWOLA, M. O.; SOREMI, P. A. S.; OKELEYE, K. A. Evaluation of some cowpea (Vigna unguiculata [L.] Walp.)
genotypes for stability of performance over 4 years. Current Research in Agricultural Sciences, v. 2, n. 1, p. 22- 30, 2015. Parnaíba>; <https://pt.wikipedia.org/wiki/São_João_do_Piauí>. Acesso em: 18 nov. 2016.
PEREIRA, T. C. et al. Research on zinc blood levels and
nutritional status in adolescents with autoimmune hepatitis.
Arquivos de Gastroenterologia, v. 48, n. 1, p. 62-65, 2011. R DEVELOPMENT CORE TEAM. R: a language and environment for statistical computing. Vienna: R Foundation for Statistical Computing, 2014. Disponível em: <http://www. R-project.org>. Acesso em: 21 maio 2016.
ROCHA, M. M.et al.Avaliação dos conteúdos de proteína,
ferro e zinco em germoplasma elite de feijão-caupi. Teresina: Embrapa Norte, 2008. 4 p. (Embrapa Meio-Norte. Comunicado Técnico, 212).
ROCHA, M. M.et al.Avaliação dos teores de ferro, zinco e
proteína em linhagens de feijão-caupi da classe comercial branca, subclasse fradinho. Teresina: Embrapa Meio-Norte, 2011b. 4 p. (Embrapa Meio-Norte. Comunicado Técnico, 226). ROCHA, M. M.et al. Adaptabilidade e estabilidade de genótipos
de feijão-caupi para teores de ferro e zinco nos grãos. In: REUNIÃO DE BIOFORTIFICAÇÃO NO BRASIL, 4., 2011,
Teresina. Anais... Rio de Janeiro: Embrapa Agroindústria de Alimentos; Teresina: Embrapa Meio-Norte, 2011a.
SANTOS, A.et al. Adaptabilidade e estabilidade de genótipos
de feijão-caupi ereto via REML/BLUP e GGE Biplot.
Bragantia, v. 75, n. 3, p. 55-62, 2016.
SANTOS, A. et al. Adaptability and stability of cowpea
genotypes to Brazil Midwest. African Journal of Agricultural Research, v. 10, n. 41, p. 3901-3908, 2015. VELLOZO, E. P.; FISBERG, M. A. Contribuição dos alimentos fortificados na prevenção da anemia ferropriva.
Revista Brasileira de Hematologia e Hemoterapia, v. 32, n. 2, p. 140-147, 2010.
WESSELLS, K. R.; BROWN, K. H. Estimating the global prevalence of zinc deficiency: results based on zinc availability in national food supplies and the prevalence of stunting.PLoS ONE, v. 7, n. 11, p. 1-11, 2012.
WIKIPÉDIA, a enciclopédia livre. Disponível em: <https:// pt.wikipedia.org/wiki/Campo_ Grande_do_Piauí>; <https:// pt.wikipedia.org/wiki/Balsas>; <https://pt.wikipedia.org/wiki/ YAN, W. GGE Biplot vs. AMMI graphs for genotype-by-environment data analysis.Journal of the Indian Society of Agricultural Statistics, v. 65, n. 2, p. 181-193, 2011. YAN, W.; KANG, M. S.GGE Biplot Analysis: a graphical tool for breeders, geneticists, and agronomists. Boca Raton: CRC Press, 2003. 271 p.