Templates for Calculating IT Services Costs
Jorge Emanuel Rodrigues de Andrade
Thesis to obtain the Master of Science Degree in
Information Systems and Computer Engineering
Examination Committee
Chairperson: Prof. Lorem Ipsum
Supervisor: Prof. Miguel Leitão Bignolas Mira da Silva
Members of the Committee: Prof. Maria do Rosário Ponces de Carvalho
iii
Acknowledgements
I would like to thank everyone who took part of my academic career and especially who helped me completing this last journey, my master thesis.
The advice and guidance given by Professor Miguel Mira da Silva, as well as his persistence and mo-tivation, were crucial for the success of this research. Therefore, I would like to offer a special thanks to him as my supervisor.
I would like to express my gratitude towards all the intervenient in the demonstrations performed, whom shared their knowledge and helped developing the thesis in numerous ways. A particular thanks to Teresa Cristo, Luís Azevedo and Manuel Ramos for their availability and care.
To my research colleagues, for the motivation and contributions that made my research richer and fruitful. I am particularly grateful to André Machado, whose exchange of ideas and support were es-sential to develop this thesis.
I would also like to express my great gratitude towards my family, for the patience, inspiration and unconditional support, helping me to move forward in every moment. I send my deepest appreciation to my grandfather, who will now watch the end of my academic journey from the sky. Without his presence in my life I would certainly not arrive here. To him I dedicate my thesis and this journey. I would like to offer a special thanks to Marina as well, whose love, patience and incentive were es-sential throughout the degree, especially during this last step. The battles and achievements were shared, and her strength always made me go further.
To my neocatechumenal community, for the support, help and prayer, especially in the most difficult times. To all my friends for motivating and helping me, allowing for relaxed and important moments along the way.
To my colleagues at Portugal Telecom, for the understanding and support in the final phase of this thesis.
v
Resumo
A maioria dos atuais e futuros modelos de negócio necessitam do envolvimento de recursos das TI. Os mercados evoluem a uma velocidade cada vez maior, exigindo uma adaptação constante dos processos de negócio à realidade, o que leva a níveis mais altos de exigência nas TI. A crise que afe-tou a maior parte da economia mundial obriga as organizações a permanecerem eficientes e competi-tivas. O rápido crescimento dos investimentos nas TI pressiona de forma crescente a gestão dos seus custos para que possam pesar claramente os seus benefícios. No entanto, implementar essa gestão é um projeto difícil, não só devido aos métodos de custeio eficientes estarem fora do alcance da mai-oria das organizações mas também às particularidades dos Serviços de TI. Como solução para este problema, propomos um modelo de custeio usando Templates de processos de negócio para calcular os custos dos Serviços de TI, tendo em conta essas particularidades. Finalmente, demonstraremos o nosso modelo de custeio através de estudos de campo e iremos avaliá-lo através de entrevistas, da Framework de Moody e Shanks, dos princípios de Österle e do feedback de peritos e praticantes.
vii
Abstract
The majority of current and future business models are relying on the involvement of IT resources. Rapidly changing markets require a constant adaptation of business processes to reality, which leads to higher requirements for IT. The crisis that affected most of the world's economy also forces organi-zations to stay efficient and competitive. The rapid growth of IT investments increased the pressure on managing IT costs for clearly weighing its benefits. However, it is a very difficult venture, not only be-cause efficient costing methodologies are out of reach for most organizations but also bebe-cause of the characteristics of IT Services. As a solution to this problem, we propose a model using business pro-cess templates to calculate IT Services costs and taking into account those characteristics. Finally, we will demonstrate the model through field studies and evaluate it through interviews, Moody and Shanks Framework, Österle principles and feedback from experts and practitioners.
ix
Table of Contents
Acknowledgements ... iii
Resumo... v
Abstract ... vii
List of Figures ... xii
List of Tables ... xiv
List of Acronyms ... xvi
1 Introduction ... 1
2 Research Methodology ... 4
3 Research Problem ... 8
4 Related Work ... 13
4.1 ITIL ... 13
4.2 Costing ... 14
4.2.1 Cost Accounting and Management ... 15
4.2.2 Cost Concepts ... 15
4.2.3 IT Financial Management ... 16
4.2.4 Activity-Based Costing... 18
4.2.5 Time-Driven Activity-Based Costing ... 19
4.2.6 Other Costing Methodologies ... 21
4.2.7 Discussion ... 21
4.3 Business Processes ... 22
4.3.1 Modeling Languages ... 23
4.3.2 Discussion ... 24
4.4 Process Templates ... 25
4.4.1 ITIL Process Templates... 27
4.5 Discussion... 28
x
6 Research Proposal ... 32
6.1 Thesis Boundaries ... 33
6.2 Costing Template ... 34
6.3 Template Application ... 38
6.4 Process Benchmarking ... 38
6.5 Summary... 39
7 Demonstration ... 41
7.1 Social Security Informatics Institute, I.P. ... 42
7.2 Defence Data Centre ... 45
8 Evaluation ... 50
8.1 Demonstrations ... 50
8.2 Interviews ... 52
8.2.1 Results ... 53
8.3 Moody and Shanks Framework ... 54
8.3.1 Evaluation Results ... 55
8.4 Österle et al. Principles ... 56
8.4.1 Evaluation Results ... 56
8.5 Summary... 57
9 Conclusion ... 59
9.1 Communication ... 60
9.2 Lessons Learned ... 60
9.3 Limitations ... 61
9.4 Main Contributions ... 62
9.5 Future Work ... 62
References ... 65
Annexes ... 70
Annex 1 – Incident Management Process Template ... 70
Annex 2 – Detection and Registry Subprocess ... 71
Annex 3 – Classification Subprocess ... 71
Annex 4 – Initial Support and Investigation Subprocess ... 72
xi
xii
List of Figures
Figure 1 - DSRM Process Model, adapted from (Peffers, 2007) ... 5
Figure 2 - IT Unmanaged Cost versus Time problem (Cassidy & Cassidy, 2010) ... 9
Figure 3 - ITIL Books covering the Service Lifecycle ... 14
Figure 4 - ITIL Incident Management Process Top-level Costing Template ... 34
Figure 5 - Detection and Registry Subprocess ... 35
xiv
List of Tables
xvi
List of Acronyms
ABC Activity-Based Costing
BPMN Business Process Model and Notation
CCR Capacity Cost Rate
COBIT 5 Control Objectives for Information and related Technology 5
DDC Defence Data Centre
DEMO Design & Engineering Methodology for Organizations
DSRM Design Science Research Methodology
ERP Enterprise Resource Planning
ISO International Organization for Standardization
IT Information Technology
ITIL Information Technology Infrastructure Library
ITSM Information Technology Service Management
MSQMF Moody and Shanks Quality Management Framework
1
Chapter 1
Introduction
Over the past few decades, the importance of Information Technologies (IT) has grown every year in nearly every type of business (McAfee & Brynjolfsson, 2008). As this importance rises, the need for managing its costs and performance also increases. We have seen how the global financial crisis forced organizations to be more cost conscious. Moreover, the economic environment will continue to affect the preponderance and cost of IT.
According to a study performed by IDC in Portugal, national organizations and consumers, faced with an unfavourable economic environment, have reduced spending on IT about 1.6% in 2013 (IDC, 2013). Another study made in Portugal confronted organizations with the question of what are the key steps to achieve organizational goals to outline economic crisis and become more competitive, and 90% of the organizations replied with cost information and reduction (IDC, 2013). Without cost infor-mation it is impossible to do a proper cost reduction; it is necessary to know the reality of the organiza-tion first.
To obtain this cost information a number of methodologies were developed throughout the years. These methodologies come from the traditional accounting systems that evolved naturally to better take into account the impact of overhead costs on the total cost of products. This was where most methodologies failed (Lambert & Chen, 1996). This increased attention on overhead costs comes from the fact that the industry has evolved from manufacturing to services (Škoda, 2009) and, with this transition, overhead costs have grown from residual to being the majority.
2
Even though there are methodologies that allow organizations to know what their real costs are, they require time, expertise and software that are out of reach for most of them. So, they have to rely on traditional accounting, which often leads to unsupported or badly supported decisions which in turn lead to undesirable results. On the other hand, it has been observed that the results of cost analysis done in organizations inside the same industry were very similar, suggesting that some reutilization or standardization could be achieved. This applies as well to IT Services, which are much similar in each IT Department.
As a response to the issues rose above, our research proposal is based on the use of business pro-cess templates for calculating the costs of IT Services, following ITIL guidelines and using the Time-Driven Activity-Based Costing methodology.
To evaluate the solution we will use the results from the demonstrations, which were field studies in real organizations, and compare them to the objectives of the solution, through: interviews and ques-tionnaires; the Moody and Shanks Framework to evaluate the proposed artefact (Moody & Shanks, 2003); and the four principles proposed by Österle et al. will be used to evaluate the research (Österle, et al., 2011).
After setting the context for this report we will give a brief description of its structure. This research was conducted by using the Design Science Research Methodology (DSRM), that aims at creating a commonly accepted framework for the production of Design Science Research in Information Systems and creating and evaluating artefacts to solve relevant organizational problems (Hevner, March, Park, & Ram, 2004).
4
Chapter 2
Research Methodology
The research methodology applied across this research is Design Science, which was chosen to de-velop and validate a proposal to solve our research problem. We chose this methodology because it focuses on creating and evaluating innovative IT artefacts, which will be explained next, that enable organizations to address important information-related tasks.
In order to better understand DSRM (Design Science Research Methodology) it is important to com-prehend the concept of methodology. According to Hevner et al., a methodology is “a system of princi-ples, practices and procedures applied to a given branch of knowledge” (Peffers, 2007). This research methodology aims at overcoming research paradigms such as the traditional descriptive or interpreta-tive research, in which the outputs are mostly explanatory and one could argue are often not applica-ble to the solution of proapplica-blems encountered in research and practice (Peffers, 2007).
This methodology requires the creation and evaluation of an innovative and purposeful artefact that solves a specific problem in a specific domain, in the context of Information Systems (Hevner, March, Park, & Ram, 2004). The artefact can be defined as a construct (vocabulary and symbols), a model (abstractions and representations), a method (algorithms and practices), or an instantiation (imple-mented and prototype systems) (Hevner, March, Park, & Ram, 2004).
5
Our investigation was problem-centred initiated since it started with the identification of a problem, with the other five steps following in order to complete the full research cycle. Figure 1 shows the DSRM process instantiated for our research in particular, with the results for each step depicted there:
Figure 1 - DSRM Process Model, adapted from Peffers (2007)
As shown in figure 1, we started with the problem identification and motivation phase, where we define a specific research problem and justify the value of a solution. This step is crucial in order to develop an artefact that can effectively provide a possible solution. We considered an unsolved prob-lem, without an effective or efficient solution (Chapter 3).
Then we infer the objectives of a solution from the problem definition, related work (Chapter 4) and knowledge of what is possible and feasible. The objectives should be inferred rationally from the prob-lem specification and can be quantitative or qualitative. Not all probprob-lems become objectives, since a solution may only intend to partially resolve them since design is an incremental process (Chapter 5). On the design and development step we propose an artefact aimed to satisfy the solution’s objec-tives of the research problem. A design research artefact can be any designed object in which a con-tribution is embedded in the design. An artefact may be a construct, model, method or an instantiation. It can also be a new property of technical, social or informational resources (Chapter 6).
The demonstration step specifies how we will use our artefact to solve a real and practical problem, similar to the research problem, in order to assess the practicability and efficacy of our proposal. This can be done through simulation, experimentation and case or field studies. It should be clear in this step how to use the artefact to solve the problem (Chapter 7).
6
8
Chapter 3
Research Problem
This chapter corresponds to the first DSRM step: problem identification and motivation. We will start by presenting the problems that raised awareness to this research and motivate for their solution. Lastly, we present the research question that was based on the problems defined and was used as the guideline for our research.
In the aftermath of the global financial crisis, a perception took hold that a gradual but steady return to economic stability and growth was underway, so the business agenda of corporate boards shifted from cost reduction to growth (Accenture, 2012). However, over the last few years, business confidence has been shaken by a series of shocks, ranging from the euro-zone crisis to the Arab Spring. These have combined with wider economic uncertainty to put cost reduction back on the board agenda. As one of enterprises’ most significant areas of expenditure, IT is ever in the spotlight. Since 2009, cost reduction has been number one in the top 10 of IT Management concerns, except in 2011 due to an expected economic return (Luftman & Derkensen, 2013). As we may easily understand, there has been a continuous trend in lowering the IT budgets or keeping them flat in the last years (Luftman & Derkensen, 2012).
More and more IT is the backbone of global operations and an enabler of new revenue-generating capabilities, but needs to demonstrate its value in more meaningful ways to the business to justify investments in it (Novosel & Reeves, 2013). The fast ongoing development of IT, along with the global-ization trend, has had significant influence in the way organglobal-izations operate. These trends influence corporate strategies and operational decisions of organizations. Dependent on business sector, IT budgets already represent between 3% and 15% of enterprises’ revenues (IDC, 2010).
9
and cost elements are not fully identified (PricewaterhouseCoopers, 2010). Taking into account the IT Financial Management maturity model proposed by Ryan & Raducha-Grace (2010), this view corre-sponds to the lowest level, “Reactive”, where planning or visibility is lacking.
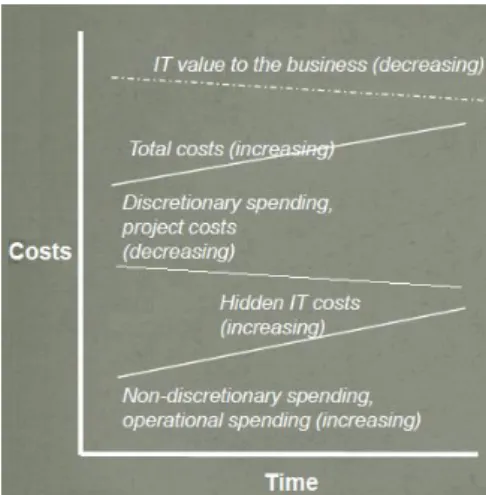
It is difficult for IT to know the true costs of running their operations mainly because of the plethora of indirect costs associated with providing IT Services. Often, the costs are not directly linked with those services, but considered part of the overall costs of internal IT operations or possibly the broader com-pany. With figure 2 we intend to graphically show the impact of poorly managed costs over time.
Figure 2 - IT Unmanaged Cost versus Time problem (Cassidy & Cassidy, 2010)
A discretionary cost is a cost that can be curtailed or even eliminated in the short term without having an immediate impact on the short-term profitability of a business (Shim & Siegel, 1999). As hidden IT costs increase and discretionary spending decreases, the value of IT to business also decreases, as expected. Instead, hidden cost should become more and more revealed and total costs slowly de-creased.
Business users are demanding greater IT cost transparency and financial analysis in order to under-stand the true cost of service operations. They believe this transparency and analysis is critical in ena-bling them to intelligently manage demand for IT services and participate in cost management deci-sions (O'Neill, Mendel, & Lisserman, 2009).
Although IT professionals’ understanding of the business and the business’s understanding of IT both need to be improved, to ensure strong IT and business alignment, business understanding of IT is weaker (Luftman & Ben-Zvi, 2009). Questions such as “Why can’t IT provide better services?” or “Why such a high budget for IT?” arise from the lack of understanding and demonstrate the dissatisfaction of their users. If the real costs are known then it is possible to justify the budget and the services’ quality, clarifying business.
im-10
prove. Some services might be reimbursed while others incur in losses, and the imposing of arbitrary spending limits at departments or particular expenses usually achieves marginal savings, leading of-ten to poorer outcomes and higher total costs (Kaplan & Porter, 2011).
To gather that cost information organizations normally resort to Cost Accounting. The issue with tradi-tional Cost Accounting is that its results have a very large granularity, not giving detailed information, and normally it is only focused on mandatory state-demanded reports (Hicks, 1999). When it comes to calculating the cost of a product or service, traditional methodologies provide inaccurate values, some-times leading to bad decisions (Lambert & Chen, 1996). They are normally inaccurate because of a wrong distribution of overhead costs, that have grown from being minor to being the major slice of costs (Škoda, 2009).
From all the issues raised so far, we can extract our research problem: it is difficult to calculate IT Services costs with precision, easily and cheaply.
In the context of this research, although reckoning that efforts can be made on the side of cost or rev-enue, we will focus only on costs. This goes along with an observed trend: organizations in general are trying to be more efficient and to be more cost-aware instead of just raising prices, since it is less sustainable.
The majority of current and future business models are relying on the involvement of IT resources. Rapidly changing markets require a constantly adaption of business processes which leads to higher requirements for the IT organizations within enterprises. The rapid growth of IT investments increased the pressure on management to monitor investment risks and track payoffs in decision making pro-cesses (Kim & Sanders, 2002). This stresses the importance of clearly weighing benefits of IT invest-ments against its costs. Therefore, controlling IT costs and resources is an essential part of IT man-agement (Hamel, Uebernickel, Brenner, & Herz, 2010).
Put in a nutshell, the outlined increasing importance of IT influences significantly the strategic, tactics and operational decisions of organizations (Gunasekaran, Ngai, & McGaughey, 2006). This further-more underlines that decision makers need appropriate tools and frameworks to ensure that business really benefits from IT.
In this thesis our objective is to calculate the costs of IT Services with the intent of making cost analy-sis simpler, affordable (both in capital as in expertise) and quicker. With this in mind, our research question which serves as point of departure for our research is:
─ RQ: How can we calculate the costs of IT Services easily and quickly using Time-Driven Activity-Based Costing?
11
13
Chapter 4
Related Work
In this chapter we will present an overview of concepts, methods and tools that are available and could contribute to solve the identified problem, as well as other related work such as research done about the subject, and in what aspects it differs from our proposal. After each topic where we needed to reflect between various application possibilities, we will provide a small section of discussion ex-plaining in detail the reasons behind our choices on the literature and tools to be used.
4.1 ITIL
The Information Technology Infrastructure Library (ITIL) was created by the Central Computer and Telecommunications Agency (CCTA), an office of the British government, and was first released to the public in the late eighties (Sante & Ermersj, 2009). ITIL is a set of best practices for IT Service Man-agement (ITSM) that focuses on aligning IT Services with the needs of business, and possesses the character of a branch standard (Hochstein, Zarnekow, & Brenner, 2005). Service Management is a set of specialized organizational capabilities for providing value to customers in the form of services. The capabilities take form of functions and processes for managing services over a lifecycle (Cabinet Office, 2011).
ITIL provides guidance to organizations on how to use IT as a tool to facilitate change, transformation and growth of the business. While the first version was mainly based on experience in data centres running mainframes, in 2000 a revised version (ITILv2) was launched, becoming the worldwide de facto standard for ITSM (Sante & Ermersj, 2009).
14
namely being too focused on technology (Gama, Sousa, & Mira da Silva, 2012). Now, instead of fo-cusing on the service itself, the focus lays on this life cycle, renewal and decommissioning of services, with a greater business-focused perspective (Sante & Ermersj, 2009).
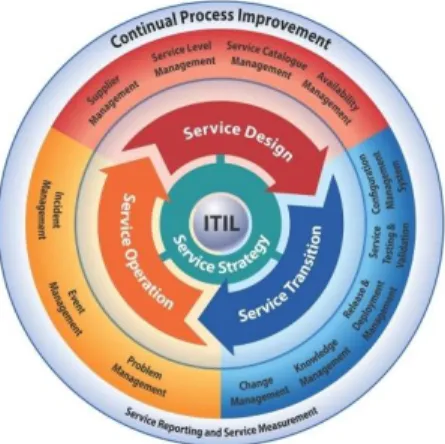
ITIL is an English language set of documents consisting of several volumes of IT management con-cepts, processes and methods (Hochstein, Zarnekow, & Brenner, 2005). The ITIL core consists of five publications: Service Strategy, Service Design, Service Transition, Service Operation and Continual Service Improvement. Each book contains the best practices related to the effective and efficient management of IT (Gama, Sousa, & Mira da Silva, 2012), and covers a phase from the Service Lifecycle with various processes that are always described in detail in the book in which they find their key application (Bon et al., 2007). Currently there are 26 ITIL processes, some of which are repre-sented in figure 3 below.
Figure 3 - ITIL Books covering the Service Lifecycle
ITIL processes help defining IT Services and ensure that they are provided in a focused and client-friendly manner. In our research we are more focused on them within the entire ITIL, to serve as refer-ence and basis for constructing the process costing templates for solving the identified problem.
4.2 Costing
15
4.2.1 Cost Accounting and Management
Cost Accounting is a systematic set of procedures for recording and reporting measurements of the cost of manufacturing goods and performing services in the aggregate and in detail. It includes meth-ods for recognizing, classifying, allocating, aggregating and reporting such costs and comparing them with standard costs (Shim & Siegel, 1999). It provides the detailed cost information that management needs to control current operations and plan for the future (Vanderbeck, 2013).
Management Accounting on the other hand is the activity developed by accounting and financial pro-fessionals to contribute to the design, evaluation and control of business processes in order for them to drive economic value. It emphasizes the use of the cost data for planning, control, and decision-making purposes (Shim & Siegel, 1999).
Cost Accounting has seen for many years seen its popularity among organizations drop. This was caused by the intensification of reports demanded by law which made companies more focused on gathering information required to create those reports (tax accounting), and then evolved to an analy-sis more focused on ratios and indicators (financial accounting) (Hicks, 1999).
4.2.2 Cost Concepts
In order to clearly understand the proposed artefact it is important to give a brief description and ex-planation of concepts related to costs.
A cost is incurred when an organization uses a resource for some purpose (Blocher, Stout, & Cokins, 2010). A cost object is any product, service, customer, activity, or organizational unit to which costs are assigned for some management purpose. Costs can be classified according several characteristics. For example, they can be divided by their nature (if they are labour, material or expenses), traceabil-ity (direct cost if can it be economically traced to a cost object, such as a material, or indirect if not, such as a Quality Control); by behaviour: fixed if the total cost does not change with volume (e.g. rental) while variable costs are those that are affected by volume (e.g. material).
Often, costs are collected into meaningful groups called cost pools. The assignment of costs to cost pools is called cost allocation and is done according to cost drivers. In the context of this research it is also important to define the concept of product cost and period cost. Product costs are those nec-essary to complete the product: direct costs and overheads related its production. Period Costs are all non-product expenditures of the organization, such as managing and selling the product. The sum of these two is called the total cost. In this research we try to apply period costs to product costs, this way distributing total costs by cost outputs.
16
4.2.3 IT Financial Management
IT Financial Management is a powerful process to improve service while lowering costs. It is the pro-cess of overseeing IT expenditures, with the goal of providing both business units and IT departments with a common framework to evaluate services and plan for future investments to optimize IT spend-ing (Ryan & Raducha-Grace, 2010). ITIL refers to this activity as Service Valuation, whereby each service is valued based on the cost of the service and value added by both the IT service provider and the customer’s own assets (Cabinet Office, 2011).
As technologies become more complex, the financial management of IT investments has proven chal-lenging. Many IT organizations lack financial management experience. Similarly, business units often lack a clear understanding of the technology enabling a given IT service. As a result, many organiza-tions find it challenging to develop a budget to expand a given service, account for costs, or charge for services. Many also lose opportunities to maximize their return on investment for IT resources as the management of budgets and tracking of IT utilization and costs fail to occur (Ryan & Raducha-Grace, 2010).
The three basic IT Financial Management activities that an organization should have in place to cost-effectively deliver services that customers value are accounting, charging, and budgeting (Ryan & Raducha-Grace, 2010).
IT accounting helps an organization monitor IT expenses against budgeted goals and prevent budget deficits and losses. By identifying the true cost and benefit of services, an organization can conduct service valuation analysis and optimize its investments in the highest value services (Cabinet Office, 2011). IT accounting provides an organization with a standard language that internal and external cus-tomers’ business partners and IT can use to evaluate the cost and benefits of IT services. This lan-guage includes a basis for estimating costs across services, standard rates, and standard approaches to measuring utilization of services (Ryan & Raducha-Grace, 2010).
An effective IT charging process improves customer satisfaction through transparent rates that demonstrate the value of services. From the service provider’s perspective, the IT charging process is a critical tool to influence customer behaviour to improve utilization of IT resources. This process helps modelling or forecasting demand, and plan for appropriate levels of capacity. It also helps develop a common basis (rates) to discuss the value of IT with internal and external customers. The IT budget-ing process enables an organization to maximize IT investments by evaluatbudget-ing its portfolio of projects based on common financial methodology. The IT budgeting process is also critical to any cost savings efforts because it helps identify areas of costs savings by comparing budgets (Ryan & Raducha-Grace, 2010).
17
the charging process. As an organization’s financial management process matures, these practices will become increasingly linked (Ryan & Raducha-Grace, 2010).
Organizations can be divided into four levels of IT Financial Management practice maturity. Those levels are best described by the organization’s view of IT: the reactive organization, the cost centre, the profit centre, and the business partner (Ryan & Raducha-Grace, 2010). The maturity model identi-fies an organization’s current IT Financial Management practices as one of these four maturity phases based on the current financial management practices and tools applied to IT resources. These phases reflect industry best practices, evidence from industry and academic research, and a range of case studies (Ryan & Raducha-Grace, 2010). The following list summarizes each of the phases:
̶ The reactive organization is the least mature IT Financial Management organization and views IT as an unpredictable cost. These reactive IT Financial Management organizations have little visibility or accountability for IT costs. They lack effective accounting, charging, and budgeting for most IT expenditures.
̶ The cost centre views IT as an expense. These organizations generally do not value services or seek to optimize their investments. Within these organizations, IT is viewed as a cost re-covery organization, and its budget is designed to match revenue with costs, with no profit. ̶ The profit centre views IT as a positive return on investment. Within these organizations, the
IT budget is evaluated based on its business impact, similar to any other capital expenditure. This organization aligns its financial management activities with its customers and services. The IT department works closely with the business units to develop a transparent charging methodology, which may be based on actual utilization of IT resources.
18
Communicating key benefits of an IT Financial Management improvement initiative to the IT depart-ment, customers, and internal partners is critical. Emphasizing these benefits to the IT staff will help them participate more actively in the initiative. Showing them this type of information can help them understand that this IT Financial Management improvement initiative will provide them with significant benefits (Ryan & Raducha-Grace, 2010).
ITIL Financial Management
We briefly present the ITIL process that intends to encompass the concepts introduced in the last sub-chapter. The growing concern about costs is reflected throughout ITIL framework. One of the major benefits of adopting it is to have known and manageable IT costs, to ensure the business better plans its finances (Kneller, 2013). Modelling and understanding the resources and costs required to deliver the IT Services leads to better decisions around cost savings and investment (Lacey, 2009).
The Financial Management process, which is part of the Service Strategy book, is particularly im-portant to describe within this costing section (Cabinet Office, 2011). The main goal of this process it to optimize the cost of IT Services while taking into account quality and risk factors (Cabinet Office, 2011). Among others, it is concerned about the creation of awareness of internal cost allocation, re-duction of costs and simplifying the accounting data collection. It is based on financial and accounting principles, but addresses specific principles that are applicable to IT Services, such as fixed asset management. It contains three sub-processes: budgeting, IT Accounting and charging.
In our research we are more focused on the second, IT Accounting, because it is concerned with the amount of money spent in providing IT Services. It takes major importance in order to be able to de-termine the costs for each customer, service, activity, etc., using the cost concepts explained in the beginning of the section in order to reach its processes goal.
4.2.4 Activity-Based Costing
Activity-Based Costing (ABC) is a methodology that identifies the activities that a firm performs and then assigns indirect costs to products. It was in the manufacturing sector of the U.S. during the 70s and 80s, that the first concepts of ABC were developed. In these decades, the Consortium for Ad-vanced Manufacturing-International, now known as CAM-I (CAM-I), studied and formalized the princi-ples that came to be known as Activity Based Costing. It then was clearly defined in 1987 by Robert S. Kaplan and W. Bruns, as a chapter of the book Accounting and Management: A Field Study Perspec-tive (Kaplan & Bruns, 1987).
19
services, we consistently make decisions based on inaccurate data, especially if the company produc-es various products or provide multiple servicproduc-es, such as IT.
The methodology aims to solve the problem related to the ability to trace overhead costs (e.g. Ac-counting, Marketing) to activities done within the organization that must reflect their cost on the organ-ization’s products and services. That is, those outputs give rise not only to functional activities that directly contribute to their production, such as manufacturing, but also to support activities that are needed inside the organization.
ABC can be defined has having five main steps: identifying the activities performed by the company; calculate the costs associated with each activity for a financial period; identifying each activities’ cost driver; calculate the rate of each cost driver using the average of each instance of the cost driver; final-ly, divide the cost of each activity by products, according their cost drivers usage.
The main advantages about ABC are:
̶ Identifies activities that do not add value and cost reduction opportunities ̶ Details clients’ profitability
̶ Allows more accurate decision making. On the other hand, the main disadvantages are:
̶ Need for lengthy and costly interviews and surveys to collect data required, at the beginning and every time the model requires updates (Kaplan & Anderson, Time-Driven Activity-Based Costing, 2004)
̶ Use of subjective and costly-to-validate time allocations
̶ As the activity dictionary expands the demands on the computer model escalate dramatically.
4.2.5 Time-Driven Activity-Based Costing
An alternative approach for estimating an ABC model, which is called Time-Driven Activity-Based Costing (TDABC), addresses the limitations described above. TDABC is a costing methodology devel-oped to calculate the profitability of services/products with a strong emphasis on allocating overhead costs to these cost outputs. It is simpler, less costly, and faster to implement, and allows cost driver rates to be based on the practical capacity of the resources supplied (Kaplan & Anderson, 2004). Like its name suggests, TDABC is based on the cost of activities (inherited from ABC) unlike traditional methodologies that were normally linked only to products as a whole; therefore it is more flexible and provides more detailed information.
20
divided by its capacity (which is normally expressed in time) and; 2) Time required to perform a given task.
It is important to mention that the first parameter uses the practical capacity of the resources, instead of the theoretical. There are two possible ways of measuring practical capacity. The most simple is to estimate practical capacity as a percentage of theoretical capacity, including personnel time for breaks, arrival and departure or machine downtime due to maintenance for example. The other possi-bility is to measure practical capacity, by obtaining historical data of activities and taking in considera-tion fluctuaconsidera-tions that can occur in certain periods (such as excessive delays, poor quality, overtime, or stressed employees). This number is then used as the estimate for capacity of resources that perform that activity.
TDABC allows two methods for obtaining the second parameter: by an estimation of the time an activi-ty takes to be performed or by using transactional data gathered from software such as ERP’s. The first procedure uses an estimate of time, replacing the ABC process of interviewing people. The time estimates can be obtained either by direct observation or by interviews, rough accuracy is sufficient. The second method makes use of transactions occurring in the organization, which record given times and other important data which can be fed into the costing methodology parameters.
An analysis to the results obtained by the model can reveal the costs of both used and unused re-source capacity. Rather than only reducing unused capacity, managers can choose to reserve that capacity to sustain future growth. They can forecast how much the business can handle with the exist-ing capacity and if capacity shortages happen. On the other hand if the used capacity is above the given capacity it may indicate over-usage. On both cases the delta between capacity and usage may also indicate errors in the model.
So, having these values, it is possible to calculate the cost of a particular activity by simply multiplying the time taken, which is the most used capacity unit, by the unit cost.
In terms of flexibility, TDABC introduces time-equations to solve the problem of ABC wherein each activity reflects only one factor/condition (Dejnega, 2011). If in the latter for each small variation in an activity there was the need to create a new and independent activity, in TDABC linear equations are used to model the different times taken by an activity in each of the variations it can have and there-fore the different consumption of resources.
In order to demonstrate the differences between ABC and TDABC in a practical way, we take as an example a simplified IT Helpdesk incident resolving that takes longer if there is a need to do a survey to the requester. In ABC there would be two activities: one for standard resolving and one for resolving with a survey. In TDABC it is possible to express this variation with the following equation:
Helpdeskincident= 15+4*γ γ=1 if logging ∪ γ=0 otherwise
21
This equation represents that the time taken by the activity is 15 minutes (also called standard time) plus 4 in case of logging required. If we multiply the result of this equation by the unit cost of the de-partment in which the activity is performed (e.g. Technical Services Dede-partment) we get the activity cost.
4.2.6 Other Costing Methodologies
There are other costing methodologies, such as Just-In-Time (JIT) Costing, which is directly related to the JIT production strategy where inventory is minimized and quality improved by coordinating the receipt of materials and the delivery of product with the manufacturing processes (Blocher, Stout, & Cokins, 2010). In this methodology, for example, direct labour costs and factory overhead costs are not tracked to specific orders (Shim & Siegel, 1999), which is not interesting for this thesis. Another example is Lean Accounting that uses Value Stream Costing, where there is little or no overheads (Maskell & Baggaley, 2006), which, again, does not provide detailed cost information. Yet another methodology is Absorption Costing, which is not much exact and generates doubtful information based on the way it allocates indirect costs (Cooper & Kaplan, 1987).
We decided to focus more on Activity-Based methodologies like ABC and TDABC from the beginning, since our objective is to calculate business process costs, and some of these are focused on value (e.g. Lean), others focus more on quality (e.g. JIT), and so on. Also, there is a clear parallelism be-tween the activities defined in those methodologies and tasks/activities in business processes which will make the connection between the diagrams and the costing template easier.
4.2.7 Discussion
The first decision made regarding costing methodologies was to go with an activity-based methodolo-gy, for the reason stated upon the justification of BPMN, which will be presented in the next section, as the language to be used: there is a clear parallel between tasks/activities in business processes and activities in costing methodologies.
With these criteria the only options become ABC or TDABC. We chose to use TDABC mainly due to the following reasons:
̶ Its easily updated to reflect changes in processes, order variety, and resource costs
̶ Time-Equations allow to keep models simple and contribute to BPMN by expressing not only the activities’ cost but also the total process cost, no matter what flow is followed by each transaction since all conditions are expressed in the equation
22
4.3 Business Processes
In this section we will provide a brief context on business processes and related concepts that are fundamental in our thesis. We will explain what is Business Process Modelling, Business Process Management, Business Process Standardization and Business Process Reengineering and how they are linked together and relate to the BPM cycle. Afterwards we describe relevant business processes modelling languages.
A business process, according to Davenport, is a structured, measured set of activities designed to produce a specific output for a particular customer or market, having a specific ordering of work activi-ties across time and space, with a beginning and an end, and clearly defined inputs and outputs (Davenport, 1993). ITILv3, which was introduced in Chapter 4.1, defines Business Process as a pro-cess that is owned and carried out by the business and contributes to the delivery of a product or ser-vice to a business customer (Bon et al., 2007).
Business Process Management (BPM) aims to provide governance of the processes of an organiza-tion to improve agility and performance. It includes methods and tools to support the design, enact-ment, management and control of business processes (van der Aalst, ter Hofstede, & Weske, 2003). On the other hand Business Process Modelling is the definition of manual or automatic aspects of a business process (Chinosi & Trombetta, 2012). It basically consists on representing the business pro-cess with some notation or standard so that they can be used for analysis, execution, and improve-ment, among others.
Business Process Standardization is the effort of capturing the common activities done by organiza-tions and achieving homogenization of these processes within a firm or even multiple firms (Beimborn, Gleisner, Joachim, & Hacketal, 2009).
Finally Business Process Reengineering or Redesign can be defined as a radical redesign of pro-cesses in order to obtain improvements in cost, quality and service (Ozcelik, 2010).
23
4.3.1 Modeling Languages
In this subsection we make a brief description of some of the modelling languages or notations that were options to use in our research. Firstly we explain their main features and relevant aspects to the research and at the end we justify the choice of the language.
DEMO
DEMO stands for Design & Engineering Methodology for Organizations and is a methodology for rep-resenting, (re-)designing and (re-)engineering organization (Dietz, 2006). It is based on the theory of Enterprise Ontology, which is focused on providing an insight into the essence of the operations in organizations. By essence it is meant that this insight is fully independent of the realization and im-plementation. This level of abstraction tries to represent what is done, and not exactly how it is done, allowing stakeholders to focus on the essence (more static) and not on the detail (more variable). To achieve this, DEMO presents a set of models that allow modelling the business processes in an organization and each of these models is expressed using specific diagram types. In the context of this proposal the most relevant ones would be the Construction Model and the Process Model that represent the transactions and the processes within the organization respectively.
To create these models there is a nominal process with defined steps that starts with the description of the organization and ends with its representation. DEMO also presents itself as being essential, co-herent, consistent, complete, modular and objective and, unlike other methods, leaves no room for creativity of modellers.
ArchiMate
24
ArchiMate describes Enterprise Architecture in three layers: Business, Application and Technology. Each layer uses the services provided by the lower layers. A service is defined as a unit of essential functionality that a system exposes to its environment and is accessible through interfaces.
Since ArchiMate is more oriented to Enterprise Architecture, it does not provide the level of detail of-fered by languages used at the design level. For example, ArchiMate provides basic components to represent a Business Process, but has a more limited set than others developed specifically for this purpose. To solve this issue it is possible to have an ArchiMate model linked to one developed in a different language.
BPMN
Business Process Model and Notation (BPMN) (Object Management Group, 2011) has become the de facto standard for modelling business processes in a graphical way (Chinosi & Trombetta, 2012). BPMN aims at providing a graphical notation that is easily understandable for all stakeholders (e.g. analysts, users, developers, audit teams) to represent the steps in a business process. To achieve this it has four categories of elements: swim lanes, flow objects, connecting objects and artefacts.
Swim lanes work as a graphical separation of roles or departments, allowing to clearly identifying inter-departmental processes and to which department each activity belongs. Flow objects are events, ac-tivities, or gateways, and are elements that state what is done, in what conditions, and what triggers the events. Connecting objects indicate the flow between activities, events and gateways. At last arte-facts are used to provide additional information about the process that does not affect the flow.
BPMN was also developed to provide the possibility of being interpreted automatically, which can be valuable when there is an intention of importing Business Process Diagrams to an Information Sys-tem.
Although there is a large number of business process modelling languages available, the fact of being the most widely used and applicable to any kind of organization, makes BPMN a primary candidate for any research that requires modelling of business processes (Chinosi & Trombetta, 2012).
4.3.2 Discussion
25
DEMO is only focused on the essence of the organization (ontological layer). Although we recognize the value of this choice, a lot of transactions that will be captured by our method will be lower levels like in the infological layer. Also we believe it would be harder for stakeholders to understand its nota-tion.
ArchiMate provides the tools to model the entire Enterprise Architecture, and in fact allows to model business processes, but was not designed for that purpose. Some authors defending that for this pur-pose a more domain-specific language would be preferable (Jonkers, Proper, Lankhorst, Quartel, & Iacob, 2011). Also most of our proposal would be limited to the business layer, so when compared to BPMN, ArchiMate would not give added value.
4.4 Process Templates
A brief definition of template is "anything that determines or serves as a pattern; a model" (Dictionary.com, 2014). One clear example is a ruler, which is a template when used to draw a straight line, or a document in which the standard opening and closing parts are already filled in, and we can copy and then fill in the parts which are variable.
“Process templates” is an overarching term that describes prebuilt business process design, execution and management artefacts that accelerate time to solution. They are also known by various names, such as “solution frameworks,” “solution templates”, “starter kits,” or “process accelerators” (Dixon & Jones, 2011). Typically, process templates are graphical and are based on process flows, rules or ser-vice-oriented architecture (SOA).
Process templates are not intended to deliver 100% of a solution. Instead, they are meant to be changed by an implementer. A process template can be extended, that is, the implementer can add capability beyond what was provided by the original assets. They provide reusable process model structures that can also be adjusted or configured to accommodate unique requirements of a process. In many cases, process templates are designed to allow business stakeholders to extend the solution, not just IT personnel (Dixon & Jones, 2011).
They also serve as knowledge and resource of legacy systems for further reuse. Model template re-use improves the quality of process models by reflecting previous knowledge and experience pre-served in them. To be useful and usable, a desired process template should be easily located and adapted in a new project (Lin & Strasunskas, 2005).
26
Identification of Resources – This step consists on identifying of all the resources used in the organ-ization and creating an allocation tree that represents how they organize themselves into resource pools. This structure of resources is important to identify direct costs, and create ways to allocate overhead costs to functional departments, without losing any information. For this purpose costs are grouped into resource pools through allocation drivers (e.g. percentage). These resource pools repre-sent in some way the departments that will execute the activities.
̶ Definition of Cost Structure – The result of this step is a tree that represents the multiple levels of aggregation of cost objects that are possible starting below at the point of the trans-action and going as high as the organization. This is useful to represent at what levels the cost/profitability analysis will be done
̶ Definition of Activities – With the elicitation of resources done, the activities that are execut-ed must be identifiexecut-ed. For each identifiexecut-ed activity, the usage of resources must be modellexecut-ed. For this purpose BPMN is used and extended, so that it uses TDABC’s time-equations to as-sociate resources and their costs to activities. Each activity must be linked through the time-equation with only one resource pool
̶ Construction of Business Processes –Since the method’s goal is to maximize reutilization, the same activity can be used in several processes, so that there is no need to create for two different processes, two different activities, which in reality would be the same. With this ap-proach the creation of a business process consists on selecting the activities that compose it, and specify the conditions when they occur and their order. With the process defined, costs of the process result of the sum of the time-equations of all activities
̶ Allocate Processes to Products –The cost of products/services is the final goal of the cal-culation so in this step of the modelling phase, for each product, the processes that contribute for its creation (or contribute with costs in some other way) must be allocated to it. Once again the cost of a product will result from the sum of the costs of the processes that contribute to it ̶ Definition of segmentation groups – To conclude the modelling phase, some levels of
common of variation can be expressed inside the template. This comes from the fact that in-side some industry there is sometimes some segmentation that can be based on a number of variables. These can be geographical, regarding size or equipment. It is then possible to cre-ate packages that close the gap between the generality of the templcre-ate and the specifics of an organization.
27
4.4.1 ITIL Process Templates
In ITIL representations the modelling object is IT Service Management and the language of description is a natural language, while its processes are usually depicted as well defined sequences of activities by flow charts. There is an effort to illustrate concepts, its relationships, framework lifecycle, process-es, information management, information systems and databases through visual representations. However, it is mainly in process modelling (by flow charts or BPMN) that we see a formal representa-tion, with a known symbolic and semantic model.
Other representations to describe the remaining ITIL domains seem to lack a common, clear and for-mal notation and semantics. Besides these official books, we searched for other ITIL graphical repre-sentations.
In our research domain we have focused on ITIL processes, and tried to search some kind of repre-sentation that could be basis for a template. What we found were ad-hoc diagrams from distinct organ-izations with different notations. These were mainly in-house sketches, diagrams and flow charts ex-pressing the ITIL views of its authors. Because they are so many and so distinct, its description would be lengthy and hardly noteworthy. Additionally, we have also come across with some commercial solu-tions that seemed the most reasonable. Thus, we have chosen two to include here as an example of ITIL process templates approaches1.
ITIL Process Map (IT Process Maps GbR, 2012) from IT Process Maps is announced as "a complete reference process model, designed to serve as a guideline and starting point for your ITIL and ISO 20000 initiatives". The product is a set of process models mapped in the Business Process Model and Notation (BPMN) (Object Management Group, 2011), with processes, artefacts and events. The dia-grams have drill-down capabilities and it also has a responsibility assignment matrix (RACI) to illus-trate the participation of the ITIL roles in the various ITIL processes. It is available for several plat-forms, as Microsoft Visio or IDS Scheer's ARIS.
ITIL 2011 Process Library (Walter-Abel, 2013) from Walter-Abel Management Consulting consists of “a standardized Best Practice Process Model of the international standard ITIL with highly customiza-ble processes to fit the necessities of an enterprise in simple manner and integracustomiza-ble into the enterpris-es procenterpris-ess model”. Like the previous product, this is also modelled in BPMN, with extensive role scription and Key Performance Indicators. The free version, which we had access, showed very de-tailed ITIL processes, more than the product described above. In this case, it is only available in a plat-form, the Signavio Process Editor, which is from one of its partners.
1 IT Process Maps, ITIL Process Map, Microsoft, Microsoft Visio, IDS Scheer's ARIS, ITIL 2011 Process Library,
28
We acknowledge the value of these products from the lack of this kind of templates available but, since both are commercial, not only they are expensive but also would require some kind of consul-tancy. Moreover, and importantly, they do not have any cost representation, which is their major flaw regarding our research problem. So, somehow, they have to be adapted in order to encompass cost information.
4.5 Discussion
Here we briefly discuss the applicability of the related work collected on our research problem. Starting with costing issues, we have realized the almost inexistence of the application of the TDABC method-ology in the IT Services area. There was however one paper which applied and explained the meth-odology thoroughly, in the context of an Internet Services Provider (Adeoti & Valverde, 2012).
In that case study, time-equations were developed for all processes of the department, and one pro-cess analysis (one kind of incident) was described exhaustively to demonstrate how the methodology allows the quick determination of the most costly variations highlighting their review.
The authors conclude that “the TDABC model is able to show cost in a structural manner and is an effective tool in identification of costly processes which may then allow IT operations managers and supervisors to take critical decisions about cost control, charge-back or costing of services” (Adeoti & Valverde, 2012). This was helpful in order to have a case study, even if not complete, in which we could practice our ideas upon.
30
Chapter 5
Objectives
This chapter corresponds to the objectives definition step of DSRM, through the problem definition and knowledge of what is possible and feasible considering the related work analysis and discussion. Recalling the main research problem, we stated that it is difficult to calculate IT Services costs with precision, easily and cheaply. We have seen, among other issues raised, that currently it requires ex-pensive tools and consulting in order to analyse and calculate IT Services costs, making it unafforda-ble for a large part of organizations. Even if those projects are done, it is as a onetime project, eventu-ally getting outdated because of the additional costs required to maintain it with up to date information. The lack of transparency and visibility between IT and business users is also a critical issue, leading to a continued friction among them.
The main objective of this proposal is to present an instrument that enables IT Departments to better know their services real costs. So, we take advantage of the TDABC methodology and a language to model costs, following the guidelines provided by the ITIL best practice framework, to create templates that serve as an accelerator to calculate IT Services costs. On each IT Department certain adjust-ments surely are necessary, but the core processes are similar, so we believe those adjustadjust-ments are not major.
32
Chapter 6
Research Proposal
This chapter contains the design and development steps of DSRM, and its output is an artefact, in this case a model, which aims to contribute to solving the problems identified in Chapter 3.
Along the related work (Chapter 4), we have reserved the conclusions present in each subsection to briefly discuss the choices made for our proposal and why. Recapping those choices, we chose TDABC as costing methodology, BPMN as notation to represent business process templates and ITIL to serve as a guideline and foundation on which we base the proposal.
Therefore, based on the problem defined and the lack of suitable solutions, we propose business process templates for calculating the costs of IT Services with less effort, following ITIL guide-lines and using the TDABC methodology. To clarify the proposal sentence, we claim that the effort is less when compared to traditional costing methodologies as the ones explored in the related work chapter.
We have seen how the ITIL framework has become the worldwide de facto standard for ITSM, and how it contains several processes, that have a given purpose in each of the five ITIL Lifecycle stages. We have also seen the parallel between tasks/activities, in business processes, and activities, in ac-tivity-based costing methodologies.
33
It is possible to use each one of the two main proposal components separately (ITIL and TDABC), but it would mean a greater effort, more time and, consequently, money. The use of those components together creates synergies we believe are much more valuable than their individual use, because of all the benefits explored and discussed throughout this research. To summarize, we “fit and package” them with business process templates in order to be ready for utilization.
6.1 Thesis Boundaries
In the proposal sentence, the reference to ITIL guidelines is generic, so we need to clarify what parts of the framework will be used and why. As we have seen, the ITIL core is comprised of five books, and is then complemented with further literature. Above, we justified the use of ITIL Processes as basis for constructing the costing processes templates. Even though our proposal is generic, it is impossible, in the scope of this master thesis, to build templates for all ITIL processes, which currently are 26. Due to that, we had to choose those that have more relevance within our research and, from those, pick the ones that represent most of the activities performed in IT Services.
To do that, we used the feedback received throughout the research from IT Departments’ staff, ga ther-ing the most mentioned and relevant processes implemented there. We also sought support in related literature, and found that processes such as Incident or Problem Management are amongst the most implemented and benefit ones (Gacenga, Cater-Steel, & Toleman, 2010), and in several ITIL imple-mentation case studies they are referenced as the first to be implemented (Cater-Steel, Toleman, & Tan, 2006).
Despite in a first phase we started to construct various templates from the processes present in the ITIL Service Operation book, we decided to focus on a single one, because we soon realized that, after it has been done and proven well, it serves as reference and is relatively easy to emulate for constructing all other processes templates. Furthermore, the data IT Departments made available for our research belonged, almost completely, to a single process, limiting our proposal validation.
Gathered all the information, we chose Incident Management process, from the ITIL Service Operation book (Cabinet Office, 2011), to construct the costing process template. Incident Management is the process for dealing with all unplanned interruptions to an IT service or reduction in the quality of an IT service. Failure of a configuration item that has not yet impacted service is also an incident (Cabinet Office, 2011). Examples of configuration items include individual requirements documents, software, hardware, or plans. For example, a failure of one disk from a mirror set is an incident.
34
Incident Management is highly visible to the business, and it is therefore easier to demonstrate its value than most areas in Service Operation. This was clear when interacting and interviewing staff from IT Departments, that demonstrated greatest interest in having costing applied to this particular process.
Having clarified the usage of ITIL and the process to be exemplified in the proposal, we head to cost-ing template presentation and explanation.
6.2 Costing Template
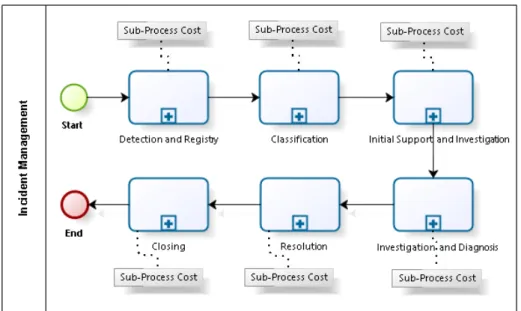
To create the template, we started a deep analysis of ITIL Incident Management process, in order to be then represented in the chosen graphical notation. The design of the template started from studying ITIL literature, case studies and available research. Soon we could also start interacting with IT De-partments, which gave us important feedback to validate and complete the template. The method pro-posed by Lourenço (2013) mentions the importance of analysing the industry field or area in detail, in order to encompass maximum information in the model. Moreover, this being the first ITIL process cost template, thus exemplary, we try to integrate aspects of the whole, which will be explained next. We will start by presenting a top view of the template with the main macro activities of Incident Man-agement (Figure 4), and then drill down one level of detail, to complete the template and its explana-tion.
The BPMN diagram below is a zoomed out vision of the ITIL Incident Management Process costing template. We grouped all the processes activities elicited into six macro activities, illustrating the most meaningful steps of this process. Each one of those is represented in this BPMN by a Subprocess that contains a set of activities, – in fact, an entire process segment. Following the diagram, we will contin-ue explaining and detailing the process template.
35
If all Subprocesses were expanded, the BPMN diagram would contain 22 activities, corresponding to the complete costing template proposed for this ITIL process. To represent costs in the template, we use the notation of the process template creation method referred in Chapter 4.4 (Lourenço, 2013). Text-annotations are used, since these are graphical artefacts which help in understanding the pro-cesses for those not so familiarized with BPMN.
TDABC methodology uses time-equations to calculate the cost of a given activity/process, through the sum of each condition that composes them. The sequence flows between Subprocesses, represented by arrows, depict the sum of each cost in order to obtain the process total cost. Thus, the template builds on a time-equation constructed for ITIL Incident Management process.
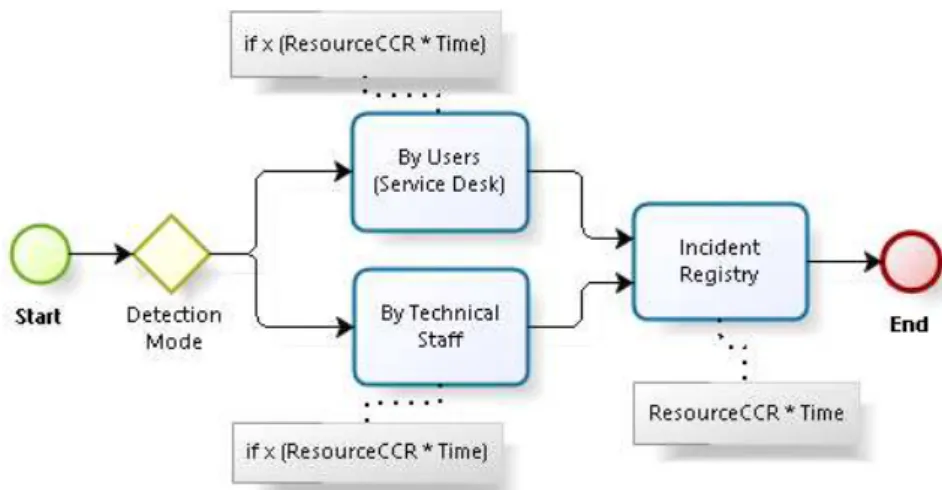
With this top-level view of the template, we intend to illustrate the graphical notation used and its par-allelism with the chosen costing methodology, as well as the ITIL guidance depicted in its activities. Now, we will drill down the Subprocesses, starting by the first one, to further explain the template. The Incident Management process can be triggered in two different ways, upon detection of an inci-dent: through Service Desk, by receiving and registering the request from users, or directly from tech-nical staff, that registers it directly. In both cases, the Detection and Registry phase is concluded with the registry of the initial data of the incident in an appropriate system. The Subprocess is expanded below, showing the flow here described.
Figure 5 - Detection and Registry Subprocess
Here we introduce time-equation conditions in the template, which allow for calculating the cost of the process. Therefore we will proceed to explaining the cost notation in the diagram and how to obtain the values needed to fill the equation.