1
Calculating IT Services Costs
Jorge Andrade – 64797
Advisor: Prof. Miguel Mira da Silva Departamento de Engenharia Informática
Instituto Superior Técnico
Abstract. The majority of current and future business models are relying on the involvement of IT resources. Always faster changing markets require a con-stantly adaption of business processes which leads to higher requirements for IT, and the crisis that affected most of the world's economy also forces organi-zations to stay efficient and competitive. The rapid growth of IT investments has put increasing pressure on managing IT costs for clearly weighing its bene-fits, but it is a very difficult venture, not only because efficient costing method-ologies are out of reach for most organizations but also because of the particu-larities of IT Services. As a solution to this problem, we propose a model using business process templates to calculate IT Services costs with much less effort and taking to account those particularities. Finally, we propose to demonstrate the model through field studies and evaluate it through interviews, Moody and Shanks Framework, Österle et al. principles and feedback from the scientific community.
Keywords: Costing, IT Services, TDABC, Templates, ITIL, Business Processes
1
Introduction
Over the past few decades, the importance of IT has grown every year in nearly every type of business (McAfee & Brynjolfsson, 2008). As this importance rises, the need for managing costs and performance of IT also increases. We have seen how the global financial crisis forced organizations to be more cost conscious. Moreover, the economic environment will continue to affect the cost of information technologies.
2 To obtain this cost information a number of methodologies were developed through-out the years. These methodologies come from the traditional accounting systems that evolved naturally to better take into account the impact of overhead costs on the total cost of products. This was where most methodologies failed (Lambert & Chen, 1996). This increased attention on overhead costs comes from the fact that the industry has evolved from manufacturing to services (Škoda, 2009), and with this transition, over-head cost has grown from residual to being the majority. If we focus on IT Services, which are our domain of research, we can easily understand how difficult it is to cal-culate their costs, because of all the overhead costs associated. Since we will refer to service many times in the report, it is important to define it, as “a means of delivering value to customers by facilitating outcomes customers want to achieve, without the ownership of specific costs and risks” (Cabinet Office, 2011).
Even though there are these methodologies that allow organizations to know what are their real costs they require time, expertise and software that is out of reach for most of them. So, they have to use traditional accounting, which often leads to unsup-ported or badly supunsup-ported decisions which in turn lead to undesirable results. On the other hand, it has been observed that the results of cost analysis done in organizations inside the same industry were very similar, suggesting that some reutilization or standardization could be achieved. This applies as well to IT Services, which are much similar from each IT Department.
As a response to the issues raised above, our research propose is to use business process templates for calculating the costs of IT Services, following ITIL guidelines and using the Time-Driven Activity-Based Costing methodology.
To evaluate the solution we will use the results from the demonstration, which will be field studies in real organizations, and compare them to the objectives of the solu-tion using interviews and quessolu-tionnaires; the appraisal from the scientific community by submitting papers; the Moody and Shanks Framework to evaluate the proposed artifact (Moody & Shanks, 2003); and the four principles proposed by Österle et al. will be used to evaluate the research (Österle, et al., 2011).
3
2
Research Methodology
The research methodology applied across this thesis is Design Science, where we intend to develop and validate a proposal to solve our problem. We chose this meth-odology because it focuses on creating and evaluating innovative IT artefacts, which will be explained next, that enable organizations to address important information-related tasks.
In order to better understand the DSRM it is important to comprehend the concept of methodology. According to Hevner et al., a methodology is a system of principles, practices and procedures applied to a given branch of knowledge (Peffers, 2008). This research methodology aims at overcoming research paradigms such as the traditional descriptive or interpretative research, in which the outputs are mostly explanatory and, one could argue, are often not applicable to the solution of problems encountered in research and practice (Peffers, 2008).
The methodology requires the creation and evaluation of an innovative and pur-poseful artefact that solves a specific problem in a specific domain, in the context of Information Systems (Hevner, March, Park, & Ram, 2004). The artefact can be de-fined as a construct (vocabulary and symbols), a model (abstractions and representa-tions), a method (algorithms and practices), and an instantiation (implemented and prototype systems) (Hevner, March, Park, & Ram, 2004).
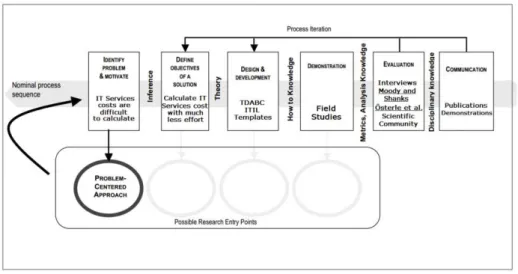
DSRM is based on a highly iterative process, which includes precise steps that need to be taken in order to produce and evaluate the artefacts. The six steps of the process mapped on the topics of our research, which is problem-centered, can be seen in the following image:
Fig. 1 DSRM Process Model, adapted from (Peffers, 2008)
possi-4 ble solution. We considered an unsolved problem, without an effective or efficient solution (Section 3).
Then we infer the objectives of a solution from the problem definition, related work (Section 4) and knowledge of what is possible and feasible. The objectives should be inferred rationally from the problem specification and can be quantitative or qualitative (Section 5.1).
On the design and development step we propose an artefact aimed to satisfy the solution’s objectives of the research problem. A design research artefact can be any designed object in which a contribution is embedded in the design (Section 5).
The demonstration step specifies how we will use our artefact to solve a real and practical problem, similar to the research problem, in order to assess the practicability and efficacy of our proposal (Section 6). This can be done through simulation, exper-imentation and case or field studies. It should be clear in this step how to use the arte-fact to solve the problem.
The evaluation step defines an evaluation method comprising interviews, experi-mentation, and scientific appraisal, for example, to evaluate if the proposal satisfies the solution’s objectives and solves or mitigates the research problem (Section 7).
To finish the process, there is the communication step. Here we communicate the problem and its importance, the artefact, its utility and novelty, the rigor of its design, and its effectiveness to researchers and other relevant audiences, such as practicing professionals, when appropriate. This step can be accomplished by submitting scien-tific papers and presenting the thesis, for example.
3
Research Problem
This section corresponds to the first DSRM step: problem identification and motiva-tion. We will start by presenting the problems that originated this research, and moti-vate for their resolution. Lastly we present the research question that was based on the problems defined and was used as the guideline for the research.
In the aftermath of the global financial crisis, a perception took hold that a gradual but steady return to economic stability and growth was underway, so the business agenda of corporate boards shifted from cost reduction to growth (Accenture, 2012), but not for long. Over the last few years, business confidence has been shaken by a series of shocks, ranging from the euro-zone crisis to the Arab Spring. These have combined with wider economic uncertainty to put cost reduction back on the board agenda.
As one of an enterprises’ most significant areas of expenditure, IT is ever in the spotlight. Since 2009, cost reduction has been number one in the top 10 of IT Man-agement concerns, except in 2011 because of an expected economic return (Luftman & Derkensen, 2013). As we may easily understand, there has been a continuous trend in lowering the IT budgets or keeping them flat in the last years (Luftman & Derkensen, 2012).
5 to the business to justify the investment (Novosel & Reeves, 2013). The fast ongoing development of IT, along with the globalization trend, has had significant influence in the way organizations operate. These trends influence the corporate strategies and operational decisions of organizations. Dependent on business sector, IT budgets already represent between 3% and 15% of enterprises’ revenues (IDC, 2010).
As business users’ expectations of IT continue to rise, many IT operations groups lack the business maturity to effectively demonstrate the business value of IT invest-ments. Normally, IT is seen as a reactive cost center, in which operating costs are not transparent, there are only spreadsheets with estimates and costs may be allocated but only at fixed levels, unrelated to their consumption.
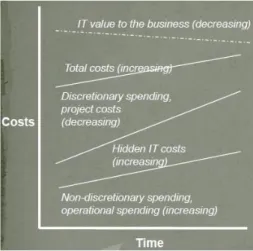
It is difficult for IT to know the true costs of running their operations, mainly be-cause of the plethora of indirect costs associated with providing IT Services that are often not directly linked with those services but considered part of the overall costs of internal IT operations or possibly the broader company.
Fig. 2. IT unmanaged Cost versus Time problem (Cassidy & Cassidy, 2010)
6 the actually performed process. The units that effectively and efficiently do their work are not rewarded, while inefficient ones have few incentives to improve. Some ser-vices might be reimbursed while others incur in losses, and the imposing of arbitrary spending limits at departments or particular expenses usually achieves marginal sav-ings, leading often to poorer outcomes and higher total costs (Kaplan & Porter, 2011).
To gather that information organizations normally resort to Cost Accounting. The issue with traditional cost accounting is that its results have a very large granularity, not giving detailed information and normally is only focused on mandatory state-demanded reports (Hicks, 1999). When it comes to calculating the cost of a product or service, traditional methodologies give inaccurate values, sometimes leading to bad decisions (Lambert & Chen, 1996). They are normally inaccurate because of a wrong distribution of overhead costs that have grown from being minor to being the major slice of costs (Škoda, 2009).
From all this, we can extract our research problem: calculating IT Services costs is difficult, but their importance continues to increase and they continue to rise.
In the context of this research, although reckoning that efforts can be made on the side of cost or revenue, we will focus only on costs. This goes along with an observed trend: organizations in general are trying to be more efficient and to be more cost-aware instead of just raising prices, since it is less sustainable.
The majority of current and future business models are relying on the involvement of IT resources. Always faster changing markets require a constantly adaption of business processes which leads to higher requirements for the IT organizations within enterprises. The rapid growth of IT investments has put increasing pressure on man-agement to monitor investment risks and track payoffs in the decision making pro-cesses (Kim & Sanders, 2002). This stresses the importance of clearly weighing bene-fits of IT investments against its costs. Therefore, controlling IT costs and resources is an essential part of IT management (Hamel, Uebernickel, Brenner, & Herz, 2010).
Putting it in a nutshell, the outlined increasing importance of IT influences signifi-cantly the strategic, tactics and operational decisions of organizations (Gunasekaran, Ngai, & McGaughey, 2006). This furthermore underlines that decision makers need appropriate tools and frameworks to ensure that the business really benefits from IT.
In this thesis we propose to calculate the costs of IT Services with the intent of making the cost analysis more simple, affordable (both in capital as in expertise) and quick. With this in mind, our research question which serves as point of departure for our research is:
─ RQ: How can Time-Driven Activity-Based Costing be used for calculating the cost of IT Services?
4
Related Work
7 proposal. After this description we will provide a small section of discussion explain-ing in detail the reasons behind our choices on the tools to be used.
4.1
ITIL
The Information Technology Infrastructure Library (ITIL) was created by the Central Computer and Telecommunications Agency (CCTA), an office of the British gov-ernment, and was first released to the public in the late eighties (Sante & Ermersj, 2009). ITIL is a set of practices for IT Service Management (ITSM) that focuses on aligning IT Services with the needs of business, and possesses the character of a branch standard (Hochstein, Zarnekow, & Brenner, 2005). It provides guidance to organizations on how to use IT as a tool to facilitate change, transformation and growth of the business. While the first version was mainly based on experience in data centers running mainframes, in 2000 a revised version (ITILv2) was launched becoming the worldwide de facto standard for ITSM (Sante & Ermersj, 2009).
In 2007, ITILv3 introduced the lifecycle principle, whereby the provisioning of services was considered to be a continuous process in which new services are brought into existence whilst others are phased out. The current version of ITIL covers the major weaknesses identified in the previous versions, namely being too focused on technology (N., P., & Mira da Silva, 2012). Now, instead of focusing on the service itself, the focus lay on this cycle of life, renewal and decommissioning of services, with a greater business-focused perspective (Sante & Ermersj, 2009).
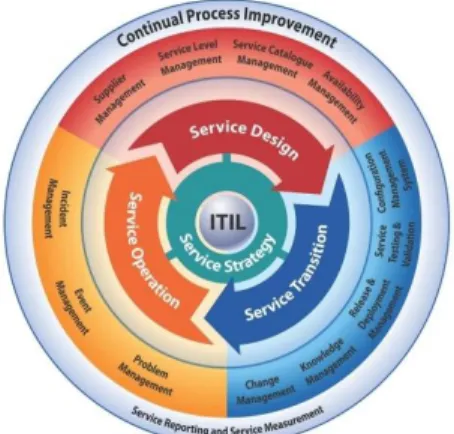
The ITIL core consists of five publications: Service Strategy, Service Design, Ser-vice Transition, SerSer-vice Operation and Continual SerSer-vice Improvement. Each book contains the best practices related to the effective and efficient management of IT (N., P., & Mira da Silva, 2012), and covers a phase from the Service Lifecycle with vari-ous processes which are always described in detail in the book in which they find their key application (Bon et al., 2007). It is an English language set of documents consisting of several volumes of IT management concepts, processes and methods (Hochstein, Zarnekow, & Brenner, 2005).
8
4.2
Costing
Firstly we will start by providing an overview of Cost Accounting and its purpose. Then, we present the main concepts regarding cost that are necessary to understand our proposal. Afterwards we introduce ITIL Financial Management process, followed by the most relevant costing methodologies that were analyzed through research. Finally we present our costing methodology choice and justify it.
4.2.1 Cost Accounting and Management
Cost Accounting is a systematic set of procedures for recording and reporting meas-urements of the cost of manufacturing goods and performing services in the aggregate and in detail. It includes methods for recognizing, classifying, allocating, aggregating and reporting such costs and comparing them with standard costs (Shim & Siegel, 1999). It provides the detailed cost information that management needs to control current operations and plan for the future (Vanderbeck, 2013).
Management Accounting on the other hand is the activity developed by accounting and financial professionals to contribute to the design, evaluation of control of busi-ness processes in order for them to drive economic value. It emphasizes the use of the cost data for planning, control, and decision-making purposes (Shim & Siegel, 1999).
Cost Accounting has for many years seen its popularity among organizations drop. This was caused by the intensification of reports demanded by law which made com-panies more focused on gathering information required to create those reports (tax accounting), and then evolved to an analysis more focused on ratios and indicators (financial accounting) (Hicks, 1999).
4.2.2 Cost Concepts
In order to clearly understand the proposed artefact it is important to give a brief de-scription and explanation of concepts related to costs.
A cost is incurred when an organization uses a resource for some purpose (Blocher, Chen, Cokins, & Lin, 2006). A cost object is any product, service, custom-er, activity, or organizational unit to which costs are assigned for some management purpose. Costs can be classified according several characteristics. For example, they can be divided by their nature (if they are labor, material or expenses), traceability (direct cost if can it be economically traced to a cost object, such as a material, or indirect if not, such as a Quality Control); by behavior: fixed if the total cost does not change with volume (e.g. rental) while variable costs are those that are affected by volume (e.g. material).
9 product. The sum of these two is called the total cost. In this research we try to apply period costs to product costs, this way distributing total costs by cost outputs.
Finally we consider capital costs, which are any type of purchase which would have a residual value as hardware or building infrastructure, and operational costs, that are day to day recurring expenses like monthly electrical invoices and salaries.
4.2.3 ITIL Financial Management
The growing concern about costs is reflected throughout ITIL. One of the major bene-fits of adopting it is to have known and manageable IT costs, to ensure the business better plans its finances (Kneller, 2013). Modelling and understanding the resources and costs required to deliver the IT Services leads to better decisions around cost savings and investment (Lacey, 2009).
Within this costing section, it is particularly important to describe the Financial Management process, which is part of the Service Strategy book. The main goal of this process it to optimize the cost of IT Services while taking into account quality and risk factors (Cabinet Office, 2011). Among others, it is concerned about the crea-tion of awareness of internal cost allocacrea-tion, reduccrea-tion of costs and simplifying the accounting data collection. It is based on financial and accounting principles, but addresses specific principles that are applicable to IT Services, such as fixed asset management. It contains three sub-processes: budgeting, IT Accounting and charging. In our research we are more focused on the second, IT Accounting, because it is concerned with the amount of money spent in providing IT Services. It takes major importance in order to be able to determine the costs for each customer, service, activ-ity, etc., using all the concepts explained in the previous section in order to reach its processes goal.
4.2.4 Activity-Based Costing
Activity-Based Costing (ABC) is a methodology that identifies the activities that a firm performs, and then assigns indirect costs to products. It was in the manufacturing sector of the U.S. during the 70s and 80s, that the first concepts of ABC were devel-oped. In these decades, the Consortium for Advanced Manufacturing-International, now known as CAM-I (CAM-I, s.d.), studied and formalized the principles that came to be known as Activity Based Costing. It then was clearly defined in 1987 by Robert S. Kaplan and W. Bruns, a chapter of the book Accounting and Management: A Field Study Perspective (Kaplan & Bruns, 1987).
An ABC system recognizes the relationship between costs, activities and products, and through this relationship assigns indirect costs (which were previously explained) to products less arbitrarily than traditional methods. If we cannot accurately calculate the cost of production, provision of products and services, we consistently make deci-sions based on inaccurate data, especially if the company produces various products or provide multiple services, such as IT.
finan-10 cial period; identifying each activities’ cost driver; calculate the rate of each cost driv-er using the avdriv-erage of each instance of the cost drivdriv-er; finally, divide the cost of each activity by products, according their cost drivers usage.
The main advantages about ABC are:
Identifies activities that do not add value and cost reduction opportunities Details clients’ profitability
Allows more accurate decision making On the other hand, the main disadvantages are:
Need for lengthy and costly interviews and surveys to collect data required, at the beginning and every time the model requires updates (Kaplan & Anderson, 2004) Use of subjective and costly-to-validate time allocations
As the activity dictionary expands the demands on the computer model escalate dramatically
4.2.5 Time-Driven Activity-Based Costing
An alternative approach for estimating an ABC model, which is called Time-Driven Activity-Based Costing (TDABC), addresses all the limitations described above. TDABC is a costing methodology developed to calculate the profitability of ser-vices/products with a strong emphasis on allocating overhead costs to these cost out-puts. It is simpler, less costly, and faster to implement, and allows cost driver rates to be based on the practical capacity of the resources supplied (Kaplan & Anderson, 2004).
Like its name suggests, TDABC is based on the cost of activities (inherited from ABC) unlike traditional methodologies that were normally linked only to products as a whole; therefore it is more flexible and provides detailed information.
To address simplicity, TDABC only requires values of two parameters: 1) Unit cost of a resource (e.g. IT Department), that can be calculated from the total expenses related to that particular resource divided by its capacity (which is normally expressed in time) and; 2) Time required to perform a given task.
It is important to reinforce that the first parameter uses the practical capacity of the resources, instead of the theoretical. There are two possible ways of measuring practi-cal capacity. The most simple is to estimate practipracti-cal capacity as a percentage of theo-retical capacity, including personnel time for breaks, arrival and departure or machine downtime due to maintenance for example. The other possibility is to measure practi-cal capacity, obtaining historipracti-cal data of activities and taking in consideration fluctua-tions that can occur in certain periods (such as excessive delays, poor quality, over-time, or stressed employees). This number is then used as the estimate for capacity of resources that perform that activity.
11 obtained by the model can reveal the costs of both used and unused resource capacity. Rather than only reducing unused capacity, managers can choose to reserve that ca-pacity to sustain future growth. They can forecast how much the business can handle with the existing capacity and if capacity shortages happen. On the other hand if the used capacity is above the given capacity it may indicate over-usage. On both cases the delta between capacity and usage may also indicate errors in the model.
So, having these values, it is possible to calculate the cost of a particular activity by simply multiplying the time taken by the unit cost.
In terms of flexibility, TDABC introduces time-equations to solve the problem of ABC wherein each activity reflects only one factor/condition (Dejnega, 2011). If in the latter for each small variation in an activity there was the need to create a new and independent activity, in TDABC linear equations are used to model the different times taken by an activity in each of the variations it can have and therefore the different consumption of resources.
Taking as an example a simplified IT Helpdesk incident resolving that takes longer if there is a need to do a survey to the requester. In ABC there would be two activi-ties: one for standard resolving and one for resolving with a survey. In TDABC it is possible to express this variation with the following equation:
15 1 if logging 0 otherwise uation 1 Time e uation example
This equation represents that the time taken by the activity is 15 minutes (also called standard time) plus 4 in case of logging required. If we multiply the result of this equation by the unit cost of the department in which the activity is performed (e.g. Technical Services Department) we get the activity cost.
4.2.6 Other Costing methodologies
There are other costing methodologies such as Just In Time (JIT) Costing (Shim & Siegel, 1999), Lean Accounting (Maskell & Baggaley, 2006), Parametric models, or even Absorption Costing (Cooper & Kaplan, 1988), among many others. Considering for example Absorption Costing, it is not much exact and generates doubtful infor-mation because of the manner it treats indirect costs.
12 4.2.7 Discussion
The first decision made regarding costing methodologies was to go with an activity-based methodology, for the reason stated upon the justification of BPMN, which will be presented in the next section, as the language to be used: there is a clear parallel between tasks/activities in business processes and activities in costing methodologies. With these criteria the only options become ABC or TDABC. We chose to use TDABC mainly due to the following reasons:
Is easily updated to reflect changes in processes, order variety, and resource costs Can be data fed from transactional ERP and CRM systems, which is important in
our research domain
Time-Equations allow to keep models simple and contribute to BPMN by express-ing not only the activities’ cost but also the total process cost, no matter what flow is followed by each transaction since all conditions are expressed in the equation Time-Driven Activity Based Costing allows calculating the efficiency of the
re-sources and not only the profitability of the products.
4.3
Business Processes
In this section we will provide a brief context on business processes and related con-cepts that are fundamental in our thesis. We will explain what is Business Process Modeling, Business Process Management, Business Process Standardization and Business Process Reengineering and how they are linked together and relate to the BPM cycle. Afterwards we describe relevant business processes modeling languages. A business process, according to Davenport, is a structured, measured set of activi-ties designed to produce a specific output for a particular customer or market, having a specific ordering of work activities across time and space, with a beginning and an end, and clearly defined inputs and outputs (Davenport, 1993). ITILv3, which is in-troduced in Section 4.5, defines Business Process as a process that is owned and car-ried out by the business and contributes to the delivery of a product or service to a business customer (Bon et al., 2007).
Business Process Management (BPM) aims to provide governance of the processes of an organization to improve agility and performance. It includes methods and tools to support the design, enactment, management and control of business processes (van der Aalst, ter Hofstede, & Weske, 2003).
On the other hand Business Process Modeling is the definition of manual or automat-ic aspects of a business process (Chinosi & Trombetta, 2012). Basautomat-ically it consists on representing the business process with some notation or standard so that they can be used for analysis, execution, and improvement, among others.
13 Finally Business Process Reengineering or Redesign can be defined as a radical redesign of processes in order to obtain improvements in cost, quality and service (Ozcelik, 2010).
The proposal of this research is a mainly focuses in the modelling and monitoring steps of the BPM Lifecycle, that also comprises the design, execution and optimiza-tion. It is used to model the processes of IT Services with special attention to their costs so that it becomes possible after their execution to monitor those same process-es. Our method should then give as output, the costs of the processes which should be useful for their optimization. This method also takes advantage of, and contributes to, Business Process Standardization, since its goal is to produce a template that captures common processes between organizations.
4.3.1 Modelling Languages
In this subsection we make a brief description of some of the modelling languages or notations that were options to use in our research. Firstly we explain their main fea-tures and relevant aspects to the research and at the end we justify the choice of the language.
DEMO.
DEMO stands for Design & Engineering Methodology for Organizations and is a methodology for representing, (re-)designing and (re-)engineering organization (Dietz, 2006). It is based on the theory of Enterprise Ontology, which is focused on providing an insight into the essence of the operations in organizations. By essence it is meant that this insight is fully independent of the realization and implementation. This level of abstraction tries to represent what is done, and not exactly how it is done, allowing stakeholders to focus on the essence (more static) and not on the detail (more variable).
To achieve this, DEMO presents a set of models that allow modeling the business processes in an organization and each of these models is expressed using specific diagram types. In the context of this proposal the most relevant ones would be the Construction Model and the Process Model that represent the transactions and the processes within the organization respectively.
To create these models there is a nominal process with defined steps that starts with the description of the organization and ends with its representation. DEMO also presents itself as being essential, coherent, consistent, complete, modular and objec-tive and, unlike other methods, leaving no room for creativity of modelers.
ArchiMate.
14 2012). One of its objectives is to describe the construction and operation of business processes, organizational structures, information flows, IT systems and technical in-frastructure. It has its origin in TOGAF (The Open Group, 2011), a standard to devel-op enterprise architectures and complements it by providing a graphical modelling language.
It differentiates itself from other modelling languages such as Unified Modelling Language (UML) or Business Process Modelling and Notation (BPMN) by having an enterprise scope. On top of this since, as mentioned, one of the goals is to describe a set of concepts each of them in its domain, normally other modelling languages focus on only one domain (for example BPMN is used for business process modelling).
ArchiMate describes Enterprise Architecture in three layers: Business, Application and Technology. Each layer uses the services provided by the lower layers. A service is defined as a unit of essential functionality that a system exposes to its environment and is accessible through interfaces.
Since ArchiMate is more oriented to Enterprise Architecture, it does not provide the level of detail offered by languages used at the design level. For example, Archi-Mate provides basic components to represent a Business Process, but has a more lim-ited set than others developed specifically for this purpose. To solve this issue it is possible to have an ArchiMate model linked to one developed in a different language.
BPMN.
Business Process Model and Notation (BPMN) (Object Management Group, 2011) has become the de-facto standard for modelling business processes in a graphical way (Chinosi & Trombetta, 2012).
BPMN aims at providing a graphical notation that is easily understandable for all stakeholders (e.g. analysts, users, developers, audit teams) to represent the steps in a business process. To achieve this it has four categories of elements: swim lanes, flow objects, connecting objects and artefacts.
Swim lanes work as a graphical separation of roles or departments, allowing to clearly identify in inter-departmental processes and to which department each activity belongs. Flow objects are events, activities, or gateways, and are elements that state what is done, in what conditions, and what triggers the events. Connecting objects indicate the flow between activities, events and gateways. At last artefacts are used to provide additional information about the process that does not affect the flow.
BPMN was also developed to provide the possibility of being interpreted automati-cally, which can be valuable when there is an intention of importing Business Process Diagrams to an Information System.
15 4.3.2 Discussion
To conduct our research we have decided to use BPMN for several reasons. Firstly, it is considered the de facto modelling language and is the most widely used. Its nota-tion is considered quite intuitive since it shares many basic elements with tradinota-tional workflows. This goes along with our objectives that are to provide a method that is understandable by all stakeholders. Lastly since it is the most used notation and our effort is to promote reutilization, the probability of a company having its processes modelled in BPMN is higher.
DEMO is only focused on the essence of the organization (ontological layer). Alt-hough we recognize the value of this choice, a lot of transactions that will be captured by our method will be lower levels like in the infological layer. Also we believe it would be harder for stakeholders to understand its notation.
ArchiMate provides the tools to model the entire enterprise architecture, and in fact allows to model business processes, but was not designed for that purpose. Some authors defending that for this purpose a more domain-specific language would be preferable (Jonkers, Proper, Lankhorst, Quartel, & Iacob, 2011). Also most of our proposal would be limited to the business layer, so when compared to BPMN, Ar-chiMate would not give added value.
4.4
Process Templates
Process templates provide reusable process model structures and they can be instanti-ated and tailored to specific requirements. They serve as knowledge and resources of legacy system for further reuse. Model template reuse improves the quality of process models by reflecting previous knowledge and experience preserved in them. To be useful and usable, a desired process template should be easily located and adapted in a new project (Lin & Strasunskas, 2005).
We have found that there is few research related to process templates and only one literature regarding process cost templates (Lourenço, 2013). It provides a method for creating a template for a particular field or industry, composed by two phases: model-ling and application. The first one is the most important in our research since it is where the field or industry is analyzed and where a generic cost model is developed using an organization in that same field/industry. It consists in six steps:
1. Identification of Resources – This step consists on identifying of all the resources used in the organization and creating an allocation tree that represents how they or-ganize themselves into resource pools. This structure of resources is important to identify direct costs, and create ways to allocate overhead costs to functional depart-ments, without losing any information. For this purpose costs are grouped into re-source pools through allocation drivers (e.g. percentage). These rere-source pools repre-sent in some way the departments that will execute the activities.
16 3. Definition of Activities – With the elicitation of resources done, the activities that are executed must be identified. For each identified activity, the usage of resources must be modelled. For this purpose BPMN is used and extended, so that it uses TDABC’s time-equations to associate resources and their costs to activities. Each activity must be linked through the time-equation with only one resource pool. 4. Construction of Business Processes –Since the method’s goal is to maximize
reuti-lization, the same activity can be used in several processes, so that there is no need to create for two different processes, two different activities, which in reality would be the same. With this approach the creation of a business process consists on selecting the activities that compose it, and specify the conditions when they occur and their order. With the process defined, costs of the process result of the sum of the time-equations of all activities.
5. Allocate Processes to Products –The cost of products/services is the final goal of the calculation so in this step of the modelling phase, for each product, the processes that contribute for its creation (or contribute with costs in some other way) must be allocated to it. Once again the cost of a product will result from the sum of the costs of the processes that contribute to it.
6. Definition of segmentation groups –To conclude the modelling phase, some levels of common of variation can be expressed inside the template. This comes from the fact that inside some industry there is sometimes some segmentation that can be based on a number of variables. These can be geographical, regarding size or equip-ment. It is then possible to create packages that close the gap between the generality of the template and the specifics of an organization.
The output of the modelling phase output is a generic template that can be later used as input for the application phase where it is instantiated for a specific organization.
4.4.1 ITIL Process Templates
In ITIL representations the modeling object is IT service management and the lan-guage of description is a natural lanlan-guage, while its processes are usually depicted as well defined sequences of activities by flow charts. There is an effort on these books to illustrate concepts, its relationships, framework lifecycle, processes, information management, information systems and databases through visual representations. However, it is mainly in process modeling (by flow charts or BPMN) that we see a formal representation, with a known symbolic and semantic model.
The other representations to describe the remaining ITIL domains seem to lack a common, clear and formal notation and semantic. Besides these official books, we searched for other ITIL graphical representations.
17 commercial solutions that seemed the most reasonable. Thus, we have chosen two to include here as an example of ITIL process templates approaches1.
ITIL Process Map (IT Process Maps, 2012) from IT Process Maps is announced as "a complete reference process model, designed to serve as a guideline and starting point for your ITIL and ISO 20000 initiatives". The product is a set of process models mapped in the Business Process Model and Notation (BPMN) (Object Management Group, 2011), with processes, artifacts and events. The diagrams have drill-down capabilities and it also has a responsibility assignment matrix (RACI) to illustrate the participation of the ITIL roles in the various ITIL processes. It is available for several platforms, as Microsoft Visio or IDS Scheer's ARIS.
ITIL 2011 Process Library (Walter-Abel, 2013) from Walter-Abel Management Consulting consists of “a standardized Best Practice Process Model of the internatio n-al standard ITIL with highly customizable processes to fit the necessities of an enter-prise in simple manner and integrable into the enterenter-prises process model”. Like the previous product, this is also modelled in BPMN, with extensive role description and Key Performance Indicators. The free version, which we had access, showed very detailed ITIL processes, more than the product described above. In this case, it is only available in a platform, the Signavio Process Editor, which is from one of its partners.
We acknowledge the value of these products from the lack of this kind of templates available but, since both are commercial, not only they are expensive but also would require some kind of consultancy. Moreover, and importantly, they do not have any cost representation, which is their major flaw regarding our problem. So, somehow, they have to be adapted in order to encompass cost information.
4.5
Discussion
Here we briefly discuss the applicability of the related work collected in our research problem. Starting with the costing area, we have realized the almost inexistence of the application of the TDABC methodology in the IT Services area. In fact we found only one paper in that context, in an Internet Services Provider (Adeoti & Valverde, 2012).
Time-equations were developed for all the processes of the department, and the pa-per describes thoroughly one process analysis (one kind of incident) to demonstrate how the methodology allows the quick determination of the most costly variations highlighting their review. The authors conclude that “the TDABC model is able to show cost in a structural manner and is an effective tool in identification of costly processes which may then allow IT operations managers and supervisors to take criti-cal decisions about cost control, charge-back or costing of services” (Adeoti & Valverde, 2012). This was helpful in order to have a case study, even if not complete, in which we could practice our ideas upon.
1 IT Process Maps, ITIL Process Map, Microsoft, Microsoft Visio, IDS Scheer's ARIS, ITIL
18 The TDABC model was specifically developed from scratch at the Technical Services Department in six months. There is no reference to any kind of templates used, that could be accelerators of the whole process. So, currently, there are no process tem-plates available for calculating the costs of IT Services. As said in the previous sec-tion, there also is not any mapping between costs and ITIL processes. The research problem raised is then not solved by any of the literature present in this section.
5
Research Proposal
Based on the problem defined and the lack of suitable solutions, we propose to use business process templates for calculating the costs of IT Services with much less effort, based on ITIL guidelines and following the TDABC methodology.
Along the related work (Section 4), we have reserved the conclusions present in each subsection to briefly discuss the choices made for our proposal and why. Recap-ping those choices, we chose the TDABC as the costing methodology, BPMN as the notation to represent the business process templates and ITIL to serve as a guideline and standard on which we base the proposal. This is reflected in the proposal sen-tence. Before explaining how they will be applied together, we will set some bounda-ries on the ITIL literature used in the thesis, with focus on its processes (Section 5.2).
This section contains both the objectives definition and the design and develop-ment steps of DSRM, and its output is an artefact, in this case a model, which aims to solve the identified problems defined in Section 3.
5.1
Objectives of the Solution
Recalling the problem, we stated that it is increasingly important to calculate IT Ser-vice costs, as they continue to rise, but it is difficult. The main objective of this pro-posal is to present a mechanism that enables IT Departments to better know their services costs. We have seen, among other problems raised, that currently it requires expensive tools and consulting in order to analyze and calculate IT Services costs, making it unaffordable for most of the organizations. Even if those projects are done it is as a onetime project and eventually it gets outdated because of the additional costs required to maintain it.
So, we take advantage of the TDABC methodology and some language to model costs, following the guidelines provided by ITIL, to create templates that serve as an accelerator to calculate IT Services costs. From department to department it surely requires small adjustments because they all have specificities, but the core processes are similar.
19 provide all the information needed for configuring and updating the model. Transver-sal to all this objectives there is obviously the underlying affordability requirement.
5.2
Thesis Boundaries
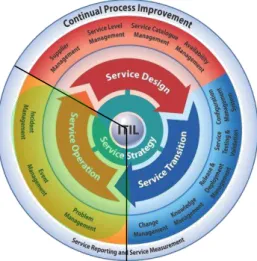
In the proposal sentence, the reference to ITIL guidelines is very generic, so we need to clarify what parts of the best practice will be used and why. As we have seen, the ITIL core is comprised of five books, and is then complemented with further litera-ture. Due to the impossibility of covering all of its elements, we had to choose those that have more relevance within our research and, from those, pick the ones that rep-resent most of the activities performed in IT Services. Since we are focused on IT operations, excluding, for example, software development, the most relevant process-es for us are in the ITIL Service Operation book (Cabinet Office, 2011), as shown below in Fig 4.
Fig. 4. Coverage of ITIL in the thesis
Although there are also relevant ones linked to operations in all other books, such as the four described in Table 1
which
are not from Service Operation,we had to narrow it down to the most representative of IT operations.20
ITIL Process ITIL Book Summary Chosen
Transition Plan-ning and Support
Service Transition
Plan a release, build, test, deploy, establish new or changed services into
production Service Validation
and Testing
Service Transition
Validate that a service is fit for purpose and for use Change
Management
Service Transition
Respond to changing business requirements while maximizing value Event
Management
Service Operation
Monitors events that occur in IT Infrastructure to allow for normal
operation and detect exceptions Incident
Management
Service Operation
Restoring services to users as quickly as possible, in order to minimize
business impact Problem Management Service Operation
Root-cause analysis to determine and resolve the cause of events and incidents, proactive activities to
de-tect/prevent future incidents
Access Management
Service Operation
Granting authorized users the right to use a service, while restricting access
to unauthorized users
Request Fulfilment
Service Operation
Management of requests that are not generated as an incident from an
unexpected delay or disruption Service Reporting
and Measurement
Continual Service Improvement
Measure the availability, reliability and performance of services and report
focused on past and future Table 1. Research relevant ITIL processes considered
5.3
Proposal
In this thesis we willpropose the usage of business process templates for calculat-ing the costs of IT Services with much less effort, based on ITIL guidelines and following the TDABC methodology. To design the templates, a deep analysis of the ITIL processes chosen was started, for them to be then represented in the chosen nota-tion, having in mind that we have firstly analyzed IT departments and only then we develop the generic cost templates.
21 information to obtain the desired detail and model it, and finally check the results once again; therefore, the process is incremental.
Another possibility is that the processes are defined, having some representation, but not following the ITIL best practice. In this case, we have to map the activities that compose them to those in the correct ITIL processes. This may be only a matter of nomenclature and structure of the process.
In both cases, and for all those departments that do not have ITIL processes im-plemented, the template carries added value, because of all the proven benefits that the best practice brings. If the department already implemented ITIL processes then the method is applied in order to add costs to the processes and model them in the notation of the proposal.
After the templates are created, they must be applied to IT departments. That appli-cation takes major importance because it allows us to improve them, as is further explained in the following sections of the report. In order to apply them we need, in each department, to gather the resources costs and then populate the cost hierarchy and replace the cost variables in the processes with the cost rate of the resources. Af-terwards, if needed, we can adjust the resource pool hierarchy, add or remove activi-ties and processes, change the drivers in the time-equations, thus reflecting the actual situation.
We will base the representation of costs in the business processes on the notation of the modelling phase of the process template creation method referred in Section 4.4 (Lourenço, 2013). Text-annotations are used, since these are graphical which helps in understanding the processes for those not familiar with BPMN. In the Demonstration section, which follows this, we provide an example of the notation used (Section 6.1).
The proposed model, consisting on the business process templates, will serve as an accelerator for the accurate calculation of IT Services costs, having in the considera-tion the objectives of the soluconsidera-tion outlined in the beginning of this secconsidera-tion. It will represent the most relevant processes of IT operations which, in turn, represent the majority of IT Departments activities. The model uses the available knowledge base, extending it in order to solve the stated problem.
The application of the model in an IT Department will allow proper knowledge of its costs with much less effort than the available possibilities discussed on the Related Work section.
6
Demonstration
22
6.1
Internet Services Provider Case Study
The first demonstration is based on a paper already referred above, in which the au-thors aim to show how Time-Driven Activity-Based Costing is applicable to the man-agement of cost of IT Services (Adeoti & Valverde, 2012). We used data present in this paper to produce, according with the DSRM nomenclature, a simulation, that is, to execute the research proposal with artificial data. In this case, we want to demon-strate that TDABC successfully calculates IT Services costs. This demonstration was done in the beginning of the research, where ITIL was not yet considered, so it was not taken into account.
From interviews with unit managers and their operations staff, a list of services were developed and linked to activities and time to execute each was provided by the operational staff. Time equations were developed from the activity groups that sup-ported each type of service. Capacity cost rates were derived by obtaining a ratio of the monthly cost of running each unit and their practical time resource capacity.
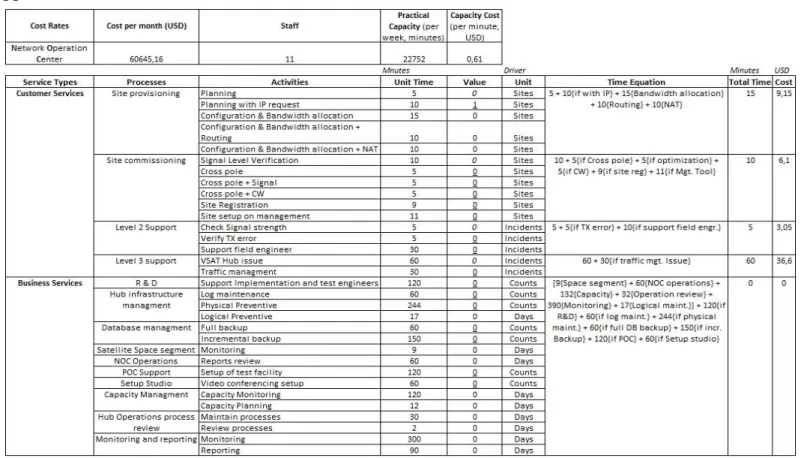
What we did was to create a working TDABC model, using Microsoft Excel (2013), which represents the services provided by Network Operation Center of the Technical Services Unit and their respective costs (Appendix A). There we can see how services are comprised by processes, which in turn are comprised by activities. Each process has a time-equation associated, with each activity having the possibility of being executed or not, depending on the instance of the process.
The model is easily updateable, reflecting changes both in the resources as in the processes when needed. In the paper, people were the only resources taken into ac-count. If more resources were added, which is the normal case, we just have to add its costs and capacity to those of the department and re-calculate the Capacity Cost Rate, which will change the process costs when those resources are used.
In order to better demonstrate the proposal, we provide the Site Provisioning pro-cess, annotated with costs, in Fig.3. It prepares the addition of a new customer on the network. The process requires information about the medium of connection and the customer’s proposed bandwidth. Other re uired variation for setting up can be the need to configure an IP address, setup some routing or Network Address Translation (NAT) configuration on the access network routers.
Fig. 5. Site Provisioning Process
To clarify the image, the word “Sites” present in text-annotations refers to the number of sites that require those activities. So, each can be performed zero or more times.
23 6.1.1 Application in a Software
After the previous model was completed, we instantiated the same data in a software being developed by a colleague in the same research group, which implements the TDABC methodology and intends to replace complex software solutions that offer cost analysis as a one-time project instead of as a service. Turning cost analysis into a service is its goal, reducing the cost of cost analysis by using cost templates.
Fig. 6. TDABC Software Dashboard
In Fig.4 it is visible that the costing methodology followed is Activity-Based, with costs flowing from resources to the final clients. Time-equations are not visible in the screenshot, but they are inside of each process, which is in turn composed by one or more activities. The cost of the process is dependent on the cost of the activities, which will depend on the resources used, and so on.
With this instantiation we obtained the same results as with the previous model but in a much more configurable, structured, complete, and visually appealing manner.
6.2
Next Demonstrations
24 We have already started to do a field study in the IT Department of the Tourism of Portugal, I.P.2. We have chosen this IT Department because it is medium sized and the services they provide are those typically provided by any IT Department in an organization. We perceived the need they have for justifying their budget values, as the constraints are increasing. This concern is transversal to all IT Departments as justified the problem motivation, especially in the Portuguese public sector.
Because our proposal is a template, where we want to capture the broader range possible of the IT Services provided within our proposal domain, we intend to do at least one more demonstration. So, we also have started to interview staff from the Institute of Informatics, I.P.3. The size of the department is bigger than the one in the first organization but, as we have already understood, the processes are very similar.
7
Evaluation
This section corresponds to the evaluation step of DSRM in which we will compare the results of the demonstration (Section 6) with the objectives of the solution (Sec-tion 5.1), to demonstrate the models’ utility, uality, and efficacy. The evalua(Sec-tion method will consist of the following steps:
Demonstrations: evaluate the proposal through its demonstration, with the feed-back obtained;
Interviews and questionnaires: collect the feedback from the proposed model through the demonstration and identify possible improvements;
Scientific community: submit papers to get appraisal of the community;
Moody and Shanks Quality Management Framework: assess the quality of the produced model;
Österle et al. principles: to evaluate the research done.
DSRM outlines five evaluation methods: Observational, Analytical, Experimental, Testing, and Descriptive (Hevner, March, Park, & Ram, 2004). In this research we will use the following: Observational, that consists of monitoring the use of the arti-fact in multiple projects; Analytical, to examine the structure and/or behavior of an artifact; and Descriptive, to build a convincing argument for the artifact's utility through the use of relevant research.
We will now explain the fundamentals of each of the steps presented, except the third one since it is easily understandable from the above description.
2 Mission: “
Tourism of Portugal is responsible for the promotion, enhancement and sustaina-bility of tourism, aggregating in a single entity all institutional powers relating to boost tourism, from supply to demand”. Source: http://www.turismodeportugal.pt
3 Mission: “
25
7.1
Demonstrations
The evaluation of the demonstration takes major importance throughout the research, as it provides essential input in order to continuously improve our proposal. We have previously defined what demonstrations are, so it is not needed here.
The Observational evaluation method, defined above, takes place along the demon-strations, and will allow for the analysis of all the feedback being given to have a critical look on the proposal.
7.2
Interviews and Questionnaires
Interviews and questionnaires are very important in the research, and need to follow a determined procedure. Firstly, they try to address the validation of the research prob-lem, the relevance of it, and the proposed method. Then the research done is evaluated from the demonstration and resulting models and improvements may be suggested. Finally, the whole model is evaluated in terms of effectiveness and efficiency, provid-ing input for the model evaluation through the framework described below. We have already conducted some interviews along the research and the feedback received is described below.
We used the model explained in Section 6.1 in unstructured interviews to better ex-plain the TDABC methodology and how it can be applied to the IT Services area. We interviewed three persons from the IT area and two persons from Economics and Accounting. For all the interviewed, the model was easily understandable, serving as a basis for the mapping with the costing methodology. They mentioned that with in-creasing complexity, that is, with more processes, activities, etc., the Microsoft Excel model would become very confusing, which was expected to arise. The ensuing in-stantiation on the software mentioned in Section 6.1.1 attenuated the concern.
The first group recognized several processes in the model to be very similar to their own, having the same nomenclature and purpose. Since the interviewed are from different organizations, it was a clear sign of how templates are appropriate to tackle the problem raised. They all gave positive feedback about the model and the proposal and were open to further demonstrate it in their organizations, two of which are de-scribed in the Section 6.2.
26 For now we will not consider those concepts as our focus is costs that are per se, as recognized by the interviewed, very hard to materialize, and provide very important information, as explained in previous sections. Nevertheless, along the field studies, we will perceive if there is the imperative need for including them in our proposal.
7.3
Moody and Shanks Quality Management Framework
Moody and Shanks Quality Management Framework proposes the following factors that we will use to evaluate our model (Moody & Shanks, 2003):
Completeness: refers to whether the model contains all user requirements;
Integrity: definition of business rules or constraints from the user requirements to guarantee model integrity;
Flexibility: is defined as the ease with which the model can reflect changes in re-quirements without changing the model itself;
Correctness: is defined as whether the model is valid (i.e. conforms to the rules of the modeling technique). This includes diagramming conventions, naming rules, definition rules, and rules of composition and normalization;
Simplicity: means that the model contains the minimum possible constructs; Integration: treats to the consistency of the models within the organization; Implementability: is defined as the ease with which the model can be
implement-ed within the project time, budget and technology constraints.
Evaluating these factors allows the assessing of the quality of the produced model.
7.4
Österle et al. principles
It is also important to enumerate and briefly explain the four principles proposed by Österle et al. to evaluate the research (Österle, et al., 2011):
Abstraction: each artifact must be applicable to a class of problems;
Originality: each artifact must substantially contribute to the advancement of the body of knowledge;
Justification: each artifact must be justified in a comprehensible manner and must allow for its validation;
Benefit: each artifact must yield benefit either immediately or in the future for the respective stakeholder groups.
27
8
Conclusion
Increasingly, the importance of IT in almost all types of business has grown, and that growth requires proper management of its costs and performance. The financial crisis raised even more concern about cost analysis and reduction, which is vital to assess an organization's performance, identify points of improvement and increase efficiency. It also pressured and presses IT departments to do more with less. The issue is that not all cost analysis produce the desired effects and those that do are out of reach of the large majority of the organizations. IT Services costs are particularly difficult to cal-culate; so, to improve, organizations need to reduce costs, but to reduce costs they have to spend money they do not have.
We have found that there is no integrated solution for calculating the costs of IT Services in a simple, affordable (both in capital as in expertise) and quick way.
Our proposal intends to group existing literature complementarily, specifically: a costing methodology (TDABC), which has many advantages such as having the char-acteristics enumerated in the above sentence; a graphical business process modeling language (BPMN), which is a commonly accepted and understood notation, and easi-ly represents the costing methodology chosen; and a set of best practices (ITIL), en-suring standardization and serving as a guideline for IT Services processes. With these, we propose to use business process templates for calculating the costs of IT Services with much less effort.
The proposal will be demonstrated with field studies in real organizations, which we have already started and received the first feedback.
We expect this research to bring valuable contributions not only for the present problems described in the report but also for future researches. The main expected contribution is the template itself, because it will serve as a great accelerator in calcu-lating IT Services costs, reducing all the costs if the cost analysis required expertise. When applying the template, departments will be applying ITIL guidelines, so it also will contribute to improving IT Service Management, and therefore IT Services quali-ty. We also expect it to improve cost modelling, with the representations that will be incorporated in the template.
We have faced some difficulties to date, such as in getting complete and reliable information from organizations in order to apply our proposal. We need certain cost information that sometimes they have never had or do not want to provide, such as wages for example. Related to that, we have also found IT budgets not containing the wages of their human resources, so some important information needed to accurately calculate IT Services costs was hard to obtain or is outside IT budgets.
It was also difficult to find reliable data in order to fully test the costing methodol-ogy, because the available literature just provides some of the data which is not enough to properly test it, even though the majority of the literature concludes that it is appropriate and has many advantages.
28 For future work we intend to create the template itself and evaluate it with the pro-posed approach. This will be done in several interactions in order to use the received feedback from one interaction to improve the next version of the model. Finally, the communication of the results to the scientific community and organizations will be done through the submission of papers and the contact with organizations during the evaluation phase.
References
Accenture. (2012). IT Cost Reduction: Using New Technology to Cut Costs Across the Enterprise.
Adeoti, A., & Valverde, R. (2012). A Time-Driven Activity Cost Approach for the Reduction of Cost of IT Services: A Case Study in the Internet Service Industry. AMCIS 2012. Americas Conference on Information Systems. Beimborn, D., Gleisner, F., Joachim, N., & Hacketal, A. (2009). The Role of Process
Standardization inAchieving IT Business Value. Proceedings of the 42nd Hawaii International Conference on System Sciences.
Blocher, E., Chen, K., Cokins, G., & Lin, T. (2006). Cost Management: A strategic emphasis. McGraw-Hill Irwin.
Bon et al., J. v. (2007). Foundations of IT Service Management Based on ITIL v3. Van Haren Publishing.
Cabinet Office. (2011). ITIL® Service Operation. The Stationary Office.
CAM-I. (n.d.). Consortium for Advanced Management – International. Retrieved from http://www.cam-i.org/
Cassidy, A., & Cassidy, D. (2010). A Practical Guide to Reducing IT Costs. J. Ross Publishing.
Chinosi, M., & Trombetta, A. (2012). BPMN: An introduction to the standard. Computer Standards & Interfaces, 34, pp. 124-134.
Cooper, R., & Kaplan, R. S. (1988). How Cost Accounting Distorts Product Costs. Management Accounting.
Davenport, T. (1993). Process Innovation: Reengineering work through information technology. Boston: Harvard Business School Press.
Dejnega, O. (2011). Method Time-Driven Activity-Based Costing. Journal of Applied Economic Sciences, 6(1).
Dietz, J. (2006). Enterprise Ontology: Theory and Methodology. Springer.
Gunasekaran, A., Ngai, E., & McGaughey, R. (2006). Information technology and systems justification: A review for research and applications. European Journal of Operational Research, 173(3), 957-983.
Hamel, F., Uebernickel, F., Brenner, W., & Herz, T. (2010). Cost & performance management of IT – a literature review. Proceedings of the Sixteenth Americas Conference on Information Systems. Lima, Peru.
29 Information Management and The Management Information Systems Research Center.
Hicks, D. T. (1999). Activity Based Costing: Making it work for Small and Mid-Sized Companies. Wiley.
Hochstein, A., Zarnekow, R., & Brenner, W. (2005). ITIL as common practice reference model for ITSM: formal assessment and implications for practice. IEEE International Conference on eTechnology eCommerce and eService, 21, pp. 704-710.
IDC. (2010). Worldwide IT Spending to Grow 3% in 2010, According to IDC's Worldwide Black Book. IDC.
IDC. (2013). IDC Portugal. Retrieved from IDC Portugal: http://www.idc.pt/press/pr_2013-02-26.jsp
IDC. (2013). IDC Portugal. Retrieved from IDC Portugal: http://www.idc.pt/press/pr_2013-05-06.jsp
IT Process Maps. (2012). Retrieved from http://en.it-processmaps.com/
Jonkers, H., Proper, H., Lankhorst, M., Quartel, D., & Iacob, M. (2011). ArchiMate for Integrated Modelling Throughout the Architecture Development and Implementation Cycle. IEE Conference on Commerce and Enterprise Computing, (pp. 294-301).
Kaplan, R. S., & Anderson, S. R. (2004). Time-Driven Activity-Based Costing. Kaplan, R. S., & Porter, M. E. (2011). How to Solve the Cost Crisis In Health Care.
Harvard Business Review, 89.
Kaplan, R., & Bruns, W. (1987). Accounting and Management: A Field Study Perspective. Harvard Business School Press.
Kim, Y., & Sanders, G. (2002). Strategic actions in information technology investment based on real option theory. 33(1), 1-11.
Kneller, M. (2013). Executive briefing: the benefits of ITIL®, White Paper. The Stationery Office.
Lacey, S. (2009). ITIL in a Recession, White Paper. The Stationary Office.
Lambert, S. J., & Chen, K. H. (1996). Overhead cost pools. Internal Editor, 53(5), 62-65.
Lin, Y., & Strasunskas, D. (2005). Ontology-based Semantic Annotation of Process Templates for Reuse. Computational Intelligence for Modelling. Norwegian Univ. of Sci. & Technol.
Lourenço, A. G. (2013). Analyzing Cost and Profitability using Process-based ABC. Instituto Superior Técnico.
Luftman, J., & Ben-Zvi, T. (2009). Key Issues for IT Executives 2009: Difficult conomy’s Impact on IT. MIS Quarterly Executive.
Luftman, J., & Derkensen, B. (2012). Key Issues for IT Executives 2012: Doing More with Less. MIS Quarterly Executive.
Luftman, J., & Derkensen, B. (2013). European key IT and Management Issues & Trends for 2013. CIONET.