1Instituto de Geociências, Programa de Pós-graduação em Geologia, Universidade Federal da Bahia – Salvador (BA), Brazil. E-mail: nelizelima.geo@gmail.com 2Instituto de Geociências, Núcleo de Geologia Básica, Universidade Federal da Bahia – Salvador (BA), Brazil. E-mail: lccgomes@gmail.com
*Corresponding author.
Manuscript ID: 20180061. Received on: 05/15/2018. Approved on: 06/27/2018.
ABSTRACT:The objective of the present study was to interpret the direction of gravitational sedimentary flows in the turbidite deposits of the Ma-racangalha Formation (Recôncavo Basin), indicating their source areas. Thus, the indicative deformational structures existing in the formation were analyzed. The structures observed ranged from brittle to highly ductile and viscous states, with a diversity of deformational styles. A total of 284 planar and linear measurements was collected in three distinct subareas, separated according to their degree of deformation. The structures found were separated into four groups according to their formation process: (i) pre-deformation structures; (ii) plastic deformation structures; (iii) intrusion structures (fluid-ization), related to either early or syn-sedimentation events; and finally (iv) brittle deformation structures, with late sedimentation. Some structures were observed to be good indicators of apparent mass movement direction, which yielded predominantly SSW directions, suggesting a partially confined flow, parallel to the main axes of Recôncavo Basin, towards its depocenter.
KEYWORDS: turbiditic deposits; deformations structures; mass movement; Recôncavo Basin.
Study on the gravitational flow directions
of the Maracangalha Formation
(Early Cretaceous), Bom Despacho, NNE
area of Itaparica Island, Bahia, Brazil
Nelize Lima Santos1* , Luiz César Correa-Gomes2
ARTICLE
INTRODUCTION
The Recôncavo Basin is located within the Recôncavo-Tucano-Jatobá Rift System. The overall orientation of this basin is N-S, with an inflexion towards ENE-WSW at its northern limit (Magnavita 1996). The origin of this system is associated with the early stages of the South Atlantic opening and Gondwana rupturing event, and the tension fields responsible for the rifting that were active between the Middle-Jurassic (175 Ma) and Early-Cretaceous (145 Ma) periods (Silva et al. 2007, Milhomem et al. 2003). According to Magnavita et al. (2005), this feature represents an aborted intracontinental rift of the eastern Brazilian mFargin.
The deposition of the Maracangalha Formation (~ 140 Ma), object of the present study, began from a
progradational lake system during the rift phase of the Recôncavo Basin. According to Guerra & Borgui (2003), the shales of the Maracangalha Formation accommodate two members whose origins are associated with gravitational and deformational facies: the Pitanga and Caruaçu Members. The origin of the Pitanga Member is believed to be associ-ated with the occurrence of slumps, while the origin of the Caruaçu Member has been related to depositional processes associated with turbidity currents.
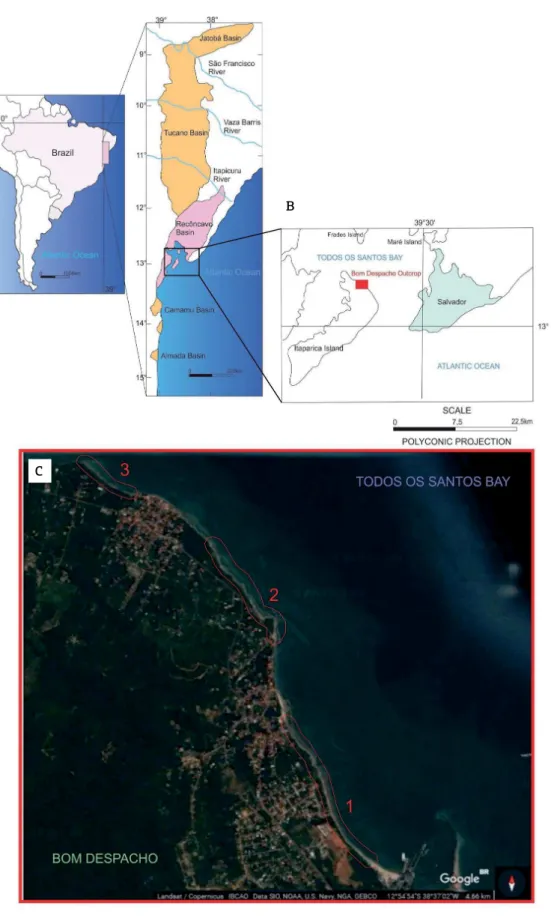
Source: Modified from Google Earth (2017).
Figure 1. Location of the study area. (A) Recôncavo Basin in relation to South America, Brazil, and adjacent basins.
Modified from Dias Filho (2002). (B) Location of the study area in Bom Despacho — Itaparica Island — Bahia,
highlighted in red. (C) Location of the subareas (highlighted in red) along the northeastern margin of the island of
Itaparica, in Bom Despacho. Image data: date of imagens: 1/23/2017; coordinate: 12º54’54”O e 38º37’02”W.
A
B
A structural and lithofaciological survey was conducted in three subareas where the best outcrops can be found, which were displayed in plan form and in profile. These subareas are located on the northeastern margin of Itaparica (Fig. 1C).
The objective of the present study was to interpret the direction of gravitational sedimentary flows in turbiditic deposits of the Maracangalha Formation by analyzing indic-ative deformational structures present in this formation. Moreover, the present study also aimed to evaluate the rela-tionship between gravitational flow patterns and the main tension fields that acted during the tectonic evolution of the Recôncavo Basin.
Thus, the present study also sought to collaborate with the knowledge on trap generation mechanisms of the petro-leum system of the Recôncavo Basin, considering that the Maracangalha Formation hosts the main gas reservoirs of this basin, which is characterized as one of the largest pro-ducers of this type of hydrocarbon in Brazil.
MATERIALS AND METHODS
Field campaigns were conducted to a general assessment of the study area and to identify relevant sections for data sampling. The whole area was divided into subareas to bet-ter organize and inbet-terpret the structures found.
Deformational structures were classified in accordance with their state (plastic, intrusion, or brittle). The crite-rion used to separate subareas was based on the intensity of deformation and on the preservation of internal structures, which will be detailed further in this chapter.
Subarea 2 comprised less deformed deposits, which pre-sented high degree of internal structuring. These deposits present primary sedimentary structures that are still pre-served, such as facies of the Bouma Sequence with parallel and cross-bedding stratification. However, sandy bodies with massive texture predominated in this subarea. These sandy packages were usually continuous and thicker, ranging between 45 cm and 1 m.
Subareas 1 and 3 comprised highly-deformed deposits, without preserved internal structures. Some sandy packages presented preserved facies of the Bouma Sequence, with parallel and cross-bedding stratification. However, defor-mational structures predominated in these subareas. Most structures used in the present study were found in these subareas, which presented structures ranging from plastic to brittle, including intrusion structures in the shape of clastic dykes.
The software StereoNet®, version 2.46 (Duyster 2000),
was used to conduct data analyses. Data were presented in this software as strike and dip roses, and frequency isodensity
diagrams, which allowed a better visualization of a larger number of integrated measurements. These diagrams were used to quantify, qualify, and analyze the main behav-ior patterns of structures sampled from the three stations. The separation into four structure families (bedding, fold axial planes, fold axes, and clastic dykes) was based on the methodology proposed by Rossetti (1999).
Brittle-state structures were used to analyze tension fields, faults originated by folds, and contraction duplexes in shear zones, by means of the software FaultKinWin (Almendinger 2001).
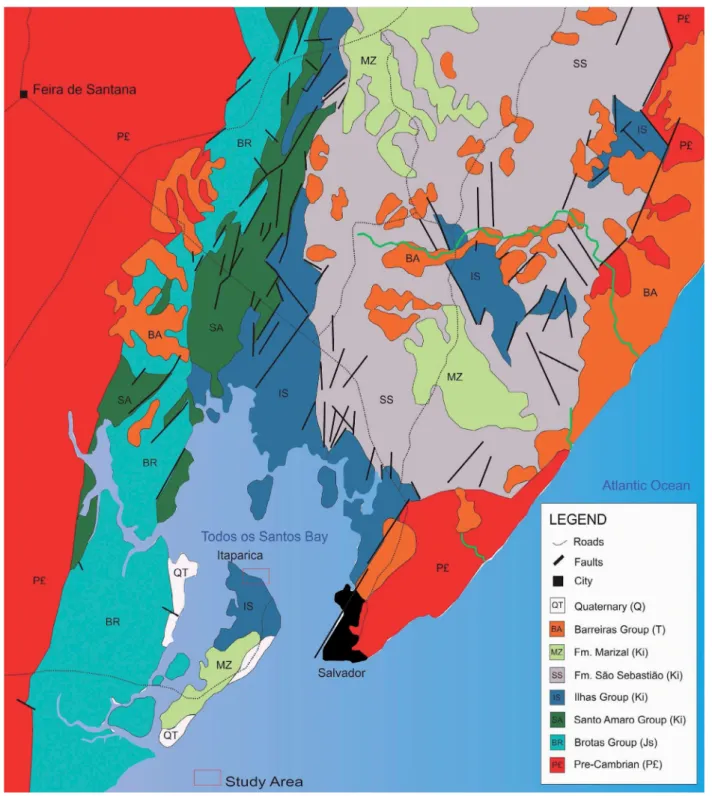
GEOLOGICAL SETTING
The island of Itaparica is part of the Ilhas Group (Barbosa & Dominguez 1996, Magnavita et al. 2005) (Fig. 2). The study area, located between the settlements of Bom Despacho and Amoreiras (northeastern area of the island), is composed of the Maracangalha Formation, which is above the sediments of the Candeias Formation, by discordant contact and gradually changing to the top into the Marfim and Pojuca Formations through either interdigitated or con-cordant contacts (Almeida 2004).
The Maracangalha Formation, in the study area, is mainly represented by grayish shales and interleaves of sandstones of the Caruaçu Member, which presents the best reser-voirs of this formation (Guerra & Borgui 2003). According to Milhomem et al. (2003), the Maracangalha Formation trans-lates the maintenance of relatively high bathymetry values during the rift phase, shown by the large volume of deposits related to gravitational flows that characterize the Caruaçu and Pitanga Members. The sandstones of the Caruaçu Member have been interpreted as flow-turbidites of the Maracangalha Formation, which originated from underwater gravitational processes (Teixeira Netto & Oliveira 1985).
A model for the turbiditic lobes deposited at the rise of deltaic slopes was proposed by Zalán et al. (1991). These authors considered that these lobes would have orig-inated from the north and then prograded into the basin, representing the main sources of sandstones in the study area. Still according to their study, the action of seismic activities in the delta front would have carried sediments to deeper areas of the basin, through turbidity currents.
For Guerra & Borghi (2003), the Maracangalha Formation was deposited in a paleoenvironmental context involving lake deltas dominated by river floods, which evolved from a ramp morphology into a shelf and slope configuration, in which the Caruaçu Member would have been formed by turbiditic flows.
Valadão (1991) accepts the Submarine Ramp Facies Model (Heller & Dickinson 1985) as the best representation of the paleoenvironmental conditions for turbidite deposi-tion in the island of Itaparica (distal ramp), where currents were fed by delta systems with strong depocenter control, confining thicker bodies to a SW direction. Moreover, this
Source: Magnavita et al. (2005).
author suggests the action of high- and low-density currents, active during the deposition of these sedimentary packages.
Structural and lithofaciological studies will be approached in the following sections in view of their importance to deter-mine the type and direction of the gravitational flow respon-sible for the deposition of sandy bodies in the study area.
FACIES CHARACTERIZATION
OF SEDIMENTARY DEPOSITS
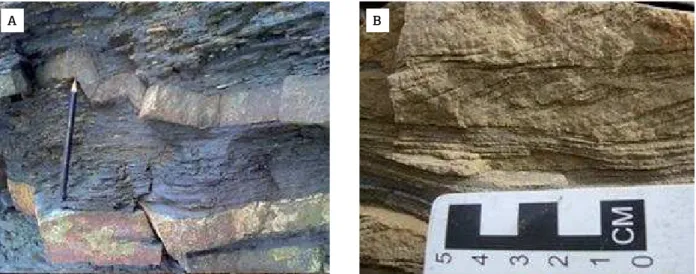
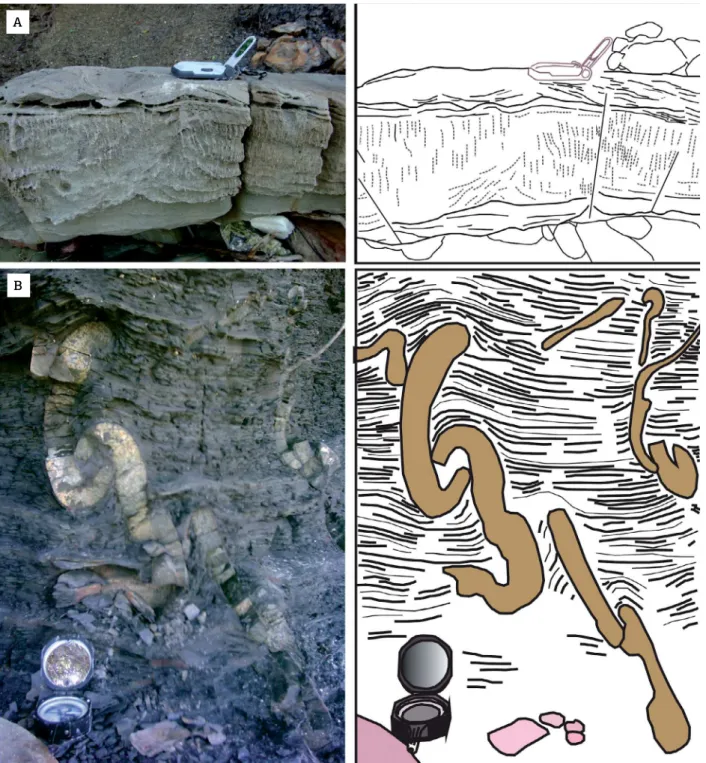
The studied outcrops of the Maracangalha Formation are basically composed of grayish and dark shales, with inter-leaved sandstones (Fig. 3A) and siltstones. These shales are well-laminated, with an overall dip ranging between SW and NE. Sandstone bodies are predominantly composed of well-sorted, fine- to medium-sized grains.
In general, sandstones are either massive or present some preserved primary structuring (Fig. 3B). They present tabu-lar and lenticutabu-lar shapes, ranging from centimetric to met-ric thickness, with lateral continuity that can reach several meters in length. Amalgamation of the sandstone layers occurred due to the loss of energy, which can be seen with the discontinuous increase of the thickness of these layers.
CHARACTERIZATION OF THE
DEFORMATIONAL STRUCTURES
RELATED TO GRAVITATIONAL FLOWS
Plastic structures were used to infer the direction of mass movements, while brittle structures were used to conduct tension field analysis.
Pre-deformational structure
Primary bedding (S0) resulted from the alternation between sandstones and shales, observed in all three sec-tions visited. This structure does not indicate the direction of gravitational flows. However, it presented varying values of dip directions between SW and NE (Fig. 4), thus indicating that layers were tilted after deposition.
Plastic deformation structures
This group encompasses syn-depositional structures produced in a plastic state, which were not influenced by the fluidization process. The structures included in this group are: intrafolial folds, cylindrical folds and sheath folds.
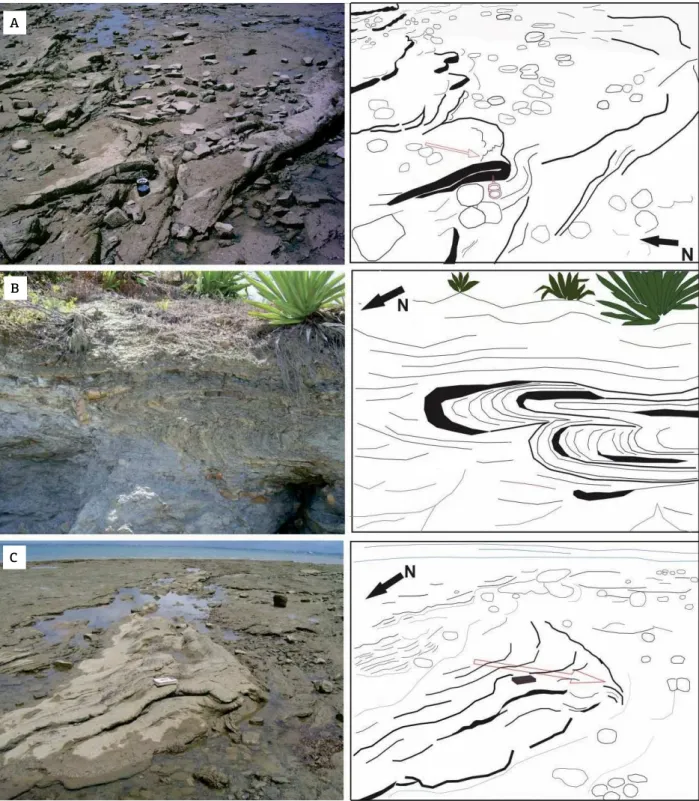
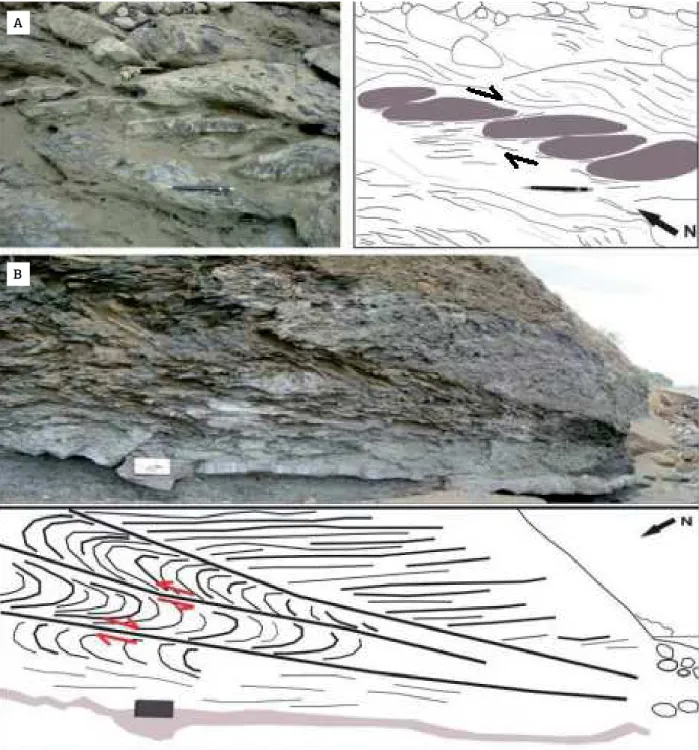
Cylindrical folds (Fig. 5A) present orthogonal axes to mass movement direction (Strachan & Aslop 2006). In the study area, these folds ranged from centimetric to metric
Figure 3. Facies characterization of sedimentary deposits. (A) Shales interleaved with sandstones. (B) Small plane-parallel and cross-bedding stratification representing facies from the Bouma Sequence in sandstones.
A B
Figure 4. Overall view of the study area showing the tilt
dimensions in extension, indicating an apparent movement direction towards SSW.
Intrafolial folds, of varying dimensions, were restricted to shear levels. These folds were usually found truncated and rootless. In the study area, they are centimetric and present an apparent movement direction towards SSW.
Sheath folds with axes parallel to the flow direction (Strachan & Aslop 2006) (Fig. 5B) were frequent in the study area, indicating an apparent movement towards either SE or NW. Transitions from cylindrical to sheath folds were observed in the study area (Fig. 5C), indicating an evolution in the type of gravitational flow.
Figure 5. Plastic-state structures. (A) Cylindrical fold in sandy sediments indicating movement towards SSW, opposed to the fold axis. (B) Sheath fold with axis positioned parallel to flow direction indicating an apparent movement towards either SSW-NNE. (C) Cylindrical fold evolving into a sheath fold, axis positioned parallel to the flow direction, indicating an apparent movement towards SW.
A
B
All these structures indicate local mass movement direc-tion, considering the preservation of deformational struc-tures that results from processes that acted on sediments when they were still in a plastic state.
Intrusion structures
These structures are syn-depositional and are related to fluidization processes that acted during sediment lithifica-tion.The host material can behave, or not, as a brittle body,
depending on the lithification stage of the system, while the intrusive material behave like a viscous fluid.
The structures found in this group were clastic dykes (Fig. 6A). These intrusions are formed by excess of fluid pres-sure on the source layer, and forced injection of the fluid/ clasts mixture in the host rock with consequent intrusion of clastic sedimentary material in the form of dykes. On study area they have an average of 10 cm in thickness and were predominantly dipped towards SE.
Figure 6. Intrusion structures. (A) Interrupted clastic dyke swarm in a grayish sandstone. (B) Folded clastic dyke presenting compacting degree of approximately 20%.
A
In general, these dykes were either tilted or presented more intense deformations, such as folds due to compacting (Fig. 6B) and fragmentation, which led some times to an irregular shape.
Brittle deformation structures
These are late-depositional structures produced under the influence of the deformations that occurred when sedi-mentary material was either almost or entirely lithified and the amount of fluids in sediments was reduced.
Contraction duplexes and reverse faults were used to analyze tension fields that acted during deposition in the basin. The contraction duplexes originated from intra-strata shear zones and were imbricated, suggesting dextral reverse kinematics (Fig. 7A).
Faults that originated from fan folds (Fig. 7B) were formed before sediments were entirely lithified (syn-depo-sitional). These faults are believed to have formed in the dis-tal portion of the gravitational flow, in compression zones,
Figure 7. Brittle deformation structures. (A) Compression duplex formed in an intra-strata shear zone. (B) Normal and reverse faults originated from fan folds in shales of the Maracangalha Formation indicating mass movement southwards.
A
demonstrating an evolution from plastic-state structures to brittle-state structures. These folds are recumbent, have both flanks dipping to the same side and indicate movement direction towards SSW.
STRUCTURE ANALYSIS
Strike/trend, dip/plunge direction, polar isodensity, and plunging rose diagrams were elaborated for planar and linear structures. Moreover, the methodology proposed by Rossetti (1999) was also followed regarding the separation into four structure families.
Beddings (S
0)
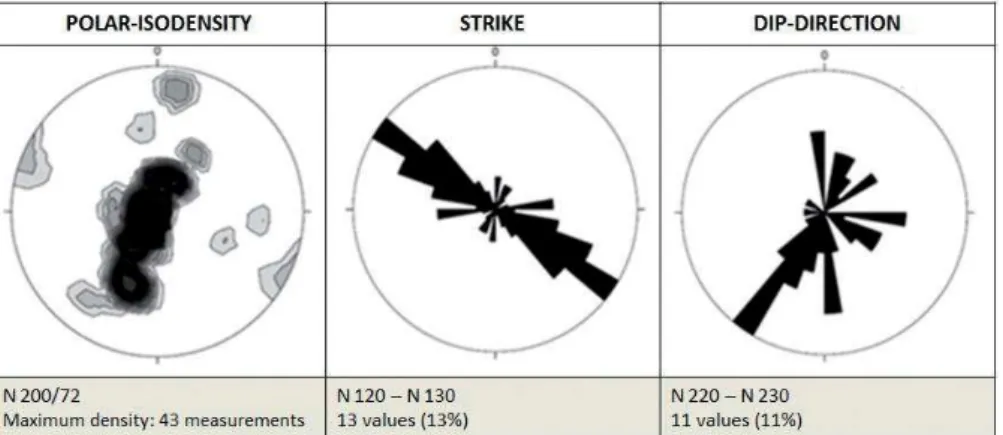
Primary bedding (S0) was placed within the pre-defor-mational structure family (Fig. 8). This structure can be observed in all three subareas, and yielded a total of 101 mea-surements. The most relevant dips of the primary bedding (S0) are positioned between N210º–N220º (SSW), with subordinate dips that range between NE and SE. This tilt may indicate that all other structures also present vergence inversions despite the maximum dip observed was lower than 30º.
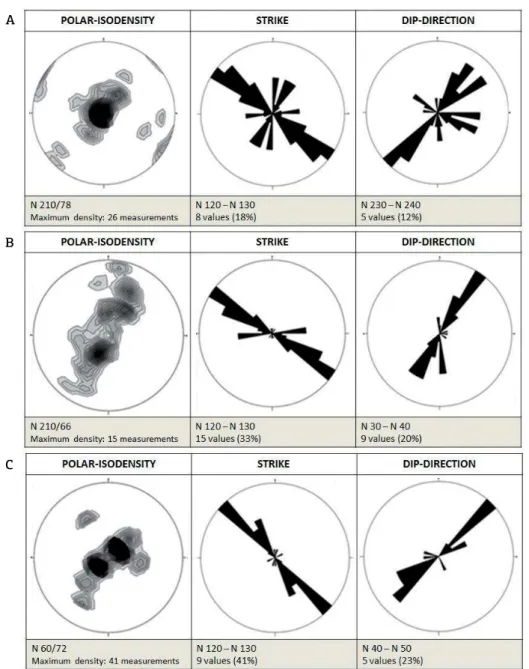
In subarea 1, the bedding surface (S0) presented a pre-dominantly SSW dip. However, since this surface is quite irregular, dips can be observed for these structures ranging from NE to SE (Fig. 9A).
The main direction of bedding-shaped structures (S0) found in subarea 2 ranged between N120º–N130º, with a NE dip. Moreover, subordinate dips towards SSE and SW were also observed (Fig. 9B).
Measurements taken for the bedding surface (S0) in subarea 3 presented preferential direction ranging between N120º–N130º, showing dips predominantly towards NE. However, dips towards SW were also observed (Fig. 9C).
Fold Axial Planes
The plastic-state structures found were represented by axial planes and folds axes (β). These structures were used to analyze the direction of mass gravitational flows.
A total of 77 measurements were obtained for fold axial planes in the three subareas (Fig. 10). Maximum pole density was found at N200º/72º. The main dip direc-tion for these structures ranged between N030º–N040º, parallel but opposite to the apparent gravitational flow movement direction (towards SW), presenting subordi-nated dips towards SW. Deformations occurred parallel to the primary bedding strike (S0), when sediments were in a more plastic state.
The strike diagram shows a more constant group of axial planes, with directions of N120º–N130º, and two other sec-ondary groups, which presented directions ranging between N000º–N010º and N060º–N070º, representing the axial planes deformed by gravitational flows.
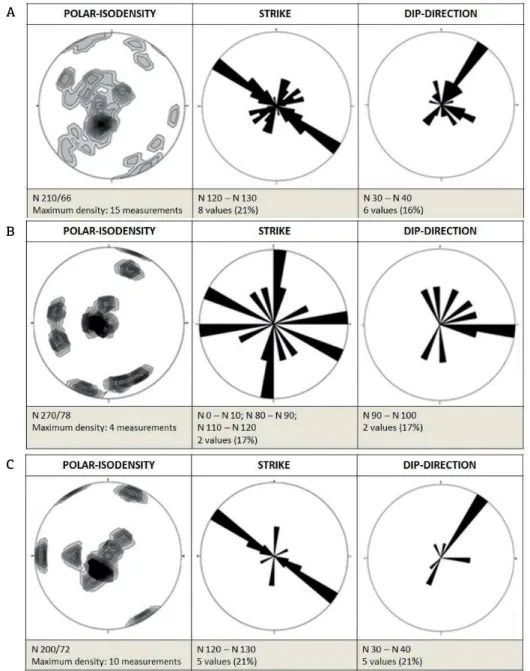
Fold axial planes in subarea 1 (Fig. 11A) presented prefer-ential direction towards N030º–N040º, with N210º/66º as the maximum value found in the isodensity diagram. These axial planes dip towards the opposite direction of the gravitational flow movement. Thus, these planes predominantly indicate an apparent movement direction towards SW; some dips rang-ing between ESE and SW can also be observed.
Axial planes in subarea 2 (Fig. 11B) presented preferential orientation towards N90º–N100º, indicating an apparent direction towards WSW. Relative radial variation (WNW– ENE) was also observed, which indicates flow directions towards SW. In subarea 3 (Fig. 11C), axial planes presented dip direction predominantly at N30º–N40º, indicating flow direction towards SW.
Fold Axes (β)
A total of 74 measurements for fold axes were obtained in all three subareas (Fig. 12). Maximum density was found at
Figure 8. Polar isodensity, strike and dip direction diagrams of planar structures that correspond to the S0 bedding.
Figure 9. Polar isodensity, strike and dip direction diagrams of planar structures that correspond to the S0 bedding.
(A) Subarea 1 (43 measurements). (B) Subarea 2 (46 measurements). (C) Subarea 3 (22 measurements). Values of N indicate preferential bedding direction.
A
B
C
Figure 11. Polar isodensity, strike and dip direction diagrams of planar structures that correspond to Fold Axial
Planes. (A) Subarea 1 (38 measurements). (B) Subarea 2 (12 measurements). (C) Subarea 3 (24 measurements). Values of N indicate preferential direction of fold axial planes.
A
B
C
N011º/24º. Field observation show that most of the measured folds have sheath geometries with less frequent cylindrical shapes.
The main direction of fold axes ranged between N190º and N200º, parallel to the direction of the mass move-ment. Subordinately, axes ranging from N010º to N020º were also observed.
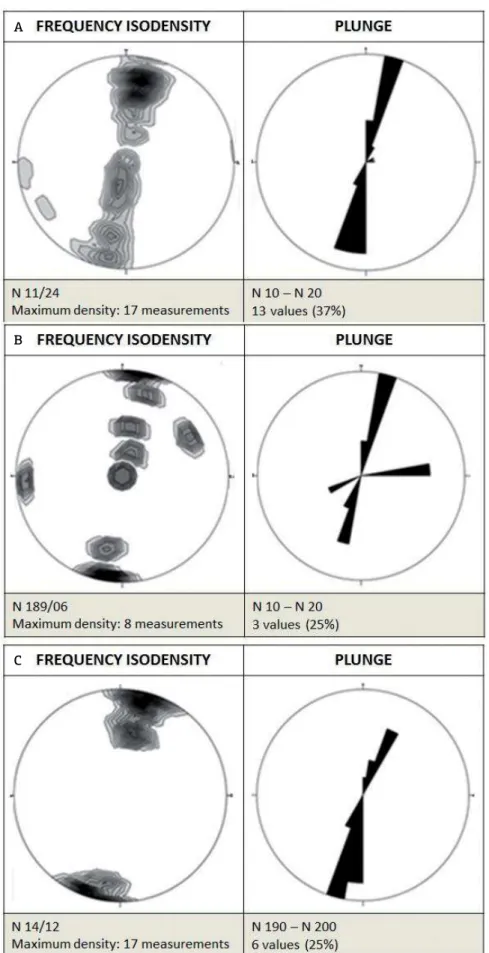
In subarea 1 (Fig. 13A), fold axes indicate an apparent movement direction towards SSW, with maximum point located at N011º/24º, and main plunge direction towards N010º–N020º. In subarea 2 (Fig. 13B), linear structures that correspond to fold axes (ß) are positioned at a maximum point located at N189º/06º. In this subarea, cylindrical and sheath folds were found in smaller numbers. The main direction of
Figure 13. Frequency and plunge isodensity diagrams of linear structures that correspond to Fold Axes (β). (A) Subarea 1 (38 measurements). (B) Subarea 2 (12 measurements). (C) Subarea 3 (24 measurements). Values of N indicate preferential direction of fold axes.
A
B
fold axes, related to sheath folds, ranged between N010º– N020º, however secondary direction of fold axes was observed towards N080º–N090º, related to cylindrical folds. The maxi-mum point of ductile structures found in subarea 3 (Fig. 13C) as fold axes (ß) was located at N014º/12º, where sheath folds predominated with main axis direction towards N190º–N200º.
All that data indicate gravitational flow movement towards SSW.
Clastic dykes
Intrusion structures were represented by clastic dykes in the study area. This structure reflects the action of exten-sional efforts during the initial stages of sediment compact-ing. The clastic dyke planes are normally orthogonal to the bedding (Borradaile 1984) and to the least compressive stress tensor (σ3) (Delaney et al. 1986).
Clastic dykes presented three preferential directions (N010º–N020º, N040º–N050º, and N120º–N130º), with preferential dip direction towards SE and subordinate dips towards NE and SW (Fig. 14).
Brittle-state structures
Brittle-state structures found in the study area were used to conduct analyses on tension fields that acted in the basin during the sediment deposition that originated from gravitational flows. Contraction duplexes that originated from shear zones, and reverse faults that originated from fan folds were used to conduct this analysis. Neither structure was highly frequent in the study area.
Reverse faults that originated from fan folds, and fold axes acted as kinematic indicators. On the other hand, contraction duplexes in shear zones were used as flow direction indicators.
Tension field analysis yielded low-angles for σ1 (N210º/19º), σ2 (N315º/46º), and σ3 (N092º/70º) (Fig. 15). The σ1 tensor presented a horizontal tendency, while σ3 presented a vertical tendency, indicating a com-pressive environment with mass vergence towards SSW.
A map depicting the main tensors (σ1, σ2, σ3) (Fig. 16A) and clastic dykes, which were considered as orthogonal to
Figure 14. Polar isodensity, strike, and dip direction diagrams of planar structures that correspond to Clastic Dykes. Total area (24 measurements). Values of N indicate preferential direction of clastic dykes.
Figure 15. Diagram of structures that indicate the action of tensors (σ1, σ2, σ3) in the study area; brittle deformation structures were used (contraction duplexes, normal and reverse faults). The red arrow
Figure 16. Tension field action. Yellow areas are the three subareas where data sampling occurred. (A) Map depicting the main structural elements that indicate gravitational flow direction (axial planes and fold axes) and bedding (S0).
(B) Map indicating the direction of the main compressive vector (σ1) related to mass movement and clastic dykes. A
σ3 (Fig. 16B), was produced to aid the visualization of ten-sion field action.
DISCUSSION
Bedding surface (S0) was measured through 101 planes. These planes presented preferential direction at N120º– N130º, with some dipping towards SW and others, NE and SE. This tilting can be explained by the presence of late fault and/or clay diapir systems.
The polar isodensity diagram regarding the pole of the fold axial planes studied showed the distribution of several large circles, which are typical of when there are cylindrical and sheath folds, indicating higher presence of conical folds (maximum density near the edge). On the other hand, the polar isodensity diagram for the fold axial planes demon-strated the evolution of cylindrical folds into sheath folds, towards SW, as expected for the mass gravitational flows (Strachan & Aslop 2006).
Fold axes yielded 77 measurements. Axes tended to become parallel to the apparent direction of the mass move-ment, with preferential directions ranging between N190º– N200º. This result suggests a flow with predominant direc-tion towards SSW. The combinadirec-tion of axial plans and fold axes data is crucial to accurately define mass flow direction. A map was elaborated depicting the deformational struc-tures (total area), axial planes, and fold axes that indicate the directions of gravitational flows and bedding (S0).
Late-deformational structures (contraction duplexes orig-inated from shear zones and reverse faults origorig-inated from fan folds) indicate an evolution from plastic-state structures into brittle-state structures.
Clastic dykes are emplaced into planes that crosscut differentially lithified rocks and/or unlithified sedimentary material. These structures support paleostress field interpreta-tions to determine gravitational flow and/or basin’s tectonic evolution. The most common triggers related to the excess of fluid pressure and to the formation of these structures are, for example: seismic activities, sediment overload, and forced migration of fluid inside basin. In rift-type basins there is even the possibility that these triggers can act in a combined way making it difficult to determine which is the most important. The studied clastic dykes presented three preferential directions (N010º–N020º, N040º–N050º, and N120º–N130º). The first two directions were considered to have originated from the filling of extensional fractures, while the third one would have originated from the filling of relief fractures of an orthorhombic system.
As demonstrated in the tensor action diagram (σ1, σ2, σ3). Fig. 16, during flow sediment deposition, the compressive
processes acting in the island of Itaparica presented behav-ior towards SSW, which was considered related to the mass movement direction.
CONCLUSIONS
The depositional context of the Maracangalha Formation encompasses underwater sedimentary gravitational flows near deltaic zones in a lake environment. The structures identified could be individualized into three main groups, in accor-dance with formation and evolution processes:
■ structures associated to a plastic-state;
■ intrusion structures, encompassing fluidization pro-cesses. Both of these structures were formed during or soon after the deposition of layers, and are evidences for the presence of water mixed with sediments, which originates plastic deformations depending of the lithi-fication state of sediments;
■ brittle-state structures associated with deformation after sediment lithification.
Two different sediment packages were identified, pre-senting individual sedimentary and deformational features: less deformed deposits where sedimentary packages were more lithified and presented small amount of fluids; and highly-deformed deposits that presented more ductile-vis-cous characteristics, with a significant presence of fluids. These different types of mechanical behavior may be related to diagenesis and/or stratigraphy, e.g., proximal and distal parts of mass flows.
The structures identified were associated with a slump flow evolution. Structures such as contraction duplexes, reverse faults, and cylindrical folds evolving into sheath folds were observed depending on the lithification degree of each material, located in the distal portion of the mass flow.
Alternations in the type of flow, from turbiditic to slump, were associated with the constant remobilization of delta fronts. This could have originated from seismic effects due to the reactivation of faults along the edge of the basin, which occurred quite intensely during the syn-rift phase.
ACKNOWLEDGEMENTS
The authors are grateful to the Geology Graduate Program of the Universidade Federal da Bahia for the sup-port during the preparation of this article. The authors also thank the Human Resource Program of the Brazilian National
Petroleum, Natural Gas and Biofuels Agency (PRH/ANP) for the financial resources provided to conduct the project. Finally, the authors are also grateful for the valuable observa-tions made by the two anonymous reviewers of the Brazilian Journal of Geology who have greatly helped to improve the quality of the paper.
Almeida J.R. 2004. Reconhecimento faciológico dos arenitos
turbidíticos da Formação Maracangalha no afloramento de Bom
Despacho, na Bacia do Recôncavo - Bahia. Trabalho Final de
Graduação, Instituto de Geociências, Universidade Federal da Bahia, Salvador, 52 p.
Almendinger R.W. 2001. FaultKin for Windows v. 1.2.2.
Barbosa J.S.F., Dominguez J.M.L. 1996. Texto Explicativo para o Mapa
Geológico da Bahia ao Milionésimo. SICM/SGM. Edição Especial,
Salvador. 400 p.
Borradaile G.J. 1984. A note on sand dyke orientations. Journal of Structural Geology, 6(5):587-588. https://doi. org/10.1016/0191-8141(84)90068-3
Caixeta J.M., Bueno G.V., Magnavita L.P., Feijó F.J. 1994. Bacias do Recôncavo, Tucano e Jatobá. Boletim Geociências da Petrobras,
8(1):163-72.
Delaney P.T., Pollard D.D., Ziony J.I., McKee E.H. 1986. Field relations
between dikes and joints: Emplacement processes and paleostress
analysis, Journal of Geophysical Research., 91, B5, 4920. https://doi. org/10.1029/JB091iB05p04920.
Dias Filho D.C. 2002. Arquitetura estratigráfica da Formação Sergi na
porção centro-oeste da Bacia do Recôncavo. Mastering dissertation,
Instituto de Geociências, Universidade Federal do Rio Grande do Sul, Porto Alegre, 102 p.
Duyster J.P. 2000. StereoNettVersion 2.46. Germany, Institut für Geologie, Ruhr-Universität-Bochum.
Guerra G.S., Borgui L. 2003. Fácies sedimentares gravitacionais e
deformacionais da Formação Maracangalha em afloramento e sua
importância na exploração da Bacia do Recôncavo. In: 2º Congresso Brasileiro de P&D de Petróleo e Gás. Anais. Rio de Janeiro.
Heller P.L., Dickinson W.R. 1985. Submarine ramp facies model for delta-fed, sand-rich turbidite systems. AAPG Bulletin, 69, 960 e 976.
REFERENCES
Magnavita L.P. 1996. Estruturas e Tectônica do Rift do
Recôncavo-Tucano-Jatobá. In:Barbosa J.S.F., Dominguez J.M.L (Coords.), Geologia
da Bahia. Texto explicativo para o Mapa geológico ao milionésimo do
Estado da Bahia. SGM. cap. XI. p. 239-259.
Magnavita L.P., Silva R.S., Sanches C.P. 2005. Roteiros geológicos, guia de campo da Bacia do Recôncavo, NE do Brasil. Boletim de
Geociências da Petrobras, 13:301-334.
Milhomem P.S., Maman E.J., Oliveira F.M., Carvalho M.S.S., Lima W.S. 2003. Bacias Sedimentares Brasileiras: Bacia do Recôncavo. Fundação Paleontológica Phoenix. Available at: <http://phoenix.org. br/phoenix51_mar03.html>. Accessed on: Apr. 10, 2011.
Rossetti D.F. 1999. Soft-sediment deformation structures in late
Albian to Cenomanian deposits, São Luis Basin, northern Brazil: evidence for palaeoseismicity. Sedimentology, 46:1065-1081. https://doi.org/10.1046/j.1365-3091.1999.00265.x
Silva O.B., Caixeta J.M., Milhomem P.S., Kosin M.D. 2007. Bacia do Recôncavo. Boletim de Geociências da Petrobras, 15(2):423-431.
Strachan L.J. & Aslop G.I. 2006. Slump floods as estimators
of palaeoslope: a case study from the Fisherstreet Slump of Country Clare, Ireland. Basin Research, 18:451-470. https://doi. org/10.1111/j.1365-2117.2006.00302.x
Teixeira Netto A.S. & Oliveira J.J. 1985. O preenchimento do riftvalley
na Bacia do Recôncavo. Revista Brasileira de Geociências, 15:97-102.
Valadão R.C. 1991. Dinâmica de sedimentação e controle estrutural
em um sistema turbidítico longitudinal: Os turbiditos de Bom
Despacho. Mastering dissertation, Instituto de Geociências, Universidade Federal da Bahia, Salvador.
Zalán P.V., Wolff S., Conceição J.C.J., Astolfi M.A.M., Vieira I.S., Appi
V.T., Zanotto A., Marques A. 1991. Tectonics and sedimentation of
the Paraná Basin. In: Seventh International Gondwana Symposium,
Gondwana seven: Proceeding. São Paulo, Brazil, p. 83-117.
© 2018 Sociedade Brasileira de Geologia