Labor and Employment in
Brazilian Northeastern Agriculture:
a look at the 2004-2014 period
1Otavio Valentim Balsadi
2and Mauro Eduardo DelGrossi
3Abstract: The labor market in the Brazilian Northeastern agriculture is characterized by many forms of occupation, ranging from the salaried work to the various forms of family work. In a heterogeneous and diverse agriculture, there is a complex labor market, with changes in recent times. Therefore, it is necessary to keep a watchful eye on important structural features. As a result, this paper aims to analyze the main aspects related to work and employment relations in the Brazilian Northeastern agriculture in the 2004-2014 period. The sources of information are special tabulations from the National Survey by Household Sample (PNAD), conducted by the Brazilian Institute of Geography and Statistics (IBGE). The results pointed to a continuing decline in Northeastern PEA
(Economically Active Population)occupied in agriculture, partially offset by the growth
of Northeastern rural residents occupied in non-agricultural activities, in addition to the people occupied in self-consumption production. Women and young people were the ones who mostly left the agricultural activities, reinforcing the “ageing” process of the occupied PEA. The crops with the largest reduction in the occupied in agricultural PEA were: cassava, rice, coffee, banana, sugarcane, cocoa, vegetables and fruits. On the other hand, the number of occupied people increased in: corn and grape cultivation, services for agriculture, swine and poultry farming and integrated agricultural and livestock production systems. An increase in schooling of the occupied PEA was registered, though it is still below the national average.
Key-words: labor market, agriculture, agricultural occupations, PNAD, Northeast.
Resumo: O mercado de trabalho na agricultura nordestina é caracterizado por diversas formas de ocupação, desde as relações de assalariamento até as modalidades de trabalho familiar. Com uma agricultura heterogênea e diversa, deve-se manter um olhar atento para aspectos estruturais importantes e, por isso, o objetivo do texto é analisar os principais aspectos relacionados ao trabalho e ao emprego na agricultura nordestina no período 2004-2014, tendo como fonte de informações as tabulações especiais da Pesquisa Nacional por Amostras de Domicilio (PNAD), realizada pelo
1. Data de submissão: 5 de setembro de 2016. Data de aceite: 21 de julho de 2017.
2. Empresa Brasileira de Pesquisa Agropecuária – Embrapa. Brasília-DF, Brasil. E-mail: otavio.balsadi@embrapa.br
1. Introduction
Labor market in agriculture is a subject that has generated many academic studies in recent years in Brazil, mostly with focus on national level (LAURENTI
et al., 2015; MAIA and SAKAMOTO, 2014; SILVA FILHO and BALSADI, 2013; BALSADI, 2011).
These studies showed that in the last two decades important advances in agricultural and rural labor markets have taken place: reduction of child labor; increase of the degree of formality of salaried work; expansion of social security coverage; real gains of salary and increase of the level of education of the occupied people. In spite of that, some challenges remain as structural issues of Brazilian agriculture: continued reduction in the number of occupied persons; “leave off ” of young people and difficulties in the process of succession in rural properties; in addition to the large number of persons either underemployed or in very poor working conditions.
However, relatively few studies devoted a closer look to the regional aspect based on the National Survey by Household Sample (PNAD) database, especially if the specific focus is the Northeastern
region.4 It is important to say that this region is
responsible for 45.0% of the total number of people working in Brazilian agriculture. Despite of the important advances made in the last two decades, the
4. Balsadi and Silva (2010) analyzed the Northeastern agri-cultural labor force, but focused only in the wage labor market.
Northeast still shows indicators of living conditions and levels of regional and human development that are far below those observed in other regions.
Thus, this paper aims to analyze the main aspects related to labor and employment in Brazilian Northeastern agriculture in the 2004-2014 period, based on information of PNAD’s special tabs conducted by the Brazilian Institute of Geography and Statistics (IBGE). The text also aims to contribute not only to further studies and research, but also to the elaboration and implementation of public policies that could promote a dignified life for individuals and families who work in agriculture and in the rural area of Brazilian Northeastern region.
The text has an exploratory and descriptive character and is structured in four parts, in addition to this brief introduction. The first is dedicated to the methodological procedures used to obtain data, as well as some important concepts to understand the analysis better; the second part is dedicated to the analysis of the main aspects related to work and employment in Brazilian Northeastern agriculture; the third part focuses on final considerations and the final part shows the references used in the text.
2. Methodological procedures
The source of primary data of the occupied people in Northeastern agriculture is the National Sample Survey (PNAD). For selected activities, the data refer to the single or main job of the people aged 10 years and
ocupados em atividades não agrícolas, além das pessoas dedicadas à produção de autoconsumo. As mulheres e os jovens foram os que mais deixaram as atividades agrícolas, reforçando uma tendência de “envelhecimento” da PEA ocupada na agricultura. Os setores com maior redução foram os de cultivo de mandioca, arroz, café, banana, cana, cacau, frutas e legumes, enquanto cresceram as ocupações nos cultivos de milho e de uva, na avicultura, na suinocultura, nos serviços para a agricultura e nos sistemas integrados de produção agrícola e pecuária. Registrou-se, também, um crescimento da escolaridade dos ocupados na agricultura nordestina, mas ainda aquém da média nacional.
Palavras-chaves: mercado de trabalho, agricultura, ocupações agrícolas, PNAD, Nordeste.
JEL codes: J21, J43, J48.
over in the reference week of the survey, usually the last or penultimate week of September. Economically Active Population (PEA) occupied refers to the number of people who had worked during all or part of the reference week period. Also part of the occupied PEA are the people who have not worked under salaried jobs in the period specified due to holidays, license, absences, strikes, among others.
In PNADs, it is considered work in economic activity:
a) Work paid in cash, products, goods or benefits (housing, food, clothing etc.) by the production of goods and services;
b) Unpaid work by the production of goods and services, developed for at least one hour a week (not only to help a member of the household who had worked either as self-employed worker, employer or employee in the production of primary goods comprising: agriculture, forestry, animal husbandry, vegetable or mineral extraction, hunting, fishing and fish farming, but also as an apprentice or trainee or even to help some religious, charitable or cooperative institution);
c) Occupation developed for at least one hour a week by the production of goods concerning to agriculture, forestry, animal husbandry, plant extraction, fishing and fish farming, in order to feed either him/herself or at least one member of the household (IBGE, 2014).
With respect to the position in the occupation5, the
PNAD categories are:
• Employer: person who works on his own business, with at least one employee.
• Employee: any person who works for an employer (individual or legal entity), usually with obligation to fulfill a workday, and receives payment either in cash, goods, products or in benefits (housing, food, clothing etc.). The employee is considered permanent when the duration of the work contract or agreement (verbal or written) does not have an established end. The employee is considered
5. Work relation between the person and the enterprise he/ she works in.
temporary when the duration of the work contract or employment agreement (verbal or written) has an established end, which can be renewed or not. That is, the employee is considered temporary either if he/she is hired for a certain time or if he/she does a specific job which, when completed, the work contract or employment agreement would end. According to the region, the temporary salaried worker
receives one of the following names: “boia fria”,
“volante”, “calunga”, “turmeiro”, “peão de trecho”
or clandestine.
• Self-employed worker: person who works exploring his own business, alone or with a partner, without employee(s), or with the help of unpaid workers.
• Unpaid worker: person who works without payment for at least one hour a week to help a member of the family unit, who was either a self-employed worker, employer or employee in the production of primary goods. In this category are also the unpaid workers who work for at least one hour a week, either as an apprentice or trainee or to help any religious, charitable or cooperative institution.
• Self-consumption worker: any person who works for at least one hour a week, in the production of goods concerning to agriculture, forestry, animal husbandry, plant extraction, fishing and fish farming to feed her/himself or at least one member of the household.
The distribution of permanent and temporary employees and of other occupied people by activity follows the classification of economic activities carried
out by IBGE for household surveys purposes.6
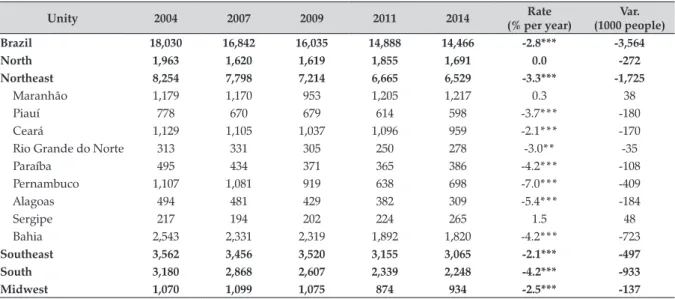
Table 1. Evolution of PEA of 10 years old and over, occupied in agriculture in the 2004-2014 period – Brazil and regions (Thousands of people)
Unity 2004 2007 2009 2011 2014 Rate
(% per year)
Var. (1000 people)
Brazil 18,030 16,842 16,035 14,888 14,466 -2.8*** -3,564
North 1,963 1,620 1,619 1,855 1,691 0.0 -272
Northeast 8,254 7,798 7,214 6,665 6,529 -3.3*** -1,725
Maranhão 1,179 1,170 953 1,205 1,217 0.3 38
Piauí 778 670 679 614 598 -3.7*** -180
Ceará 1,129 1,105 1,037 1,096 959 -2.1*** -170
Rio Grande do Norte 313 331 305 250 278 -3.0** -35
Paraíba 495 434 371 365 386 -4.2*** -108
Pernambuco 1,107 1,081 919 638 698 -7.0*** -409
Alagoas 494 481 429 382 309 -5.4*** -184
Sergipe 217 194 202 224 265 1.5 48
Bahia 2,543 2,331 2,319 1,892 1,820 -4.2*** -723
Southeast 3,562 3,456 3,520 3,155 3,065 -2.1*** -497
South 3,180 2,868 2,607 2,339 2,248 -4.2*** -933
Midwest 1,070 1,099 1,075 874 934 -2.5*** -137
Note: *** and ** indicate 99% and 95% of confidence interval respectively.
Source: PNAD/IBGE special tabs. 2016, February.
It is worth saying that the expansion of PNAD samples to obtain the total number of occupied people in different occupational positions in agricultural activities in the 2004-2014 period was made with new weightings provided by IBGE for this decade, known as “2013 Review”. The annual growth rates were estimated by means of a log-linear regression model with information for 2004, 2005, 2006, 2007, 2008, 2009, 2011, 2012, 2013 and 2014. In 2010, the PNAD was not made due to the accomplishment of the Demographic Census for this year.
3. Main aspects of labor and
employment in Northeast agriculture
in the 2004-2014 period
For the purpose of this paper the following aspects in the analysis of PNAD’s special tabulations will be prioritized: evolution of the number of persons occupied in the period under consideration; non-agricultural occupations of the Northeastern rural PEA; participation of women in the Northeastern agricultural PEA and PEA’s age groups occupied in agriculture; schooling; status in employment; and main agricultural activities in which the PEA was held in the period.
3.1. Evolution of occupied PEA in Brazilian
Northeastern agriculture
Before starting the analysis of the occupied PEA evolution in Northeastern agriculture, it would be important to contextualize the regional performance of Brazil and other regions.
Between 2004 and 2014, the labor force occupied in Brazilian agriculture decreased 2.8% per year, leading to a reduction of 3.6 million persons (Table 1). Except for the North, in all other regions the reduction rates were significant: -3.3% per year in the Northeast; -2.1% per year in the Southeast; -4.2% per year in the South; and -2.5% per year in the Midwest.
Both the Northeast and South accounted for about 75.0% of the total reduction of the occupied labor force in agriculture (2.7 million people of a total of 3.6 million for Brazil in the period).
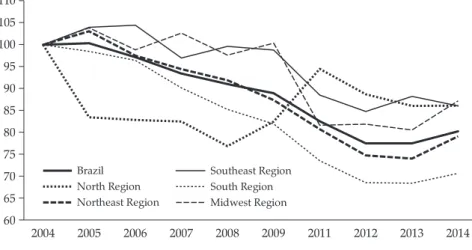
Taking the initial year of the data series (2004 = 100) as a basis, it is possible to see the following values (indexes) for 2014: 80 for the total of Brazil; 86 to the North; 79 for the Northeast; 86 for the Southeast; 71 for the South and 87 for the Midwest (Figure 1).
Figure 1. Evolution of PEA of 10 years old and over occupied in agriculture in the 2004-2014 period, Brazil and regions. Index 2004 = 100
60 65 70 75 80 85 90 95 100 105 110
2004 2005 2006 2007 2008 2009 2011 2012 2013 2014 Brazil North Region Northeast Region Southeast Region South Region Midwest Region
Source: PNAD/IBGE special tabs. 2016, February.
Figure 2. Relative participation (%) of the regions in agricultural PEA of 10 years old and over occupied in Brazil in the 2004-2014 period.
0,0 5,0 10,0 15,0 20,0 25,0 30,0 35,0 40,0 45,0 50,0
North Region Northeast Region Southeast Region South Region Midwest Region
20 04 20 05 20 06 20 07 20 08 20 09 20 11 20 12 20 13 20 14 20 04 20 05 20 06 20 07 20 08 20 09 20 11 20 12 20 13 20 14 20 04 20 05 20 06 20 07 20 08 20 09 20 11 20 12 20 13 20 14 20 04 20 05 20 06 20 07 20 08 20 09 20 11 20 12 20 13 20 14 20 04 20 05 20 06 20 07 20 08 20 09 20 11 20 12 20 13 20 14
Source: PNAD/IBGE special tabs. 2016, February.
persons occupied in agriculture (45.8% in 2004 and 45.1% in 2014). Following are the Southeast, South, North and Midwest, whose relative share in the period were, on average, 21.2%, 16.5%, 10.7% and 6.3%, respectively.
Some important aspects can be observed focusing now the most detailed analysis to Northeast and its states. First, only Maranhão and Sergipe states registered a slight increase in the number of persons occupied in agriculture (0.3% and 1.5% per
year, respectively), although growth rates were not statistically significant (Table 1).
Figure 3. Relative participation (%) of the states in agricultural PEA of 10 years old and over occupied in Northeast region in the 2004-2014 period
0,0 2,0 4,0 6,0 8,0 10,0 12,0 14,0 16,0 Bahia 20 04 20 05 20 06 20 07 20 08 20 09 20 11 20 12 20 13 20 14 20 04 20 05 20 06 20 07 20 08 20 09 20 11 20 12 20 13 20 14 20 04 20 05 20 06 20 07 20 08 20 09 20 11 20 12 20 13 20 14 20 04 20 05 20 06 20 07 20 08 20 09 20 11 20 12 20 13 20 14 20 04 20 05 20 06 20 07 20 08 20 09 20 11 20 12 20 13 20 14 20 04 20 05 20 06 20 07 20 08 20 09 20 11 20 12 20 13 20 14 20 04 20 05 20 06 20 07 20 08 20 09 20 11 20 12 20 13 20 14 20 04 20 05 20 06 20 07 20 08 20 09 20 11 20 12 20 13 20 14 20 04 20 05 20 06 20 07 20 08 20 09 20 11 20 12 20 13 20 14
Maranhão Ceará Pernambuco Piauí Paraíba Alagoas Rio Grande do Norte
Sergipe
Source: PNAD/IBGE special tabs. 2016, February.
and Rio Grande do Norte registered respective rates of -3.7% per year, -2.1% per year and -3.0% per year.
In absolute terms, only the states of Bahia and Pernambuco were responsible for the decrease of about 1.2 million people in Northeastern agriculture (65.6% of the total of 1.7 million people in the analyzed period) (Table 1).
The average share of 45.4% to the Northeast in the total occupied in Brazilian agriculture in the 2004-2014 period, was distributed by their states as follows: 13.4% for Bahia; 7.2% for Maranhão; 6.7% for Ceará; 5.5% for Pernambuco; 4.1% for Piauí; 2.6% for Paraíba; 2.7% for Alagoas; 1.8% for Rio Grande do Norte and 1.4% for Sergipe (Figure 3).
Observe that, in 2014, the states of Bahia, Maranhão and Ceará had more people occupied in agriculture than the total observed for the entire Midwest region of the country. In this year, their relative share in the total labor force occupied in Brazilian agriculture were, respectively, 12.6% (or 1.8 million persons occupied), 8.4% (or 1.2 million people occupied) and 6.6% (or 959,000 persons occupied), against 6.5% (or 934,000 people occupied) for the Midwest region. Bahia had even more people occupied in agriculture than the North, which share in the total of Brazil was 11.7%, or 1.7 million persons occupied in 2014 (Table 1 and Figure 3).
3.2. Non-Agricultural occupations of the rural
Northeastern population
The theme of non-agricultural occupations of
the rural population7 – which partially offsets the
reduction in agricultural occupations – has been quite relevant since the pioneering studies in Brazil credited
to Rurban Project8 in the mid-90s.
One of the reasons is that this form of insertion into the labor market may be an important alternative for rural residents to obtain better working conditions and higher monetary income compared to what they
usually get in agricultural activities.9 Thus, the family
7. It is considered as non-agricultural rural occupation the activity carried out by people living in rural areas and occupied in activities outside of agriculture, whether in rural or urban areas.
8. The Rurban Project was coordinated by the Economics
Institute of Unicamp and involved several research insti-tutions in at least ten Brazilian States (PI, RN, AL, BA, MG, RJ, SP, PR, SC and RS), and the Federal District. This project sought to discuss the relevance of the rural/urban and agricultural/non-agricultural cuts in researches on rural areas, in addition to analyse in details the socio-economic importance of non-agricultural activities for the population living in rural areas, through the processing of PNAD’s microdata. For details, see Campanhola and Graziano da Silva (2000a, 2000b), Del Grossi (1999). 9. More details on this topic can be found in the works of
Table 2. Evolution of non-agricultural PEA of 10 years old and over, with rural residence in the 2004-2014 period- Northeast region and states (Thousands of people)
Unity 2004 2007 2009 2011 2014 Rate 04/09
(% per year)
Rate 11/14 (% per year)
Var. 04/09 (1000 people)
Var. 11/14 (1000 people)
Northeast region 1,486 1,814 1,873 1,823 2,280 4.2** 7.6** 387 457
Maranhão 190 256 183 359 435 -0.8 6.3*** -7 75
Piauí 111 143 132 145 177 4.3* 4.6 21 32
Ceará 237 273 326 272 372 4.3* 11.5 89 100
Rio G. do Norte 139 176 202 120 165 8.0*** 11.3** 63 45
Paraíba 127 121 137 104 117 2.4 2.9 10 13
Pernambuco 174 237 212 200 282 4.0 12.5** 38 82
Alagoas 88 96 101 87 126 3.2 11.5 14 40
Sergipe 44 60 43 87 128 1.7 13.4** -1 41
Bahia 378 452 538 448 477 5.7** 2.4* 161 29
Note: ***, ** and * indicate 99%, 95% and 90% of confidence interval respectively.
Source: PNAD/IBGE special tabs. 2016, February.
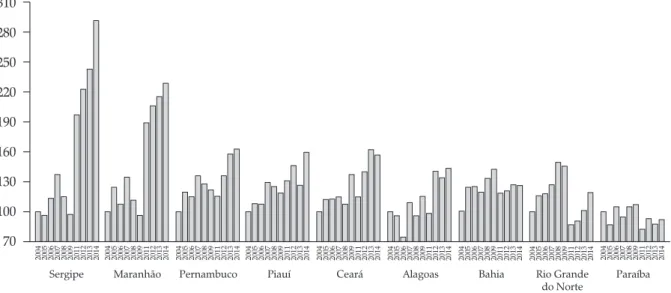
Figure 4. Evolution of non-agricultural rural-resident PEA in the period 2004-2014, Northeast region and states. Index 2004 =100
70 100 130 160 190 220 250 280 310 Sergipe 20 04 20 05 20 06 20 07 20 08 20 09 20 11 20 12 20 13 20 14 20 04 20 05 20 06 20 07 20 08 20 09 20 11 20 12 20 13 20 14 20 04 20 05 20 06 20 07 20 08 20 09 20 11 20 12 20 13 20 14 20 04 20 05 20 06 20 07 20 08 20 09 20 11 20 12 20 13 20 14 20 04 20 05 20 06 20 07 20 08 20 09 20 11 20 12 20 13 20 14 20 04 20 05 20 06 20 07 20 08 20 09 20 11 20 12 20 13 20 14 20 04 20 05 20 06 20 07 20 08 20 09 20 11 20 12 20 13 20 14 20 04 20 05 20 06 20 07 20 08 20 09 20 11 20 12 20 13 20 14 20 04 20 05 20 06 20 07 20 08 20 09 20 11 20 12 20 13 20 14
Maranhão Pernambuco Piauí Ceará Alagoas Bahia Rio Grande do Norte
Paraíba
Source: PNAD/IBGE special tabs. 2016, February.
members may continue living in rural areas and occupying themselves in non-agricultural activities, which can be often complementary to agriculture. This phenomenon of pluriactivity within rural families has been observed, in different degrees of intensity, in
practically all regions of Brazil.10
10. On this topic, see the important works of Nascimento
(2008), Schneider (2009), Schneider et al. (2014) and
Sakamoto et al. (2015).
In the 2004-2014 period, the non-agricultural labor force residing in rural areas of the Northeast region (and its states) jumped from 1.5 million to 2.3 million persons occupied, an increase of 844 thousand new jobs (Table 2). It is important to note that with the exception of Paraíba state, all other states showed significant growth in non-agricultural occupations (Figure 4).
structure of the rural population, with strong increase of non-agricultural activities, has consolidated a framework of great heterogeneity of rural families whose strategies increasingly include other activities along with agriculture. These changes bring the need of not only a new look to the reality but also of new and creative tools for elaboration of rural development policies, especially towards a proper social and economic inclusion of all rural residents.
3.3. Participation of women and occupied age
groups in Northeastern agriculture
Two other aspects that have deserved greater attention in some studies on work and employment in agriculture are: reduction of female presence in the labor force and the “leave off ” of young people. Focusing on the agricultural labor market in the Northeast region in the 2004-2014 period, it is possible to notice these two phenomena in the composition of PEA.
Despite maintaining a relative share of about 30.0% on average in the total of occupied people in the Northeastern agriculture for the period considered, in absolute terms there was a decrease of 453 thousand people in female PEA, with rate of -3.8% per year (Table 3). Both states of Bahia and Pernambuco were responsible for 80.4% of this reduction (364,000 people).
However, it is worth noting that in the states of Maranhão and Sergipe there was a small increase in the number of women occupied in agriculture, although the growth rates were not significant. It is known that there are some organized groups with strong leadership and presence of women in these two states,
such as: the coconut breakers (“mulheres quebradeiras
de coco”) and the mangaba pickers11 (“mulheres catadoras
de mangaba”). In due course, it would be interesting to deepen the knowledge of these labor market relations in these two states.
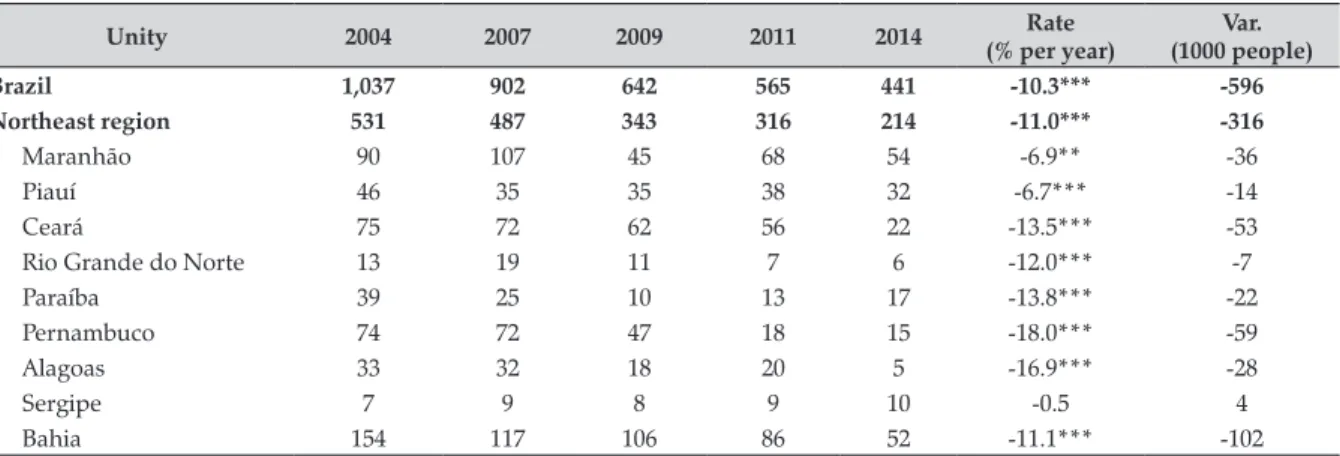
Before raising the issue of young people in agriculture, it is important to note the significant reduction of child labor both in Brazilian and in Northeastern agriculture in the 2004-2014 period (Table 4). For Brazil the decrease was about 600 thousand
11. Mota et al. (2011) showed the importance of mangaba’s
extraction in Sergipe state and the key role of mangaba
pickers in this activity, in terms of environmental pres-ervation, generating employment and income for rural communities.
people aged between 10 and 14 years (rate of -10.3% per year). The Northeast region was responsible for 53.0% of this reduction (316,000 people, with a rate of -11.0% per year). There seems to be a clear and positive effect of public policies - especially those in combating
poverty and promoting food security and nutrition12
– because in all states of the region the performance was similar.
Concerning to the “leave off ” of young people of the agriculture, it is possible to note that there was a reduction of 2.6 million people in Brazil’s agricultural labor force aged between 15 and 29 years in the 2004-2014 period (rate of -6.5% per year). This accounted for 72.5% of the total of 3.6 million people less in Brazilian agriculture (Table 5). That is, out of every four people who left the agricultural labor force, three were young people aged between 15 and 29 years. The reduction of young people was so sharp that in 2014 the shares (relative and absolute) of age groups between 15 and 29 years old and 60 years old and over were very close (in 2004, young people were more than double of the “elderly people” occupied in Brazilian agriculture).
In the Northeast region the phenomenon was quite similar to that for the whole of Brazil. Among the 1.7 million people that left the agricultural labor force in the period 2004-2014, 1.3 million were young people between 15 and 29 years old (77.5% of total).
The Figure 5 shows better view of the question referred. Taking the year of 2004 as a base (2004 = 100), it may be clearly noted a significant percentage share reduction of the 10-to-14-year-old and 15-to-29-year-old groups in the labor force occupied in Northeast agriculture.
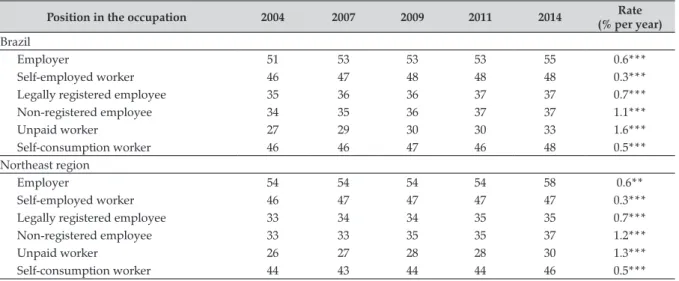
With regard to people’s age occupied in the Northeastern agriculture, the growth rates were positive and significant for all positions in the occupation, similar to the performance observed for total of Brazil (Table 6), showing a progressive “ageing” of the population occupied in agriculture.
In 2014, the average ages of occupied people in the Northeastern region were: 58 years old for employers; 47 years old for self-employed workers; 35 and 37 years old for legally registered and unregistered workers, respectively; 30 years old for unpaid workers; and 46 years old for people devoted to self-consumption.
Table 3. Evolution of female PEA of 10 years old and over, occupied in agriculture in the 2004-2014 period – Northeast region and states (Thousands of people)
Unity 2004 2007 2009 2011 2014 Rate
(% per year)
Var. (1000 people)
Northeast region 2,633 2,490 2,166 2,068 2,180 -3.8*** -453
Maranhão 412 407 269 409 461 0.6 49
Piauí 259 240 226 226 223 -3.3** -37
Ceará 333 323 317 319 293 -2.3** -40
Rio Grande do Norte 87 95 82 52 76 -5.0** -11
Paraíba 134 131 89 99 128 -3.8* -6
Pernambuco 355 344 248 178 241 -8.2*** -114
Alagoas 144 144 116 106 85 -7.2*** -59
Sergipe 79 69 68 64 94 0.2 15
Bahia 830 738 750 615 580 -5.2*** -250
Note: ***, ** and * indicate 99%, 95% and 90% of confidence interval respectively.
Source: PNAD/IBGE special tabs. 2016, February.
Table 4. Evolution of PEA of 10 to 14 years old, occupied in agriculture in the 2004-2014 period – Brazil, Northeast region and states (Thousands of people)
Unity 2004 2007 2009 2011 2014 Rate
(% per year)
Var. (1000 people)
Brazil 1,037 902 642 565 441 -10.3*** -596
Northeast region 531 487 343 316 214 -11.0*** -316
Maranhão 90 107 45 68 54 -6.9** -36
Piauí 46 35 35 38 32 -6.7*** -14
Ceará 75 72 62 56 22 -13.5*** -53
Rio Grande do Norte 13 19 11 7 6 -12.0*** -7
Paraíba 39 25 10 13 17 -13.8*** -22
Pernambuco 74 72 47 18 15 -18.0*** -59
Alagoas 33 32 18 20 5 -16.9*** -28
Sergipe 7 9 8 9 10 -0.5 4
Bahia 154 117 106 86 52 -11.1*** -102
Note: *** and ** indicate 99% and 95% of confidence interval respectively.
Source: PNAD/IBGE special tabs. 2016, February.
Table 5. Evolution of PEA by age groups occupied in agriculture in the 2004-2014 period – Brazil and Northeast region (Thousands of people)
Unity 2004 2007 2009 2011 2014 Rate
(% per year)
Var. (1000 people)
Brazil 18,030 16,842 16,035 14,888 14,466 -2.8*** -3,564
10 to 14 years old 1,037 902 642 565 441 -10.3*** -596
15 to 29 years old 5,586 4,687 4,116 3,523 3,003 -6.5*** -2,584
30 to 59 years old 8,815 8,676 8,610 8,295 8,243 -1.1*** -573
60 years old and over 2,592 2,577 2,666 2,506 2,780 -0.3 189
Northeast region 8,254 7,798 7,214 6,665 6,529 -3.3*** -1,725
10 to 14 years old 531 487 343 316 214 -11.0*** -316
15 to 29 years old 2,841 2,417 2,079 1,692 1,504 -7.2*** -1,337
30 to 59 years old 3,754 3,788 3,719 3,589 3,652 -1.1*** -102
60 years old and over 1,129 1,107 1,074 1,068 1,159 -0.6 31
Note: *** indicate 99% of confidence interval.
Figure 5. Evolution of agricultural PEA by age groups in the 2004-2014 period, Northeast region. Index 2004 = 100
0 20 40 60 80 100 120 140
2004 2005 2006 2007 2008 2009 2011 2012 2013 2014
10 to 14 years old 15 to 29 years old 30 to 59 years old 60 years old and over
Source: PNAD/IBGE special tabs. 2016, February.
Table 6. Evolution of the average age of PEA of 10 years old and over, according to the position in the occupation in the main activity, occupied in agriculture in the 2004-2014 period – Brazil and Northeast region
Position in the occupation 2004 2007 2009 2011 2014 Rate
(% per year) Brazil
Employer 51 53 53 53 55 0.6***
Self-employed worker 46 47 48 48 48 0.3***
Legally registered employee 35 36 36 37 37 0.7***
Non-registered employee 34 35 36 37 37 1.1***
Unpaid worker 27 29 30 30 33 1.6***
Self-consumption worker 46 46 47 46 48 0.5***
Northeast region
Employer 54 54 54 54 58 0.6**
Self-employed worker 46 47 47 47 47 0.3***
Legally registered employee 33 34 34 35 35 0.7***
Non-registered employee 33 33 35 35 37 1.2***
Unpaid worker 26 27 28 28 30 1.3***
Self-consumption worker 44 43 44 44 46 0.5***
Note: *** and ** indicate 99% and 95% of confidence interval respectively.
Source: PNAD/IBGE special tabs. 2016, February.
3.4. Position in the occupation and
schooling in years of study
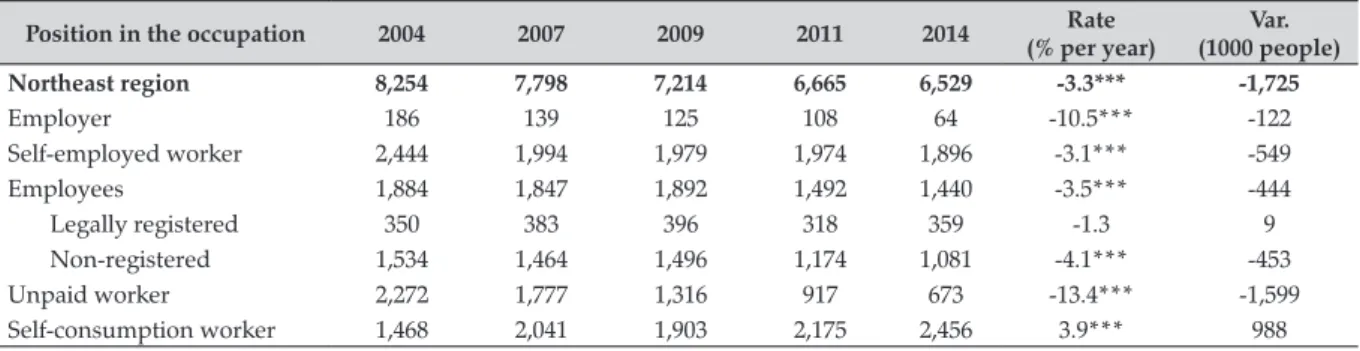
The labor market in the Northeastern agriculture is characterized by distinct forms of occupation, ranging from the salaried work to the various forms of family work. Over the 2004-2014 period, with exception of legally registered employees and of self-consumption workers, all other categories registered strong decreases (Table 7).
In absolute terms, the largest reductions occurred in the unpaid categories (1.6 million people less, with a rate of -13.4% per year), self-employed workers (about 550,000 people less, with rate -3.1% per year) and unregistered workers (about 450 thousand people less, with a rate of -4.1% per year). However, employers have also had a decrease of 122,000 people over the period analyzed (a high rate of -10.5% per year).
Table 7. Evolution of PEA of 10 years and over, according to the position in the occupation in the main activity, occupied in agriculture in the 2004-2014 period – Northeast (Thousands of people)
Position in the occupation 2004 2007 2009 2011 2014 Rate
(% per year)
Var. (1000 people)
Northeast region 8,254 7,798 7,214 6,665 6,529 -3.3*** -1,725
Employer 186 139 125 108 64 -10.5*** -122
Self-employed worker 2,444 1,994 1,979 1,974 1,896 -3.1*** -549
Employees 1,884 1,847 1,892 1,492 1,440 -3.5*** -444
Legally registered 350 383 396 318 359 -1.3 9
Non-registered 1,534 1,464 1,496 1,174 1,081 -4.1*** -453
Unpaid worker 2,272 1,777 1,316 917 673 -13.4*** -1,599
Self-consumption worker 1,468 2,041 1,903 2,175 2,456 3.9*** 988
Note: *** indicate 99% of confidence interval.
Source: PNAD/IBGE special tabs. 2016, February.
Table 8. Evolution of schooling (in average number of years) of PEA of 10 years old and over, according to the position in the occupation in the main activity, occupied in agriculture in the 2004-2014 period –
Brazil and Northeast
Position in the occupation 2004 2007 2009 2011 2014 Rate
(% per year) Brazil
Employer 5.8 6.1 6.6 6.9 8.0 3.0***
Self-employed worker 2.8 3.2 3.6 3.8 4.4 4.8***
Legally registered employee 4.1 4.6 4.9 5.3 5.7 3.7***
Non-registered employee 3.2 3.5 3.7 3.8 4.3 2.8***
Unpaid worker 4.2 4.6 5.0 5.2 5.7 3.1***
Self-consumption worker 3.0 3.2 3.3 3.5 3.8 2.0***
Northeast region
Employer 4.0 4.0 4.4 4.3 5.6 3.7***
Self-employed worker 1.9 2.3 2.6 2.7 3.4 6.3***
Legally registered employee 3.0 3.6 4.0 4.2 4.7 4.8***
Non-registered employee 2.4 2.9 3.0 3.2 3.5 3.6***
Unpaid worker 3.7 4.0 4.4 4.8 5.3 4.2***
Self-consumption worker 2.4 2.7 2.9 3.1 3.5 3.7***
Note: *** indicate 99% of confidence interval.
Source: PNAD/IBGE special tabs. 2016, February.
workers: almost a million occupied people between 2004 and 2014 (rate of 3.9% per year). Only with quantitative data, it is difficult to analyze whether this performance is “good or bad” for the labor market in the Northeastern agriculture, and more specifically, for individuals and families who have in agriculture their main form of insertion in productive activities. Certainly, this subject deserves further studies not only on its performance in the states but also on the main characteristics of this category of occupied people in Northeastern Brazil.
To end this paper’s section, it is worth highlighting a positive aspect: the significant increase in schooling
of occupied people in Brazilian agriculture in general, and in Northeastern agriculture in particular (Table 8). Not only for Brazil but also for the Northeast region, the categories with higher schooling were: the employers, the legally registered employees and the unpaid family members.
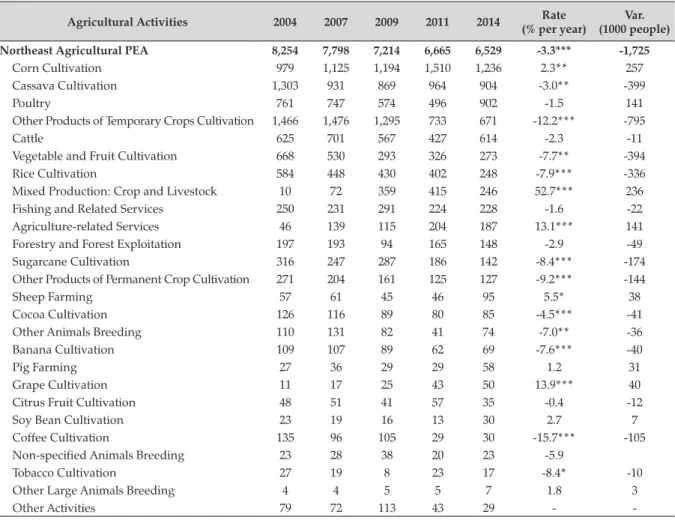
Table 9. Evolution of PEA of 10 years and over, occupied according to the main agricultural activity during the 2004-2014 period – Northeast (Thousands of people)
Agricultural Activities 2004 2007 2009 2011 2014 Rate
(% per year)
Var. (1000 people)
Northeast Agricultural PEA 8,254 7,798 7,214 6,665 6,529 -3.3*** -1,725
Corn Cultivation 979 1,125 1,194 1,510 1,236 2.3** 257
Cassava Cultivation 1,303 931 869 964 904 -3.0** -399
Poultry 761 747 574 496 902 -1.5 141
Other Products of Temporary Crops Cultivation 1,466 1,476 1,295 733 671 -12.2*** -795
Cattle 625 701 567 427 614 -2.3 -11
Vegetable and Fruit Cultivation 668 530 293 326 273 -7.7** -394
Rice Cultivation 584 448 430 402 248 -7.9*** -336
Mixed Production: Crop and Livestock 10 72 359 415 246 52.7*** 236
Fishing and Related Services 250 231 291 224 228 -1.6 -22
Agriculture-related Services 46 139 115 204 187 13.1*** 141
Forestry and Forest Exploitation 197 193 94 165 148 -2.9 -49
Sugarcane Cultivation 316 247 287 186 142 -8.4*** -174
Other Products of Permanent Crop Cultivation 271 204 161 125 127 -9.2*** -144
Sheep Farming 57 61 45 46 95 5.5* 38
Cocoa Cultivation 126 116 89 80 85 -4.5*** -41
Other Animals Breeding 110 131 82 41 74 -7.0** -36
Banana Cultivation 109 107 89 62 69 -7.6*** -40
Pig Farming 27 36 29 29 58 1.2 31
Grape Cultivation 11 17 25 43 50 13.9*** 40
Citrus Fruit Cultivation 48 51 41 57 35 -0.4 -12
Soy Bean Cultivation 23 19 16 13 30 2.7 7
Coffee Cultivation 135 96 105 29 30 -15.7*** -105
Non-specified Animals Breeding 23 28 38 20 23 -5.9
Tobacco Cultivation 27 19 8 23 17 -8.4* -10
Other Large Animals Breeding 4 4 5 5 7 1.8 3
Other Activities 79 72 113 43 29 -
-Note: ***, ** and * indicate 99%, 95% and 90% of confidence interval respectively.
Source: PNAD/IBGE special tabs. 2016, February.
3.5. Main agricultural activities in the
occupation of Northeastern
agricultural PEA
In 2014, the top five activities in the occupation of Northeastern agricultural labor force were: the crops of corn and cassava; the poultry farming; the cultivation of other products of temporary crops and cattle (Table 9). Together, these activities accounted for two-thirds of the total occupied persons (4.3 million people, or 66.3% of total).
We may stand out some activities with positive performance in the period: cultivation of corn (which has become the main activity in the occupation of the agricultural labor force); grape cultivation; provision
of services for agriculture; poultry; pig farming; integrated systems (crop and livestock) and soybean cultivation, which acreage has increased significantly, although with little direct agricultural jobs generation due to the high degree of mechanization of the production process.
Among the crops with important reductions in the Northeastern agricultural PEA’s occupation there are some traditional ones, such as: cassava, rice, coffee, banana, sugarcane, cocoa, in addition to vegetables and fruits. A deeper analysis of the changes in the productive structure of agriculture in the Northeast
region is beyond the scope of this text; however,surely
Moreover, it is important to note that since 2012 the Northeastern semiarid region has suffered a severe drought, considered the most critical over the last 50 years (WORLD BANK, 2016, p. 17). Certainly, thousands of farmers had their productive systems hit and decimated by this climatic phenomenon. And consequently, the strong reduction in the number of people employed in the main agricultural activities was a reflection of this. On the other hand, the growth of almost one million people engaged in production for self-consumption must also be associated with the drought’s problem.
Without soil-climatic conditions to generate surpluses and with the support of some specific public policies, it is possible that thousands of family farmers have become mere subsistence producers. Some numbers of farmers rescued by public actions in 2013 reinforces this hypothesis: in April that year,
about 789 thousand farmers received the
Garantia-Safra insurance and another 880 thousand received the
Bolsa Estiagem benefit (BRAZIL, 2013). That is, in April 2013, there were 1.5 million farmers and workers who received some public support because their activities were heavily affected by the droughts.
4. Final considerations
Based on information of special tabulations of PNAD, the text aimed to present a look forward on some of the main aspects related to work and employment in Northeastern agriculture in the 2004-2014 period.
As a descriptive and exploratory paper, it would be quite appropriate that its main results could instigate future studies to deepen the evidences shown here. Thus, some topics for new research agendas on labor and employment in agriculture and in Northeastern rural region could be covered. Among them (without order of importance):
a) The relationship between changes in the structure and composition of agricultural production, with the introduction of technological and organizational innovations and the demand of the labor force. After all, it was observed a reduction of 1.7 million occupied people in the 2004-2014 period, being a large part of this reduction in traditional
activities of the region (cassava, sugarcane, banana, coffee, rice and cocoa). Also, the effects of prolonged drought in recent years in reducing agricultural production and agricultural occupations could be studied. b) Which sectors of industry, commerce and
services, the Northeastern rural population was occupied in, considering the period analyzed, since about 850,000 non-agricultural jobs were generated for the rural labor force? What is the effect of non-agricultural public policies in the results?
c) The determining factors for the reduction of women’s labor force in Northeastern agriculture, as well as the deepening of the type of participation of women in the labor market (wage in non-agricultural activities, for example).
d) The determining factors for the significant reduction in youth participation in agricultural labor force. In the 2004-2014 period, about 1.3 million people aged 15 to 29 have left the Northeastern agriculture.
e) The relationship and influences of social protection public policies, food security and nutrition in reducing child labor in Northeastern agriculture (316,000 10 to 14-year-old people less in the 2004-2014 period). f) The impact and results of family farming
strengthening policies on agricultural and non-agricultural occupations in the period. g) The profile and characteristics (personal and
familiar) of the self-consumption sector, which had an increase of almost a million people in the analyzed period, as well as which should be the different policies for this significant segment of the Northeastern PEA.
h) The main aspects of work and employment in activities with strong growth in recent years such as: corn, grape and soy cultivation; poultry and pig farming; services for agriculture; integrated agricultural and livestock production systems.
Thus, clearer subsidies could be generated and used by policymakers and managers of public policies, as well as by organizations, representations and social actors in the search for a more equitable rural development in the Northeast region.
To wrap it up, it is important to note that several studies have shown the great concentration of poverty in the rural areas of the Northeast. So, in a scenario of strong reduction of the occupations in agricultural activities, potentiated by the long dry period since 2012, an integrated view among public policies is essential, covering agricultural and agroindustrial policies for the different segments of farmers, especially family farmers, and non-agricultural policies aimed at generating employment and income opportunities. On the other hand, public policies on infrastructure and services, associated with social and food security policies that focused on the poorest families in the Northeast region are fundamental to eliminate the poverty, hunger and malnutrition.
In this sense, the central idea is that the promotion of regional development involves the recovery of economic activities (agricultural and non-agricultural) and the strengthening of the level of families life quality, understood as something broader than the simple socioeconomic insertion (because includes housing, education, food security, health, communication, leisure and culture, land tenure, basic social services – water, electricity, sanitation). The results show that this challenge remains very present when the theme is sustainable development with reduction of regional disparities.
5. References
BALSADI, O. V. Um olhar sobre a PEA rural ocupada em atividades não agrícolas no período 2001-09 e suas principais características. In: 50º Congresso Brasileiro de Economia, Administração e Sociologia Rural, 2012,
Vitória-ES. Anais do 50º Congresso Brasileiro de Economia,
Administração e Sociologia Rural. Vitória-ES: Sociedade Brasileira de Economia, Administração e Sociologia Rural - Sober, 2012. v. 1.
BALSADI, O. V. Evolução das ocupações na agricultura brasileira no período 2001-08. In: XLIX Congresso Brasileiro de Economia, Administração e Sociologia
Rural, 2011, Belo Horizonte. Anais do XLIX Congresso
Brasileiro de Economia, Administração e Sociologia Rural. Belo Horizonte: Sober, 2011. v. 1.
BALSADI, O. V. Ocupações não agrícolas da população rural no Centro-Oeste brasileiro no período 2001-2005.
Informações Econômicas. Instituto de Economia Agrícola, v. 38, n. 11, p. 39-47, 2008.
BALSADI, O. V. and SILVA, A. R. Trabalho assalariado na agricultura nordestina no período 2001-08. In: VIII Congresso Latinoamericano de Sociologia Rural,
2010, Porto de Galinhas. Anais do VIII Congresso
Latinoamericano de Sociologia Rural. Porto de Galinhas: Associação Latinoamericana de Sociologia Rural – Alasru, 2010.
BRAZIL. Ministério da Integração Nacional. Recursos
federais para enfrentamento à seca ultrapassam R$ 16 bilhões. Notícia pública em 02/abril/2013. Disponível em: <http:// www.mi.gov.br/area-de-imprensa/todas-as-noticias/-/ asset_publisher/YEkzzDUSRvZi/content/recursos- federais-para-enfrentamento-a-seca-ultrapassam-r-16-bilhoes/pop_up?inheritRedirect=false>. Acesso em 21 jun. 2017.
CAMPANHOLA, C. and GRAZIANO DA SILVA, J.
(Eds.). O novo rural brasileiro: uma análise nacional e
regional. Jaguariúna (SP), Embrapa, 2000, v. 1. 190p.
CAMPANHOLA, C. and GRAZIANO DA SILVA, J.
(Eds.). O novo rural brasileiro: uma análise estadual –
Nordeste. Jaguariúna (SP), Embrapa, 2000, v. 2. 156p.
DEL GROSSI, M. E. Evolução das ocupações não agrícolas
no meio rural brasileiro: 1981–1995. Tese (Doutorado em Economia), Instituto de Economia, Universidade Estadual de Campinas, Campinas, 1999.
FRANÇA, C. G., MARQUES, V. P. and DEL GROSSI,
M. E. Superação da fome e da pobreza rural: iniciativas
brasileiras. FAO, Brasília, 2016, 252p.
IBGE – Instituto Brasileiro de Geografia e Estatística.
Glossário de conceitos e definições. Rio de Janeiro, 2014, 67p. Disponível em: <http://www.ibge.gov.br/home/ estatistica/populacao/trabalhoerendimento/glossario_ PNAD.pdf>. Acesso em: 7 abr. 2016.
LAURENTI, A. C., PELLINI, T. and TELLES, T. S. Evolução da ocupação e do rendimento das pessoas no espaço rural brasileiro no período de 2001 a 2009.
Revista de Economia e Sociologia Rural, jun. 2015, v. 53, n. 2, p. 321-342.
MAIA, A. G. and SAKAMOTO, C. S. A nova configuração do mercado de trabalho agrícola brasileiro. In:
BUAINAIN, A. M. et al. (Orgs.). O mundo rural no Brasil
MOTA, D. M. et al. (Orgs.). A Mangabeira. As Catadoras. O Extrativismo. Belém-PA: Embrapa Amazônia Oriental/ Embrapa Tabuleiros Costeiros, 2011. 297 p.
NASCIMENTO, C. A. Pluriatividade, pobreza rural e
políticas públicas: uma análise comparada entre Brasil e União Européia. Fortaleza-CE: Banco do Nordeste do Brasil, 2008. 282 p.
SAKAMOTO, C. S., NASCIMENTO, C. A. and MAIA, A. G. As famílias pluriativas no rural brasileiro: uma análise de seus condicionantes e dos diferenciais de
rendimentos nos anos 2000. In: Anais do 53º Congresso
Brasileiro de Economia, Administração e Sociologia Rural. João Pessoa, PB: Sociedade Brasileira de Economia, Administração e Sociologia Rural - Sober, 2015, v. 1.
SCHNEIDER, S. A pluriatividade na agricultura familiar.
2. ed. Porto Alegre-RS: Editora da UFRGS, 2009. 256 p.
SCHNEIDER, S. et al. Pluriatividade e
plurirrendimen-tos nos estabelecimenplurirrendimen-tos agropecúarios do Brasil e das regiões Sul e Nordeste. In: SCHNEIDER, S., FERREIRA,
B. and ALVES, F. (Orgs.). Aspectos multidimensionais
da agricultura brasileira: diferentes visões do Censo
Agropecuário 2006. Brasília, DF: IPEA, 2014.
p. 107-133.
SILVA FILHO, L. A. and BALSADI, O. V. Localização do emprego formal agropecuário nas atividades de
cultivo e criação no Brasil. Revista Economia & Tecnologia
(RET), v. 9, p. 77-100, 2013.
WORLD BANK. Monitor de secas do Nordeste, em busca
de um novo paradigma para a gestão de secas. Brasília, 2015, 100p. Disponível em: <http://monitordesecas.ana.gov. br/>. Acesso em: 21 jun. 2017.