Universidade Gama Filho and Clinimex - Clínica de Medicina do Exercício Mailing address: Claudio Gil S. Araújo - Clínica de Medicina do Exercício Rua Siqueira Campos, 93/101 - 22031-070 - Rio de Janeiro, RJ, Brazil - E-mail: [email protected] English version by Stela Maris C. e Gandour
Djalma Rabelo Ricardo, Claudio Gil Soares de Araújo
Rio de Janeiro, RJ - Brazil
Body Mass Index: A Scientific Evidence-Based Inquiry
The human body has linear, area, and volume measu-rements. A tendency towards a natural proportionality in body measures exists, and it varies with sex and the growth and developmental degrees 1. According to allometry,
height and body weight are, respectively, measures of the li-near and volume nature of an organism 2. These 2
anthropo-metric variables, whose measures are simple and reliable, have been classically used to morphologically characterize an individual. In the XIX century, Quételet proposed a stra-tegy to mathematically relate an individual’s weight and height. According to a MEDLINE search, this strategy, which was later named body mass index 3, has appeared in
more than 6,000 articles since 1994, and it has scientific and epidemiological consistency. Different authors and interna-tional agencies 4-7 have proposed normal ranges for the
body mass index of adults, which allow the identification of undernourished, overweight, and obese individuals. The normal values in adolescents, children, and infants, howe-ver, are distinct and based on percentiles 8-11.
Recently, the prevalence of overweight and obesity has increased in all countries worldwide; in the United States, the proportion of obese adults practically doubled, increasing from 12.8% between 1960-1962 to 22.5% between 1988-199412. According to IBGE (Brazilian Institute of
Geo-graphy and Statistics) data 13, in Brazil, the number of obese
males increased from 4.5 to 7% between the years 1989 and 1997, showing that this is a problem not only in developed countries, but also in developing ones.
Overweight has been associated historically with chronic and degenerative diseases, such as ischemic heart disease 7,14-16, systemic arterial hypertension 17,18,
d y slipidemia 19,20, chronic obstructive pulmonary
disea-se 21, gallbladder disease 22, diabetes mellitus 19, and
so-me types of cancer 23-28. Elevated values of body mass
in dex have been associated with high rates of morbidi-ty and mortalimorbidi-ty 7,15,29-32.
Even though body mass index has been widely used in clinical practice, several theoretical restrictions to its use and its recommended normal ranges exist. Sexual and ethnic differences, and differences in the patterns of regular physi-cal activity 33-36, and consequently, in the level of adiposity,
A r q B r a s C a r d i o l , v o l u m e 7 9 ( n º 1 ) , 7 0 - 8 , 2 0 0 2
Objective -To objectively and critically assess body mass index and to propose alternatives for relating body weight and height that are evidence-based and that elimi-nate or reduce the limitations of the body mass index.
Methods - To analyze the relations involving weight and height, we used 2 databases as follows: 1) children and adolescents from Brazil, the United States, and Swit-zerland; and 2) 538 university students. We performed ma-thematical simulations with height data ranging from 115 to 190 cm and weight data ranging from 25 to 105 kg. We selected 3 methods to analyze the relation of weight and height as follows: body mass index - weight (kg)/height
(m2); reciprocal of the ponderal index - height (cm)/
weight1/3 (kg); and ectomorphy. Using the normal range
from 20 to 25 kg/m2 for the body mass index in the reference
height of 170 cm, we identified the corresponding ranges
of 41 to 44 cm/kg1/3 for the reciprocal of the ponderal
in-dex, and of 1.45 to 3.60 for ectomorphy.
Results - The mathematical simulations showed a strong association among the 3 methods with an absolute concordance to a height of 170 cm, but with a tendency to-wards discrepancy in the normal ranges, which had alrea-dy been observed for the heights of 165 and 175 cm. This made the direct convertibility between the indices unfeasi-ble. The reciprocal of the ponderal index and ectomorphy with their cut points comprised a larger age range in chil-dren and adolescents and a wider and more central range in the university students, both for the reported (current) and desired weights.
Conclusion - The reciprocal of the ponderal index and ectomorphy are stronger and are more mathematically logical than body mass index; in addition, they may be applied with the same cut points for normal from the age of 5 ½ years on.
Key words: body mass index, ectomorphy, reciprocal of
may contribute to some limitations of the body mass index. It is even possible that the passage of time, stressed by bio-logical and even cultural factors, may interfere with the con-sistency of the body mass index. An example may be seen in the anthropometric data of famous women, such as female models 37 or those participating in the Miss America Beauty
Pageant 38. Even though these women may socially be
con-sidered acceptable, a high prevalence of patterns corres-ponding to clinical undernourishment would be observed if the current criteria for body mass index were applied.
Therefore, it seems appropriate to critically review the use of the body mass index, especially in children and ado-lescents, and, if possible, to propose alternatives that provi-de simplicity associated with a greater mathematical and theoretical coherence.
The objective of this study was to compare 3 methods of presenting the weight and height relations for children, adolescents, and adults, assessing their consistency and mathematical formulation. We also aimed at identifying the respective normal ranges, determining in a satisfactory manner the individuals who fit those spectra of linearity con-sidered normal. Our study comprised 3 independent studies designed to analyze the results obtained from the weight and height relations in different populations.
M e t h o d s
We selected the following 3 procedures to analyze the body weight/height relation: 1) the body mass index, in which the weight/height relation is mathematically defined by the following equation: weight (kg)/height2 (m); 2) the
re-ciprocal of the ponderal index, also known as Sheldon’s index 39, which is calculated using the following equation:
height (cm)/weight1/3 (kg). According to the allometric
model, the latter relation has a stronger mathematical fo-undation, because weight is a variable of cubic dimensions and height is a variable of linear dimensions 40; 3) the
ec-tomorphy, the third component of the somatotype, repre-sents the relative linearity of the individual 41. In the 1960s,
the anthropologist Barbara Heath and the Physical Educa-tion professor John E. Lindsay Carter 42 proposed, based on
the previous studies by Parnell, the Heath-Carter anthro-pometric somatotyping method to determine the somatoty-pe. And even more important, they recognized the limita-tions inherent in the closed numerical scale, which had been originally proposed by Sheldon, and those authors began to accept an unlimited and open scale in only one direction. Later, Araújo 43 stressed the theoretical inconsistency of the
method of open scales in only one direction and showed with actual examples of obese individuals its practical limi-tations, especially in regard to ectomorphy. Therefore, occa-sional negative values obtained with the formulae of the components became accepted and no longer arbitrarily transformed into 0.1.
The scale for measuring ectomorphy is nondimensional and of a continuous and intervallic nature. In practice, ec-tomorphy is determined on the basis of the reciprocal of the
ponderal index using the linear equation: ectomorphy = [2.42 x ((height (cm)/2.54)/(weight (kg)/0.4536)1/3) – 28.58]. It is
worth noting that the units were converted to cm and kg 2,40.
Even though the reciprocal of the ponderal index and ecto-morphy represent basically the same information, ectomor-phy is more frequently used and is one of the components of the somatotype, which is a very frequently used kinan-thropometry technique. It allows a more global analysis of the body composition and physique of the individual when analyzed along with the 2 other components, endomorphy and mesomorphy.
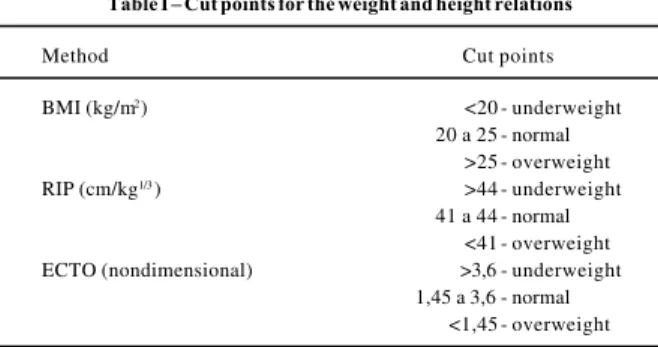
The cut points were divided into 3 categories for all the selected methods: underweight, normal weight, and overweight (tab. I).
For body mass index, we used the limits recommended by the International Obesity Task Force (IOTF) 4. Even
though that institution considers as underweight a body mass index below 18.5 kg/m2, we chose a higher cut point as
reported by Wang et al 6. Therefore, we considered values
below 20 kg/m2 as underweight, because no consensus in
regard to lower cut points exists among the institutions and the specialists in the area. To define the cut points and the normal range for the reciprocal of the ponderal index and ectomorphy, we used the respective equivalent values of the normal body mass indices for a height of 170 cm. We had already validated the referred cut points for the reciprocal of the ponderal index and ectomorphy in another population, and concluded that the discrimination power of both was si-milar to that originally proposed for the body mass index 44.
In study 1, we analyzed the weight/height relations in children and adolescents with ages ranging from 2 to 12 years in 3 different countries (Brazil, the United States, and Switzerland). Data regarding Brazil were collected in the cross-sectional study by Marcondes et al 45, who assessed
9,258 children (4,603 boys and 4,655 girls) in the city of San-to André, in the state of São Paulo. These children belon-ged to a social class considered normal in regard to life con-ditions and from the nutritional point of view. Data on these children were grouped in tables with 5 columns, and the middle column corresponded to the medium value. To make the 3 databases uniform, we considered this medium value equivalent to the median value, ie, the 50th percentile.
Table I – Cut points for the weight and height relations
Method Cut points
BMI (kg/m2) <20 - underweight
20 a 25 - normal >25 - overweight
RIP (cm/kg1/3) >44 - underweight
41 a 44 - normal <41 - overweight ECTO (nondimensional) >3,6 - underweight
1,45 a 3,6 - normal <1,45 - overweight
The values of weight and height regarding the popula-tion sample of the United States were collected in a publica-tion of the Napublica-tional Center for Health Statistics (NCHS) 4 6
with a total of 20,000 individuals of both sexes and ages ran-ging from 2 to 18 years during the period from 1963 to 1975. We also analyzed the anthropometric data from the northwestern region of Switzerland (Basel) found in a study of 4,300 individuals with an equal proportion of sexes, and ages ranging from 2 to 17 years, carried out from 1956 to 1957 46. In
our study, we only used data relating to the age bracket from 2 to 12 years, minimizing the occasional influences of pro-cesses of biological maturation with distinct rhythms.
Once data were arranged in a table, we established the cut points underweight, normal weight, and overweight -proposed for each method (body mass index, reciprocal of the ponderal index, and ectomorphy). If the methods ap-plied equally well for the analysis of the weight/height ratio of children and adolescents of both sexes and all ages, the individuals in the 50th percentile for weight and height
would be within the normal range.
To check the consistency of the indicators to foretell the normal range in adults, which comprised study 2, we performed a mathematical simulation using data of heights between 115 and 190 cm (at every 5 cm) and of weights bet-ween 25 and 105 kg (at every 2.5 kg). This way, we obtained a total of 528 weight/height ratios for each of the 3 methods. In addition, data for 3 different heights were separated - 145, 160, and 170 cm - in the following body weight ranges: between 25 and 60 kg, between 40 and 85 kg, and between 45 and 90 kg, respectively. The height 145 cm was chosen because, according to Marcondes (1978), it represents the approximate value of a Brazilian peripuberal adolescent. The remaining heights selected, 160 and 170 cm, represent, respectively, a typical Brazilian female and male 13. We also
determined the linear regressions between the body mass index and ectomorphy for the 3 above-mentioned heights in at least 10 distinct body weights.
In the composition of study 3, we used data of the heights and current and desired weights of 538 (331 females and 207 males) students of the Universidade Gama Filho 47,
and calculated the weight/height ratios according to the 3 methods selected. After that, we demarcated the normal ranges for the predictors of weight/height relations accor-ding to previous studies.
The individuals were arranged in percentiles (from the 1st to the 99th) from the lightest individual to the heaviest
indi-vidual according to the results of the weight/height ratios. We could assess the strength of each method according to the number of individuals within the normal range.
In a subsequent analysis, we checked the validity of the methods to estimate the normal range for body weight in relation to height, independent of sex, comparing the wei-ght/height relations reported by the interviewees using the desired body weight.
In this specific study, we performed a descriptive ana-lysis of the scores, and we used the Pearson linear correla-tion coefficient to assess the degree of associacorrela-tion between the indicators.
R e s u l t s
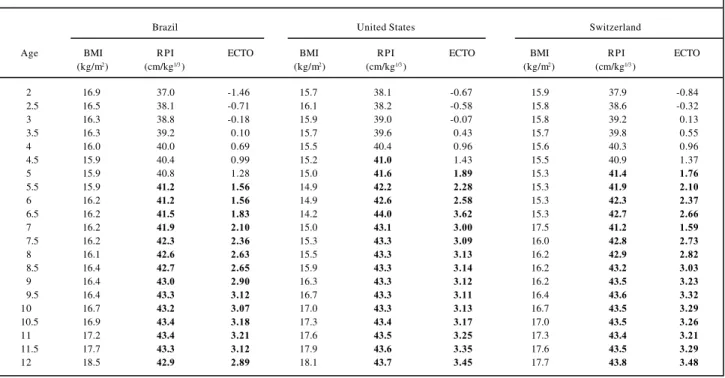
Study 1 – Analyzing the weight/height relations in children, we observed that none of the methods studied (body mass index, reciprocal of the ponderal index, and ecto-morphy) had a satisfactory consistency to safely identify the normal ranges for the age bracket from 2 to 5½ years in the 3 databases assessed. However, from that age to 12 years, the reciprocal of the ponderal index and ectomorphy almost correctly identified children in the 50th percentiles
for height and weight in both sexes. We could also observe that the body mass index did not reflect the relative linearity for any age or sex in this population when the 50th percentile
was considered for weight and height. This can be seen in tables II and III in which the normal range is represented as a gray background.
Study 2 - The mathematical simulations performed in the 2nd study showed that the 3 methods used to analyze
the weight/height relation are strongly associated (r > 0.97; P<0.001), especially when limited weight and height ran-ges are considered with an absolute coincidence at the height of 170 cm. However, we observed a tendency to-wards discrepancy in the normal ranges in the 3 me thods, and this tendency could already be observed for the height values of 165 and 175 cm (not shown in the table), and it was even more marked in extreme height values, such as 145 cm (tab. IV).
Even though a strong association exists among the 3 methods in relating weight and height, the coefficients of re-gression tend to be distinct, because the predictive equations diverge in regard to the constant and the correla-tion coefficient (coefficient X), therefore, hindering the di-rect convertibility between the methods. This fact may be seen in the simulations of height (145, 160, and 170 cm), in which we observed that the linear equation of prediction proposed for a certain height could not be used for another height, as shown in table V.
For example, the ectomorphy of a 160-cm-tall individu-al weighing 50 kg would be 3.21. On the other hand, if we used the proposed equation for the height of 170 cm, a mis-take would occur in that prediction, as exemplified below: BMI = - 2.168. X + 28.3 (where X = ECTO); BMI = - 2.168. 3.21 + 28.3, where the body mass index (predicted through the equation) = 21.34 kg/m2 and the actual body mass index
= 19.53 [(weight (kg)/height2 (m)].
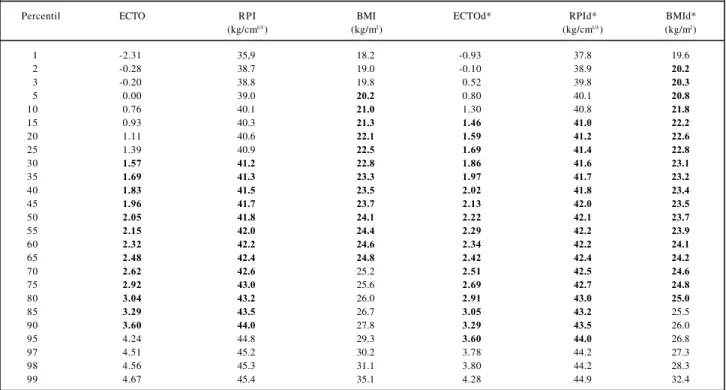
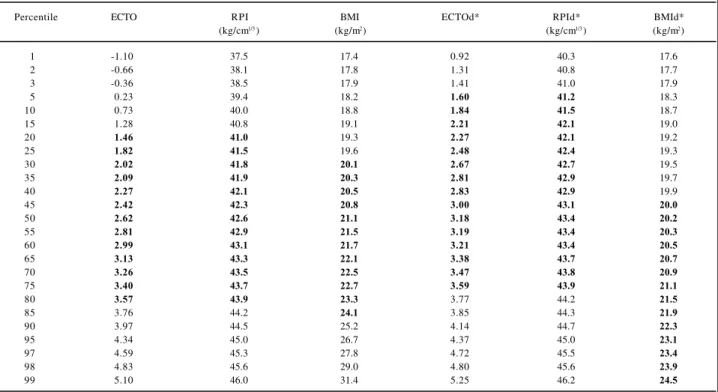
Study 3 – The 2 predictors of the weight/height rela-tion presented in this study found a greater number of indi-viduals within the normal range proposed for the referred methods when the weights and heights reported by the uni-versity students were considered. This phenomenon could be better observed when the results of the weight/height relations were transformed into percentiles, where the reci-procal of the ponderal index and the ectomorphy discrimi-nated from the 30th to the 90th percentiles and from the 20th to
the 95th percentiles formales and females, respectively.
from the 5th to the 65th percentiles and from the 30th to the 85th
percentiles, respectively for university males and females. The reciprocal of the ponderal index and the ectomorphy encompassed a more central and wider range for the univer-sity students of both sexes than the body mass index did (tabs. VI and VII).
For an index considered ideal by the university stu-dents, ie, the desired weight (the amount the individual would like to weigh) and the reported height (current), data
strengthen even more the validity of the measures and the normal ranges of the reciprocal of the ponderal index and of ectomorphy as compared with body mass index, once again encompassing a wider and more central range of the sample. Another interesting fact was the asymmetry found in the desired body mass index for males and females, which ran-ged from lower values in males to higher values in females. These results enabled a crossed validation of the indicators here studied, because the desired indices represent the
li-Table II - The 50th percentile for weight and height – boys
Brazil United States Switzerland
Age BMI RPI ECTO BMI RPI ECTO BMI RPI ECTO
(kg/m2) (cm/kg1/3) (kg/m2) (cm/kg1/3) (kg/m2) (cm/kg1/3)
2.0 17.2 37.0 -1.49 16.4 37.6 -1.08 16.4 37.6 -1.06
2.5 16.9 37.8 -0.93 16.5 37.9 -0.80 15.8 38.8 -0.17
3.0 16.5 38.6 -0.30 16.2 38.8 -0.17 15.7 39.4 0.26
3.5 16.4 39.1 0.05 16.0 39.6 0.40 15.7 39.9 0.66
4.0 16.3 39.6 0.39 15.8 40.3 0.90 15.6 40.5 1.06
4.5 16.3 40.0 0.68 15.6 40.9 1.37 16.5 39.8 0.52
5.0 16.3 40.3 0.94 15.5 41.4 1.75 16.5 40.2 0.85
5.5 16.1 41.0 1.44 15.4 41.9 2.09 15.6 41.8 2.00
6.0 16.2 41.3 1.65 15.3 42.3 2.38 15.5 42.2 2.33
6.5 16.3 41.6 1.85 15.4 42.6 2.63 15.5 42.6 2.59
7.0 16.4 41.8 2.05 15.4 42.9 2.82 15.5 42.9 2.84
7.5 16.4 42.1 2.27 15.5 43.1 2.98 15.5 43.2 3.06
8.0 16.4 42.5 2.52 15.7 43.3 3.09 15.4 43.6 3.34
8.5 16.7 42.5 2.54 15.9 43.4 3.18 15.5 43.9 3.55
9.0 16.6 42.9 2.82 16.1 43.5 3.24 15.5 44.2 3.75
9.5 16.8 43.0 2.87 16.4 43.5 3.27 15.5 44.4 3.93
10.0 17.0 43.0 2.91 16.6 43.6 3.31 15.9 44.4 3.89
10.5 17.2 43.0 2.91 16.9 43.6 3.34 16.5 44.0 3.61
11.0 17.6 42.9 2.83 17.2 43.7 3.40 17.2 43.6 3.36
11.5 18.2 42.7 2.66 17.5 43.8 3.45 17.8 43.3 3.12
12.0 18.7 42.5 2.55 17.8 43.9 3.52 18.3 43.2 3.02
Table III – The 50th percentile for weight and height - girls
Brazil United States Switzerland
Age BMI RPI ECTO BMI RPI ECTO BMI RPI ECTO
(kg/m2) (cm/kg1/3) (kg/m2) (cm/kg1/3) (kg/m2) (cm/kg1/3)
2.0 16.9 37.0 -1.46 15.7 38.1 -0.67 15.9 37.9 -0.84
2.5 16.5 38.1 -0.71 16.1 38.2 -0.58 15.8 38.6 -0.32
3.0 16.3 38.8 -0.18 15.9 39.0 -0.07 15.8 39.2 0.13
3.5 16.3 39.2 0.10 15.7 39.6 0.43 15.7 39.8 0.55
4.0 16.0 40.0 0.69 15.5 40.4 0.96 15.6 40.3 0.96
4.5 15.9 40.4 0.99 15.2 41.0 1.43 15.5 40.9 1.37
5.0 15.9 40.8 1.28 15.0 41.6 1.89 15.3 41.4 1.76
5.5 15.9 41.2 1.56 14.9 42.2 2.28 15.3 41.9 2.10
6.0 16.2 41.2 1.56 14.9 42.6 2.58 15.3 42.3 2.37
6.5 16.2 41.5 1.83 14.2 44.0 3.62 15.3 42.7 2.66
7.0 16.2 41.9 2.10 15.0 43.1 3.00 17.5 41.2 1.59
7.5 16.2 42.3 2.36 15.3 43.3 3.09 16.0 42.8 2.73
8.0 16.1 42.6 2.63 15.5 43.3 3.13 16.2 42.9 2.82
8.5 16.4 42.7 2.65 15.9 43.3 3.14 16.2 43.2 3.03
9.0 16.4 43.0 2.90 16.3 43.3 3.12 16.2 43.5 3.23
9.5 16.4 43.3 3.12 16.7 43.3 3.11 16.4 43.6 3.32
10.0 16.7 43.2 3.07 17.0 43.3 3.13 16.7 43.5 3.29
10.5 16.9 43.4 3.18 17.3 43.4 3.17 17.0 43.5 3.26
11.0 17.2 43.4 3.21 17.6 43.5 3.25 17.3 43.4 3.21
11.5 17.7 43.3 3.12 17.9 43.6 3.35 17.6 43.5 3.29
nearity that the university students would like to have, ie, an ideal weight for a certain height. In this specific case, the reciprocal of the ponderal index and ectomorphy showed a greater discriminating power than that of body mass index. As suggested by the mathematical simulation in study 2, the relation among body mass index, the ectomorphy, and the reciprocal of the ponderal index (r = -0.89; P<0.001), des-pite its significance, has lower correlation coefficients, sho-wing that, even though for the fixed height of 170 cm that re-lation is almost perfect, for real data in which height varies, a significant loss occurs in the association.
D i s c u s s i o n
Obesity in childhood is a public health problem, whose importance has progressively increased in the last few years 8,9,29,48. Evidence suggests that the chance of an
obese child or adolescent becoming an obese adult is approximately 30% 49. On the other hand, obesity in
adul-thood is associated with chronic and degenerative disea-ses, morbidity, and mortality 14,50. However, estimation of the
prevalence of obesity in childhood with a safe, reliable, and valid indicator using criteria similar to those used for adults had not yet been possible.
The methods used to diagnose overweight and obesi-ty, and to determine the normal ranges and underweight in this population are numerous. The skinfold measure, mainly
the triceps skinfold measure, has been largely used to estima-te overweight and obesity in children and adolescents 49,51
with a high association with the direct measures of adiposi-ty, especially between the ages of 10 and 15 years 52. Its
ap-plication, however, is limited, because it requires highly ex-perienced evaluators, and also because of the existence of the recognized intra- and interevaluator variability of the measures 53. Other anthropometric measures have also
been used, among which we can highlight the following: the circumference, relative weight, weight for age, somatotype, and finally the weight and height relations, among which we stress body mass index.
The results of study 1 confirm the unfeasibility of the application of the normality criteria of the body mass index used for adults as an indicator of overweight and obesity for children, because it did not reflect the relative linearity of that population. In contrast, the reciprocal of the ponderal index and the ectomorphy using normal ranges derived from the body mass index for the standard height of 170 cm could identify individuals in a spectrum of linearity consi-dered normal (50th percentile of weight and height)
indepen-dent of sex and between the ages of 5.5 and 12 years in 3 databases of different regions of the planet. The only excep-tion to this rule was observed at one single age in the databa-se of the Swiss children, probably related to the influence of the early pubescent growth spurt in part of the sample or to another unidentified sample characteristic. This showed a greater independence of these predictors in regard to the in-tervening variables, which are inherent in the weight and height relations, such as age, sexual maturation, ethnicity, sexual dimorphism, and height itself.
Height has a relevant influence on the estimation of obesity by these indicators 34,54,55, drastically interfering
with their results, mainly in children, in whom they remain in constant change up to adulthood, in addition to having a strict correlation with body weight 56. Based on this
assum-Table V – Equations of prediction
Simulated heights 145cm 160cm 170cm
Equation Y = -1.822 Y = -2.324 Y = -2.168
X + 24.42 X + 27.36 X + 28.29
Y = BMI ; X = ECTO or RPI values
Table IV - Mathematical simulations of weight and height relations
Height = 145cm* Height = 160cm* Height = 170cm*
Peso BMI ECTO Peso BMI ECTO Peso BMI ECTO
(kg) (kg/m2) (kg) (kg/m2) (kg) (kg/m2)
25 11.9 7.72 40 15.6 5.67 45 15.6 6.41
27.5 13.1 6.59 42.5 16.6 4.98 47.5 16.4 5.78
30 14.3 5.58 45 17.6 4.35 50 17.3 5.20
32,5 15.5 4.68 47.5 18.6 3.76 52.5 18.2 4.66
35 16.6 3.87 50 19.5 3.21 55 19.0 4.14
37.5 17.8 3.13 52.5 20.5 2.70 57.5 19.9 3.66
40 19.0 2.46 55 21.5 2.22 60 20.8 3.21
42.5 20.2 1.84 57.5 22.5 1.77 62.5 21.6 2.78
45 21.4 1.26 60 23.4 1.34 65 22.5 2.37
47.5 22.6 0.73 62.5 24.4 0.93 67.5 23.4 1.98
50 23.8 0.23 65 25.4 0.55 70 24.2 1.62
52.5 25.0 -0.23 67.5 26.4 0.19 72.5 25.1 1.27
55 26.2 -0.67 70 27.3 -0.16 75 26.0 0.93
57.5 27.3 -1.08 72.5 28.3 -0.49 77.5 26.8 0.61
60 28.5 -1.47 75 29.3 -0.81 80 27.7 0.30
ption, a valid and reliable indicator that may safely reflect overweight and obesity in addition to expressing the proper linearity for a child should have a high correlation with body weight, but a minimum association with height 57,58.
Unfortu-nately, this statement does not apply to body mass index, be-cause, according to Garn et al 59, body mass index had a strong
relation to height in children (r=0.30) when an expressive number was considered (n=40,000). Garn 60 confirmed the
influence of height on body mass index and even added that the divisor of the equation (weight/height2) was originally
squared in an attempt to correct this fact. Bellizzi and Dietz 34,
reported that even though body mass index had a high correlation with the measures of body density, it was not a perfect indicator for children due to its association with height. Therefore, we infer that body mass index should only be used with criteria adequate for this age bracket.
Another important question relates to the mathemati-cal foundation of body mass index originally proposed by the Belgian astronomer and mathematician Lamber Adol-phe Jacques Quételet (1769-1874) 40, according to whom,
that index would be provided by dividing weight (kg) by height squared. According to allometry, 2 variables grow at different rates, both in structure and function. In this model, mass has a volumetric proportion, and, therefore, should be cubed; height, on the other hand, has a linear dimension and should be raised to the power of 1 2,40. Both the reciprocal of
the ponderal index and the ectomorphy respect this relation of dimension; therefore, they have a better mathematical logic from the biological system point of view.
Therefore, the reciprocal of the ponderal index and
ec-tomorphy have greater accuracy and strength for identif-ying those individuals who fit a normal standard of weight for a certain height. This is observed only from the age of 5.5 years on, because none of the methods relating weight and height managed to reflect the adequate linearity for the age between 2 and 5.5 years. This may be due to a question related to the complex disproportion of the child as compa-red with the adult.
A relevant fact to be discussed, specifically in study 1, regards the cut points proposed for the different methods for estimating the nutritional status of a child or adolescent, and upon which the international scientific community has not yet agreed 9,51,34. Recently, Cole et al 10 have pro
po-sed for children and adolescents a cut point for body mass index in percentiles based on the cut points used for 18-year-old adults (25 and 30 kg/m2, respectively for
over-weight and obesity). In most studies considering body mass index in children and adolescents, the percentile is the measure of dispersion most used to classify the in divi-duals, a percentile >85 being used to identify overweight and a percentile >95 to indicate obesity 61,62. However,
these cut points are arbitrary 8, because we consider that 5
and 15% of the population are, respectively, obese and overweight; sometimes, these numbers do not represent the sample universe 52.
Nevertheless, we need strategies that may be used to compare the different existing databases and that may serve as a reference for comparisons between the linearity found in children and that of the parents. Body mass index seems not to serve this finality, but the reciprocal of the ponderal
Table VI – Weight/height relations – male university students
Percentil ECTO RPI BMI ECTOd* RPId* BMId*
(kg/cm1/3) (kg/m2) (kg/cm1/3) (kg/m2)
1 -2.31 35,9 18.2 -0.93 37.8 19.6
2 -0.28 38.7 19.0 -0.10 38.9 20.2
3 -0.20 38.8 19.8 0.52 39.8 20.3
5 0.00 39.0 20.2 0.80 40.1 20.8
10 0.76 40.1 21.0 1.30 40.8 21.8
15 0.93 40.3 21.3 1.46 41.0 22.2
20 1.11 40.6 22.1 1.59 41.2 22.6
25 1.39 40.9 22.5 1.69 41.4 22.8
30 1.57 41.2 22.8 1.86 41.6 23.1
35 1.69 41.3 23.3 1.97 41.7 23.2
40 1.83 41.5 23.5 2.02 41.8 23.4
45 1.96 41.7 23.7 2.13 42.0 23.5
50 2.05 41.8 24.1 2.22 42.1 23.7
55 2.15 42.0 24.4 2.29 42.2 23.9
60 2.32 42.2 24.6 2.34 42.2 24.1
65 2.48 42.4 24.8 2.42 42.4 24.2
70 2.62 42.6 25.2 2.51 42.5 24.6
75 2.92 43.0 25.6 2.69 42.7 24.8
80 3.04 43.2 26.0 2.91 43.0 25.0
85 3.29 43.5 26.7 3.05 43.2 25.5
90 3.60 44.0 27.8 3.29 43.5 26.0
95 4.24 44.8 29.3 3.60 44.0 26.8
97 4.51 45.2 30.2 3.78 44.2 27.3
98 4.56 45.3 31.1 3.80 44.2 28.3
99 4.67 45.4 35.1 4.28 44.9 32.4
index and the ectomorphy allow that, from the age of 5.5 years on, the same cut points of adults may be used regar-dless of the sex.
In adults, we observed that the results of study 2 con-firmed those of the study by Lee et al 58 who reported that
the weight and height relations strongly correlate with height for values below 150 cm and above 190 cm. These relations interfered in a relevant manner with the results of those indicators, even though those authors did not analyze the reciprocal of the ponderal index and ectomor-phy. This confirmed the discrepancy found in the correla-tion coefficients and in the constant of the linear equacorrela-tions, when, in the 3 methods adopted, height separated out at 170 cm.
The results found in study 3 showed that the recipro-cal of the ponderal index and ectomorphy were stronger than body mass index in university students because those indices identified a greater range of normal-weight indivi-duals in a given height both for the reported and desired weight and height relations. The cut points proposed for body mass index should be reviewed for an adult popula-tion, because, as observed in the database analyzed, this method indicated that 35% of the male university students were overweight and, therefore, would be at a higher risk for morbidity and mortality. This seems not to correspond to reality, because, according to data reported by the IBGE 13,
Brazil has 22% of overweight males in a wider range of age and socioeconomic conditions.
The limitations of body mass index as an instrument for identifying overweight and obesity in children,
adoles-cents, adults, and the elderly are widely documented. Chart I briefly shows some relevant factors that interfere with the validity of body mass index.
The present study confirms some previous cri t i-cisms in regard to body mass index and proposes other strategies to assess the relative linearity and the nutri-tional status in distinct phases of life. The reciprocal of the ponderal index and ectomorphy also have limitations inherent in the indices that relate weight and height. They, however, were stronger and had a better mathe -matical foundation, in addition to having more adequate cut points, allowing, therefore, greater control upon some intervening variables.
In conclusion, based on our data, we confirm the limi-tations of body mass index, not only because it does not reflect body composition, but it also has intrinsic ma the-matical limitations that become more evident in the ex-tremities of the height scale. Even though widely used in clinical practice and in studies of epidemiological charac-teristics, body mass index should be cautiously used even as an instrument of obesity and overweight screening, especially in children and adolescents, in whom other cut points are mandatory.
The reciprocal of the ponderal index and ectomorphy have better mathematical logic and greater consistency. Therefore, they undergo a smaller influence of extreme height data, and can be applied to adults and children older than 5 years and of both sexes. Likewise, the recommended cut points for the normal ranges of these methods are valid for a university population, especially when the desired
Table VII – Weight/height relations - female university students
Percentile ECTO RPI BMI ECTOd* RPId* BMId*
(kg/cm1/3) (kg/m2) (kg/cm1/3) (kg/m2)
1 -1.10 37.5 17.4 0.92 40.3 17.6
2 -0.66 38.1 17.8 1.31 40.8 17.7
3 -0.36 38.5 17.9 1.41 41.0 17.9
5 0.23 39.4 18.2 1.60 41.2 18.3
10 0.73 40.0 18.8 1.84 41.5 18.7
15 1.28 40.8 19.1 2.21 42.1 19.0
20 1.46 41.0 19.3 2.27 42.1 19.2
25 1.82 41.5 19.6 2.48 42.4 19.3
30 2.02 41.8 20.1 2.67 42.7 19.5
35 2.09 41.9 20.3 2.81 42.9 19.7
40 2.27 42.1 20.5 2.83 42.9 19.9
45 2.42 42.3 20.8 3.00 43.1 20.0
50 2.62 42.6 21.1 3.18 43.4 20.2
55 2.81 42.9 21.5 3.19 43.4 20.3
60 2.99 43.1 21.7 3.21 43.4 20.5
65 3.13 43.3 22.1 3.38 43.7 20.7
70 3.26 43.5 22.5 3.47 43.8 20.9
75 3.40 43.7 22.7 3.59 43.9 21.1
80 3.57 43.9 23.3 3.77 44.2 21.5
85 3.76 44.2 24.1 3.85 44.3 21.9
90 3.97 44.5 25.2 4.14 44.7 22.3
95 4.34 45.0 26.7 4.37 45.0 23.1
97 4.59 45.3 27.8 4.72 45.5 23.4
98 4.83 45.6 29.0 4.80 45.6 23.9
99 5.10 46.0 31.4 5.25 46.2 24.5
Chart I – Factors affecting the validity of the body mass index
Phases of life Limitations Authors
Childhood and adolescence • Weight and height grow at distinct proportions throughout life Sinclair 1
• Growth differences in regard to the maturation process Daniels et al 6 3;
(ex. menarcheal age and the peak height velocity time) Michielutte et al 5 5
• Influence of height
• Proportionality: trunk and lower limb relations Malina et al 5 7
• Age, sexual dimorphism, ethnicity, and social class Gallagher et al 3 3;
Bellizzi et al 3 4
Adults • Correlation with height, which, despite being low, is still significant Brambilla et al.5 4;
Garn et al 5 9
• High lean mass Himes et al 6 1 ;
Deurenberg et al 6 4
• Proportionality: trunk and lower limb relations Garn 6 0
• High specificity and low and variable sensitivity Willett et al 7
Malina et al 5 7
• Reflects neither the body fat nor its distribution Marshall et al 6 5
Elderly • Sarcopenia: muscular mass loss accompanied by an increase in adiposity Seidell et al 6 6
• Centripetal body fat distribution Willtet et al 7;
and not the current body weights are considered, sugges-ting a potentially consistent clinical application.
Finally, it is possible that with the simple height and weight measures and consequent use of the reciprocal ponde-ral index or ectomorphy, the latter for those who work with
so-matotyping, we will be able to detect overweight and obesity in childhood earlier. Better still, we may be able to relate data of children with those of their parents, using the same and single normal range. Further prospective studies are required to confirm or deny the validity of this attractive proposal.
R e f e r e n c e s
1. Sinclair D. Human Growth after Birth. 3rd ed. London: Oxford University
Press, 1978.
2. Ross WD, Carter JEL, Carr RV. Anthropometry Illustrated [CD-ROM]. Burnaby: Turnpike Electronic Publications, 2000.
3. Adams GM. Exercise Physiology - Laboratory Manual. 3rd ed. New York:
Mc-Graw-Hill, 1999.
4. International Obesity Task Force. About Obesity. Available from: URL: http:// www.obesite.chaire.ulavl.ca/iotf.htm in 16/2/2001.
5. World Health Organization. Press release 46. Obesity epidemic puts millions at risk from related diseases. Available from: URL: http://www.who.int/archives/ int-pr-1997//en/pr9 /-46.html in 16/2/2001.
6. Wang JX, Davies M, Norman RJ. Body mass and probability of pregnancy during assisted reproduction treatment: retrospective study. Br Med J 2000; 321: 1321-2. 7. Willett WC, Dietz WH, Colditz GA. Guidelines for healthy weight. N Engl J
Med 1999; 341: 427-34.
8. Bundred P, Kitchiner D, Buchan I. Prevalence of overweight and obesity chil-dren between 1989 and 1998: population based series of cross sectional stu-dies. Br Med J 2001; 322: 1-4.
9. Chinn S, Rona RJ. Prevalence and trends in overweight and obesity in three cross sectional studies of British children, 1974-94. Br Med J 2001; 322: 24-6. 10. Cole TJ, Bellizzi MC, Flegal KM, Dietz WH. Establishing a standard definition
for child overweight and obesity worldwide: international survey. Br Med J 2000; 320: 1240-3.
11. Center for Disease Control and Prevention. Body mass index-for-age: BMI is used differently with children than it is with adults. Available from: URL: http:/ www.cdc.gov/nccdphp/dnpa/bmi/bmi-for-age.htm in 25/9/2000.
12. Fregal KM, Carroll MD, Kuczmarski RJ, Johnson CL. Overweight and obesity in United States: prevalence and trends, 1960-1994. Int J Obes Metab Disord 1998; 22: 39-47.
13. Instítuto Brasileiro Geografia e Estatística. Pesquisa de padrão de vida (PPV). Disponível em URL: http:/www.ibge.gov.br/imprensa/noticias/ppv11.htm in 26/8/1998.
14. National Task Force on the Prevention and Treatment of Obesity. Overweight, obesity, and health risk. Arch Intern Med 2000; 160: 898-904.
15. Wei M, Kampert JB, Barlow CE, et al. Relationship between low
cardiorespirato-ry fitness and mortality in normal-weight, overweight, and obese men. JAMA 1999; 282: 1547-53.
16. Eckel RH, Krauss RM. American Heart Association call to action: obesity as a major risk factor for coronary heart disease. Circulation 1998; 97: 2099-100. 17. Krauss RM, Eckel RH, Howard BV, et al. Revision 2000: a statement for
healthca-re professionals from the Nutrition Committee of the American Heart Association. Circulation 2000; 102: 2284-99.
18. Kries RV, Koletzko B, Sauerwald T, et al. Breast feeding and obesity: cross-sec-tional study. Br Med J 1999; 319: 147-50.
19. Grundy SM, Benjamin IJ, Burke GL, et al. Diabetes and cardiovascular disease: a statement for healthcare professionals from the American Heart Association. Circulation 1999; 100: 1134-46.
20. Eckel RH. Obesity and heart disease: a statement for healthcare professional from the nutrition committee, American Heart Association. Circulation 1997; 96: 3248-50.
21. Redline S, Tishler PV, Schluchter M, Aylor J, Clark K, Graham G. Risk factors for sleep-disordered breathing in children. Association with obesity, race, and res-piratory problems. Am J Respir Crit Care Med 1999; 159: 1527-32. 22. Pi-Sunyer FX. Medical hazards of obesity. Ann Intern Med 1993; 119: 655-60. 23. Hall IJ, Newman B, Millikan RC, Moorman PG. Body size and breast cancer risk black womaen and white women: the Carolina Breast Cancer Study. Am J Epide-miol 2000; 151: 754-64.
24. Huang Z, Hankinson SE, Colditz GA, et al. Dual effects of weight and weight gain on breast cancer risk. JAMA 1997; 278: 1407-11.
25. Giovannucci E, Colditz GA, Stampfer MJ, Willett WC. Physical activity, obesity, and risk of colorectal adenoma in women. Cancer Causes Control 1996; 7: 253-63.
26. Ballard-Barbash R, Swanson CA. Body weight: estimation of risk for breast and endometrial cancers. Am J Clin Nutr 1996; 63(suppl 3): S437-41.
27. Lee IM, Paffenbarger RS Jr. Quetelet’s index and risk of colon cancer in college alumni. J Natl Cancer Inst 1992; 84: 1326-31.
28. Garfinkel l. Overweight and cancer. Ann Intern Med 1985; 103: 1034-6. 29. Hanley AJG, Harris SB, Gittelsohn J, Wolever TMS, Saksvig B, Zinman B.
30. Mokdad AH, Serdula MK, Dietz WH, Bowman BA, Marks JS, Koplan JP. The spread of the obesity epidemic in the United States. JAMA 1999; 282: 1519-22. 31. Eriksson JG, Forsén T, Tuomilehto J, Winter PD, Osmond C, Barker DJP. Catch-up growth in childhood and death from coronary heart disease: longitudinal study. Br Med J 1999; 318: 427-31.
32. Lean MEJ, Han TS, Seidell JC. Impairment of health and quality of life using new US Federal Guidelines for the identification of obesity. Arch Intern Med 1999; 159: 837-43.
33. Gallagher D, Heymsfield SB, Heo M, Jebb SA, Murgatroyd PR, Sakamoto Y. Healthy percentage body fat ranges: an approach for developing guidelines ba-sed on body mass index. Am J Clin Nutr 2000; 72: 694-701.
34. Bellizzi MC, Dietz W. Workshop on childhood obesity: summary of the dis-cussion. Am J Clin Nutr 1999; 70: S173-5.
35. Mo-Suwan L, Pongprapai S, Junjana C, Puetpaiboon A. Effects of a controlled trial of a school-based exercise program on the obesity indexes of preschool chil-dren. Am J Clin Nutr 1998; 68: 1006-11.
36. Moore LL, Nguyen UDT, Rothman KJ, Cupples LA, Ellison RC. Preschool phy-sical activity level and change in body fatness in young children. Am J Epidemiol 1995; 142: 982-8.
37. Oliveira F. Magras e poderosas. Revista Veja, 2001; Jan 10: 1682.
38. Rubinstein S, Caballero B. Is Miss America an undernourished role model. JAMA 2000; 283: 1569.
39. Smalley KJ, Knerr NA, Kendrick ZV, Colliver JA, Owen OE. Reassessment of bo-dy mass indices. Am J Clin Nutr 1990; 52: 405-8.
40. Ross WD, Drinkwater DT, Bailey DA, Marshall GR, Leahy RM. Kinanthropo-metry: traditions and new perspectives. In: Ostyn M, Beunen G, Simons J, edi-tors. Kinanthropometry II. Baltimore: University Park Press; 1980: 3-26. 41. Heath BH, Carter JEL. A comparison of somatotype methods. Am J Phys
Anthro-pol 1966; 24: 87-100.
42. Heath BH, Carter JEL. A modified somatotype method. Am J Phys Anthropol 1967; 27: 57-74.
43. Araújo CGS. Fundamentos Biológicos/Medicina Desportiva: Rio de Janeiro: Ao Livro Técnico, 1985.
44. Ricardo DR, Araújo CGS. Teste de sentar-levantar: influência do excesso de peso corporal em adultos. Rev Bras Med Esporte 2001; 7: 45-52.
45. Marcondes E, Gonzalez CH, Machado DVM, D’Agostino G, Zuccolotto M, Se-tian N. Crescimento normal e deficiente. 2n d ed. São Paulo: Sarvier, 1978.
46. Geigy Scientific Tables 3: physical chemistry, composition of blood, hematology, and somatometric data. New Jersey: Ciba Geigy, 1984.
47. Araújo DSM, Chaves CPG, Ricardo DR, Oliveira EG, Nizzo W, Araújo CGS. Peso corporal em universitários: autopercepção e satisfação. IN: Anais do XIII Simpósio Internacional de Ciências do Esporte: 5 a 8 de outubro de 2000: São Paulo, Brasil. São Paulo: Celafiscs, 2000: 80.
48. Guo SS, Chumlea WC. Tracking of body mass in children in relation to over-weight in adulthood. Am J Clin Nutr 1999; 70(suppl): S145-8.
49. Dietz WH. Therapeutic strategies in childhood obesity. Horm Res 1993; 39 (suppl 3): 86-90.
50. Gunnell DJ, Frankel SJ, Nanchahal K, Peters TJ, Smith GD. Childhood obesity and adult cardiovascular mortality: a 57-y follow-up study based on the Boyd Orr cohort. Am J Clin Nutr 1998; 67: S1111-8.
51. Guillaume M. Defining obesity in childhood: current practice. Am J Clin Nutr 1999; 70: S126-30.
52. Sardinha LB, Going SB, Teixeira P, Lohman T. Receiver operating characteristic analysis of body mass index, triceps skinfold thickness, and arm girth for obesity screening in children and adolescents. Am J Clin Nutr 1999; 70: 1090-5. 53. Poskitt EME. Defining childhood obesity: the relative body mass index (BMI).
Act Paediatric 1995; 84: 961-3.
54. Brambilla P. Body mass index in patients with unusual proportions [letter to edi-tor] Am J Clin Nutr 1997; 66: 1295.
55. Michielutte R, Diseker RA, Corbett WT, Schey HM, Ureda JR. The relationship between weight-height indices and the triceps skinfold measure among children age 5 to 12. Public Health Briefs 1984; 74: 604-6.
56. Micozzi MS, Albanes D, Jones DY, Chumlea WC. Correlation of body mass indi-ces with weight, stature, and body composition in men and women in NHANES I and II. Am J Clin Nutr 1986; 44: 725-31.
57. Malina RM, Katzmarzk PT. Validity of the body mass index as an indicator of the risk and presence of overweight in adolescents. Am J Clin Nutr 1999; 70: S131-6.
58. Lee J, Kolonel LN, Hinds MW. Relative merits of weight-corrected-for-height indices. Am J Clin Nutr 1981; 34: 2521-9.
59. Garn SM, Leonard WR, Hawthorne VM. Three limitations of the body mass in-dex[letter]. Am J Clin Nutr 1986; 44: 996-7.
60. Garn SM. Body mass index in patients with unusual proportions[letter to edi-tor]. Am J Clin Nutr 1997; 66: 1294.
61. Franklin MF. Comparison of weight and height relations in boys from 4 coun-tries. Am J Clin Nutr 1999; 70(suppl): S157-62.
62. Himes JH, Dietz WH. Guidelines for overweight in adolescent preventive services: recommendations from an expert committee. Am J Clin Nutr 1994; 59: 307-16.
63. Daniels SR, Khoury PR, Morrison JA. The utility of body mass index as a measure of a measure of body fatness in children and adolescents: diferences by race and gender. Pedistrics 1997; 99; 804-7.
64. Deurenberg P, Deurenberg YM, Wang J, Lin FP, Schimidt G. The impact of body build on the relationship between body mass index and percent body fat. Int J Obes Relat Metab Disord 1999; 23: 537-42.
65. Marshall D, Hazlett CB, Spady DW, Conger PR, Quinney HA. Validity of conve-nient indicators of obesity. Hum Biol 1991; 63: 137-53