Hydrogen evolution and consumption in AOT–isooctane
reverse micelles by
Desulfovibrio gigas
hydrogenase
Susana L.A. Andrade
∗, José J.G. Moura
Departamento de Qu´ımica, Centro de Qu´ımica Fina e Biotecnologia, Faculdade de Ciˆencias e Tecnologia, Universidade Nova de Lisboa, 2825-114 Monte de Caparica, Portugal
Received 10 July 2001; accepted 6 February 2002
Abstract
The enzyme hydrogenase isolated from the sulphate reducing anaerobic bacteriumDesulfovibrio gigaswas encapsulated in reverse
micelles of AOT–water–isooctane. The enzyme ability to consume molecular hydrogen was studied as a function of the micelle size (given byWo = [H2O]/[organic solvent]). A peak of catalytic activity was obtained forWo =18, a micelle size theoretically fitting
the heterodimeric hydrogenase molecule. At thisWo value, the recorded catalytic activity was slightly higher than in a buffer system
(Kcat =169.43 s−1against the buffer value of 151 s−1). The optimal buffer used to encapsulate the enzyme was found to be imidazole
50 mM, pH 9.0. The molecular hydrogen production activity was also tested in this reverse micelle medium. © 2002 Elsevier Science Inc. All rights reserved.
Keywords:Hydrogenase;Desulfovibrio gigas; Reverse micelles; Hydrogen production and consumption
1. Introduction
Reverse micelles are one of many model systems believed to possess properties that closely resemble those found in the biological cellular environment[1,2]. They are defined as solutions of amphipatic surfactant molecules that separate and stabilise an aqueous inner core from the outer organic solvent in such a way that the surfactant hydrophobic parts contact with the apolar bulk solution and the polar groups are faced towards an inner aqueous core. Although macro-scopically homogeneous and thermodynamically stable, they can possess up to four different microenvironments: the hydrocarbon solvent, the surfactant molecules and the bound and free water in which any hydrophilic and/or hydrophobic molecule can partition according to its biochemical prefer-ences [3–5]. Many enzymes have been studied in reverse micelles, always keeping or increasing their catalytic activ-ity. Interestingly however, the enzymatic activity appears to be strongly dependent on the reverse micelle size, given by
Wo (Wo =[H2O]/[organic solvent]). A direct relation
be-tween the reverse micelle water content and its inner cavity core radius (rm(Å)=4+1.5×Wo) was established,
allow-ing microscopic information to be easily experimentally set
[6,7]. Consequently, by varying Wo it is possible to
mod-∗Corresponding author. Tel.:+351-21-2948382; fax:+351-21-2948550.
E-mail address:[email protected] (S.L.A. Andrade). URL:http://www.dq.fct.unl.pt/bioin/
ulate the properties of the molecules: atWo≤9, the water
inside the reverse micelle mainly hydrates the polar heads of the surfactant molecules (bound water) and present prop-erties that closely resemble those of the water associated with a membrane structure[8]. AsWoincreases, free water
begins to appear and bell-shaped catalytic activity peak(s) may occur at the so-called “optimal”Wovalue(s)[9]. In the
case of multimeric enzymes, several “optimal” Wo can be
observed[10], associated with the subunit(s) functionality. Ultra sedimentation assays concluded these “optimal Wo”
to be related with a geometrical fit between the enzyme subunit(s) size(s) and the micelle inner radius[11].
In this work, Desulfovibrio gigas hydrogenase activity
was studied in reverse micelles of sodium bis(2-ethylhexyl) sulfosuccinate (AOT), in isooctane. The periplasmic locali-sation of the enzyme in the bacteria cells, slightly associated with the membrane [12], anticipated the interest of using this system; the bound water characteristics [8,13] closely associated with the surfactant molecules, structurally re-sembling phospholipid molecules and recognised as good models for biological membranes may provide hydrogenase a more favourable environment than that of any common buffer solution [14]. This 89.5 kDa molecular weight en-zyme has an average globular shape [15]and contains two different subunit. The small subunit with approximately 28 kDa coordinates one [3Fe–4S] and two [4Fe–4S] clusters while the big subunit with about 60 kDa contains the Ni–Fe active site [12,15]. The hydration/membrane proximity
relationship in the enzyme activity was investigated as a function of the micelle size following the enzyme ability to oxidise hydrogen. The proton reduction activity was also checked at a fixedWo, matching the theoretically “optimal”
Wofitting the heterodimeric molecule.
2. Materials and methods
All chemical reagents were of the highest purity available. AOT (Sigma) was kept in a dry atmosphere under vacuum in order to minimise traces of water molecules. All indi-vidual solutions were previously degassed under argon at-mosphere before used. Methyl viologen (MV) (Sigma) was prepared in the appropriate buffer and sodium dithionite (Merck) was dissolved in 0.1 M Tris–HCl pH 9.0 buffer to minimise traces of bi(sulphide)[16]. The required anaero-bic atmosphere was achieved by carrying out all preparation steps inside an Atmos-bag (Aldrich) cycled with vacuum and argon gas (previously passed throw a heated copper system functioning as an oxygen trap).
2.1. Enzyme purification
All purification procedures were performed aerobically at 4◦C in Tris–HCl pH 7.6 buffer, according to methods
described elsewhere [17]. The enzyme concentration was determined by its absorption intensity at 400 nm (ε400 nm=
46,500 M−1cm−1[12]).
2.2. Preparation of reverse micelles
AOT reverse micelles were prepared according to the injection method [18]. In a typical experiment, an aque-ous volume (v) was added to the AOT in isooctane
solu-tion, according to the desiredWoby the equation:v (ml)= ([AOT]×V (ml)/1000)×18×Wo, whereVis the total
vol-ume of the AOT solution and 18 the molar volvol-ume of water (mol ml−1). Immediately after the aqueous addition(s), the
solution was well shaken until transparency (just a few sec-onds within the tested conditions).
Stock solutions of 0.2 M AOT in isooctane, were prepared at least 1 day before use in order to assure solution stability.
2.3. Hydrogen consumption activity
The activity assays were performed at room tempera-ture (∼25◦C) under anaerobic atmosphere. The hydrogen
consumption was monitored by UV–VIS spectroscopy at 605 nm over time, following the parallel reduction of the electron acceptor, MV (ε605 nm = 13,000 M−1cm−1),
schematised in the equation below[12]
H2+MV2+→2H++MV+.
The reaction mixture was directly prepared in a quartz UV–VIS cell equipped with a rubber cap. The enzyme stock
solution was previously exposed to hydrogen gas for about 1–2 h to reach the enzyme active state[12,19]. The reaction was then started by the addition of enzyme followed by an extra exposition to hydrogen gas for about 1–7 min (at constant flow) until a slight blue colour started to appear, corresponding to the reduced MV formation. The reaction progression curve could then be followed using a split beam UV-2101/PC Shimadzu spectrophotometer.
A tangent to the initial linear part of the reaction progres-sion curve was drawn and initial velocities were calculated inmol(MV reduced)min−1mg(hydrogenase)−1, for every tested
MV concentration. The maximal velocity of the enzymatic reaction (Vmax,M min−1) and the Michaelis–Menten
con-stant (KM, mM) were then calculated from Lineweaver–Burk
linearizations. A minimum least square fit of the experi-mental points using a simple Michaelis–Menten equation
[20]was also used to reconfirm the kinetic results and the catalytic activity (Kcat = Vmax/[hydrogenase], s−1) was
determined.
The experimental conditions described above were used for the kinetic assays both in buffer and in reverse micelles in order to compare the enzyme behaviour in both systems.
2.4. Hydrogen evolution activity in reverse micelles of Wo=18
The enzyme ability to produce molecular hydrogen was measured by gas chromatography from solutions of dithion-ite reduced MV according to the reaction[21]
MV+
+2H+→MV2++H2.
The reaction mixture was prepared and sealed in vials in-side the Atmos-bag under anaerobic conditions, as described above. To assure that the MV remained reduced inside the vials, some grains of sodium dithionite were added to the stock solution of 0.1 M AOT in isooctane. After a short in-cubation at 37◦C in a thermostatic bath the reaction was
started by the enzyme addition and a fixed volume from the gas phase of the vial was taken with a gas-tight Hamilton syringe and injected into the gas chromatographer. Peak ar-eas were recorded over time and the enzyme specific ac-tivity was calculated using a calibration curve, previously performed with known amounts of injected hydrogen gas.
The gas chromatograph, a Hewlett-Packard 5890 series II was equipped with a thermal conductivity detector (TCD) and the column used was an 2nx1/8′′ SS molecular sieves
5 Å 100/120. The injector temperature was set to 150◦C,
the oven temperature to 100◦C and the detector temperature
was 200◦C. The carrier gas flow was 20 ml min−1.
3. Results and discussion
3.1. Hydrogenase encapsulation in AOT reverse micelles
Fig. 1. UV–VIS spectra of encapsulated hydrogenase in 0.2 M AOT reverse micelles as a function of Wo (3–26). Increasing amounts of 66.7M hydrogenase stock solution were added to 1 ml of 0.2 M AOT
solution in order to increase the aqueous volume in the solution and con-sequently the micelle size (Wo=3 to 26, from bottom to top spectra). Inset: molar extinction coefficients calculated at 400 nm, considering the protein concentration increments as Wo was varied. The broken line shows the extinction coefficient value reported for a buffer medium (ε400 nm=46,500 M−1cm−1).
26. It is possible to conclude the protein overall conforma-tion was kept since its spectra remained unchangeable over the tested experimental conditions. Moreover, the enzyme extinction coefficient at 400 nm was found stable at about 51,000 M−1cm−1, a value slightly higher than the one
re-ported in buffer media. The extinction coefficient stability towards smaller reverse micelles is a clear indication that the absence of free water in favour of the more structured water (hydrating the surfactant molecules), does not signifi-cantly affect the protein. It should again be pointed out that hydrogenase is found in the periplasm ofD. gigascells and
thus it is not surprising that an environment mimicking the highly structured water close to biological membranes does not highly perturb the enzyme.
3.2. Hydrogen consumption as a function of the micelle size
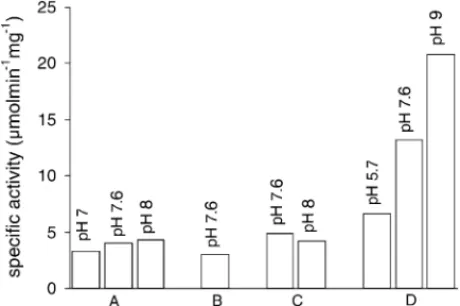
Fig. 2shows the hydrogen consumption rates of hydro-genase solubilized in 0.2 M AOT reverse micelles, atWo=
18 under different buffer conditions. From these results it is clear that the enzyme is more active in 50 mM imidazole buffer at pH equal to 9.0. In aqueous conditions, on the con-trary, the optimal buffer conditions for the hydrogen uptake was reported to occur with Tris–HCl at pH 7.5–8.0[22]. The results can be explained considering previous reports indi-cating that the pH inside a reverse micelle can be shifted up to two pH units higher[23,24]. In this situation the ini-tial buffer pH (pH=9.0) could correspond to an aqueous
Fig. 2. Initial rates for the hydrogen oxidation reaction with several buffers and pH values in reverse micelles of 0.2 M AOT at fixed Wo = 20. The activity tests conditions for hydrogenase encapsulated with several different buffers (A—Tris–HCl 20 mM; B—potassium phosphate 20 mM; C—imidazole 20 mM; and D—imidazole 50 mM, in the pH values stated in the graphic) were always kept constant and the UV–VIS cell had 1.5 ml 0.2 M AOT in isooctane, 46 nM hydrogenase and 1.2 mM methyl viologen.
core reverse micelle pH that closely mimic the reported op-timal found for an aqueous medium. Regarding the imida-zole results against Tris–HCl buffer, once more this seems to be a good buffer to consider in reverse micelle studies, as was demonstrated before using spin labelled reverse mi-celles (unpublished results).
The enzyme specific activity (mol min−1mg−1) in this
buffer (50 mM imidazole, pH 9.0) was also confirmed to be proportional to the enzyme concentration in the range of 46 to 92 nM when encapsulated in 0.2 M AOT reverse micelle of Wo=18, while MV was kept constant at 2.5 mM (data
not shown).
Kinetic assays varying the MV concentration for each tested reverse micelle size (Wo) were also performed and
are presented inFig. 3. The results confirm that the enzyme catalytic activity (Kcat) is kept and, as expected, depends
on the micelle size. The optimal experimental conditions to follow the hydrogen consumption occurred atWo=18.
Moreover, at this point the catalytic activity (169.43 s−1) is
slightly higher than the one we recorded under the same conditions in a buffer medium (151 s−1).
As mentioned before, the micelle inner cavity core radius (rm) can be directly related toWoby the equation:rm(Å)=
4+1.5×Wo. Furthermore, the mean protein radius (rp) can
be estimated to its molecular weight value,Mr(g mol−1) by
the equation:rp(Å)=0.7×(Mr)1/3[7,25]. Taken together,
this equations predict for hydrogenase an “optimal” activity peak atWo∼18, in agreement with our results.
Away from the “optimal” mentionedWo, the enzyme
ac-tivity is rather low compared to the values found in buffer. For reverse micelles with Wo bigger than the “optimal”
(Wo = 20), the decrease in activity can be mainly
Fig. 3. Hydrogen consumption kinetic parameters found for hydrogenase encapsulated in 0.2 M AOT reverse micelles as a function of the micelles size (Wo). Catalytic efficiency of hydrogenase in reverse micelles (top) and the enzyme specificity towards methyl viologen (bottom) for the hydrogen oxidation reaction, tested at micelle sizes fitting the small subunit (Wo∼11), the big subunit (Wo ∼16), the heterodimer (Wo∼18) and atWo = 20. Assays were always performed with 45 nM hydrogenase encapsulated in 1.5 ml 0.2 M AOT in isooctane in imidazole buffer 50 mM pH 9.0 and for different concentrations of methyl viologen. Each point represents a full kinetic assay and values are reported considering the overall micellar solution. Broken line in each graphic represents the value found in a buffer medium under the same experimental conditions.
optimal for pH=9.0 withWo=18 reverse micelles) may
no longer suffer the proposed shift towards lower values but become closer to the real added pH. As already mentioned, the hydrogenase activity decreases for pH values away from pH=7.5–8.0[22].
3.3. Enzymatic hydrogen production
Hydrogen production by the enzyme encapsulated in reverse micelles was followed by gas chromatography at
Wo =18, following procedures previously described [17].
In Fig. 4 the hydrogen production assay, for 1.8 nM en-zyme, ∼2 mM MV reduced with sodium dithionite in a
total volume of 3.0972 ml, yielded a specific activity of
Fig. 4. Hydrogen production curve for hydrogenase encapsulated in reverse micelles of 0.2 M AOT atWo=18. The hydrogen production followed over time in a reverse micelle solution with ∼2 mM methyl viologen (sodium dithionite reduced) and 1.8 nM hydrogenase in imidazole 50 mM pH 9.0 buffer. Assay was measured at 37◦C after enzyme addition.
The points marked with X represent those used to draw a straight line (r2=0.9903) from which the specific activity was calculated.
244mol min−1mg−1. Although it is obvious the
possibil-ity to follow this reaction in reverse micelles it is also clear that the specific activity obtained was somehow low with respect to the aqueous activity found in the pure protein fraction, about 440mol min−1mg−1[26,27].
4. Conclusion
We demonstrate here that the hydrogenase from the sul-phate reducing bacteriaD. gigaskeeps its activity towards
hydrogen consumption in a system that closely resembles the conditions the enzyme may find in a cell environment. As expected no peak of activity for the small subunit was detected since this 28 kDa subunit contains the [3Fe–4S] and the [4Fe–4S] electron carriers clusters and not the Ni–Fe active site, where the catalysis of protons or hydrogen is thought to occur. The decrease in activity observed for mi-celles bigger than the heterodimer size may be related with the tendency, as the bulk water predominates, for the exter-nal pH buffer to resemble the real pH inside the micelles, thus decreasing the activity as was found in buffer medium before.
The hydrogen production reaction, only tested forWo=
18, allow us to conclude on the possibility to follow this reaction in reverse micelles.
The study of this enzyme in the AOT/isooctane reverse micelle system is the last in a group of studies on the be-haviour of flavodoxin[28]and aldehyde oxidoreductase (un-published results) fromD. gigasand cytochromec3[29,30]
in reverse micelles. These sets ofD. gigasproteins were
re-ported to be able to participate in an in vitro electron transfer chain starting with aldehyde catalysis by the aldehyde ox-idoreductase enzyme and ending with molecular hydrogen production by hydrogenase[31]. The next step should be the encapsulation of all these proteins in reverse micelles, con-sidering their individual behaviour in the previous reverse micelle studies and observe the electron transfer chain under these environmental conditions.
Acknowledgments
This work was supported by Fundação para a Ciˆencia e Tecnologia, PRAXIS Grants 2/2.2/QUI/3/94 (I.M.), 2/2.1/BIO/05/94 (JJGM) and BD/11534/97 (SLA). We would like to thank M. Carepo and A. Pamplona for the hydrogenase samples used in this work and A. Levashov for helpful discussions.
References
[1] Bru R, Sanchez-Ferrer A, Garcia-Carmona F. Biochem J 1995;310:721–39.
[3] Hilhorst R, Spruijt R, Laane C, Veeger C. Eur J Biochem 1984;144:459–66.
[4] Nicot C, Vacher M, Vincent M, Gallay J, Waks M. Biochemistry 1985;24:7024–32.
[5] Drost-Hansen W, Clegg JS, editors. Cell-associated water. New York: Academic Press, 1979.
[6] Zulauf M, Eicke H. J Phys Chem 1979;88:480–6.
[7] Kabanov AV, Klyachko NL, Nametkin SN, Merker S, Zaroza AV, Bunik VI, et al. Protein Eng 1991;4:1009–17.
[8] Dáprano A, Lizzio A, Liveri VT, Aliotta F, Vasi C, Migliardo P. J Phys Chem 1988;92:4436–9.
[9] Levashov AV, Rarity RV, Martinek K, Klyachko NL. FEBS Lett 1993;336:385–8.
[10] Martinek K, Klyachko NL, Kabanov AV, Khmelnitsky YL, Levashov AV. Biochim Biophys Acta 1989;981:161–72.
[11] Kabanov AV, Nametkin SN, Evtushenko GN, Chernov NN, Klyachko NL, Levashov AV, et al. Biochim Biophys Acta 1989;996:147–52. [12] Cammack R, Fernandez VM, Hatchikian C. Meth Enzymol
1994;243:43–69.
[13] Day RA, Robinson BH, Clarke JHR, Voherty JV. J Chem Soc, Faraday Trans 1979;75:132–9.
[14] Lysko AI, Surkov SA, Arutyunyan AM, Khmelnitsky YL, Klyachko IL, Levashov AV, et al. Biophysics 1986;31:252–8.
[15] Volbeda A, Charon M, Piras C, Hatchikian EC, Frey M, Fontecilla-Camps JC. Science 1995;373:580–7.
[16] Mayhew SG. Eur J Biochem 1978;85:535–47.
[17] Teixeira M, Moura I, Xavier AV, Moura JJG, LeGall J, DerVertanian DV, et al. J Biol Chem 1985;260:8942–50.
[18] Martinek K, Levashov AV, Klyachko NL, Berezin IV. Dokl Akad Nauk 1977;236:920.
[19] LeGall J, Ljungdahl PO, Moura I, Xavier AV, Moura JJG, Teixeira M, et al. Biochem Biophys Rev Commun 1982;106:610–6. [20] Cornish-Bowden A. Fundamentals of enzyme kinetics. London:
Portland Press Ltd., 1981.
[21] Rao KK, Rosa L, Hall DO. Biochem Biophys Res Commun 1976;68:21.
[22] Lespinat PA, Fauque G, Czechowski M, Dimon B, LeGall J. Biochimie 1986;68:55–61.
[23] Grandi C, Smith RE, Luisi PL. J Biol Chem 1981;256:837–43. [24] Ohshima A, Narita H, Kito M. J Biochem 1983;93:1421–5. [25] Levashov AV. Chemical and enzyme reactions. In: Berezin IV, editor.
Surfactants in solution. Moscow: VINITI Publishers, 1987. [26] Odom JM, Peck Jr HD. Ann Rev Microbiol 1984;38:551–92. [27] Przybyla AE, Robbins J, Menon N, Peck Jr HD. FEMS Microbiol
Rev 1992;88:109–36.
[28] Andrade SL, Kamenskaya O, Levashov AV, Moura JJG. Biochem Biophys Res Commun 1997;234:651–4.
[29] Lysko AI, Surkov SA, Arutyunyan AM, Khmelnitsky YL, Klyachko IL, Levashov AV, et al. Biophysics 1986;31:252–8.
[30] Castro MJM, Moura JJG, Cabral JMS. Advances in gene technology: protein production and purification, Miami, 1988.