ARTIGO ORIGINAL
RESUMO
Introdução: Com o aumento de longevidade importa também viver melhor. Um passo crucial neste sentido é aumentar o conhecimento sobre a saúde física e psicológica da população mais velha. O objetivo deste estudo foi caraterizar o estado nutricional, função cognitiva, estado funcional, sintomas de depressão, e solidão dos Portugueses com 65 ou mais anos, por sexo e grupo etário. Material e Métodos: Estudo transversal incluindo uma amostra representativa nacional de indivíduos ≥ 65 anos a residir na comunidade. Entrevistadores treinados recolheram dados face-a-face sobre caraterísticas demográficas e socioeconómicas, estado de saúde, estado nutricional, função cognitiva, estado funcional (atividades instrumentais da vida diária), sintomas de depressão, e sentimentos de solidão. Procedimentos adequados a amostras complexas foram utilizados na análise estatística.
Resultados: No total participaram 1120 indivíduos (49,0% mulheres; 21,3% ≥ 85 anos). A prevalência estimada de risco de malnutrição foi 16,4% (intervalo de confiança: 95%: 13,3 – 19,9), enquanto que 17,7% (intervalo de confiança: 95%: 12,8 – 23,9) apresentavam função cognitiva comprometida, e 28,5% (intervalo de confiança: 95%: 23,7 – 33,8) tinham limitações para realizar atividades da vida diária. Adicionalmente, 23,5% (intervalo de confiança: 95%: 19,7 – 27,7) apresentavam sintomas de depressão e 13,6% (intervalo de confiança: 95%: 10,6 – 17,1) relatavam sentimentos de solidão. Estas condições eram mais prevalentes nas mulheres, e geralmente mais frequentes nos mais velhos (≥ 85 anos).
Discussão: Risco de malnutrição, comprometimento cognitivo, limitações funcionais, depressão e solidão são moderadamente frequentes, justificando rastreios e ações preventivas de base comunitária.
Conclusão: Este estudo contribuiu para a caraterização da saúde dos Portugueses com mais de 65 anos, o que pode suportar políticas e intervenções dirigidas às necessidades da população mais velha.
Palavras-chave: Actividades da Vida Diária; Avaliação Geriátrica; Depressão; Idoso; Idoso com 80 anos ou mais; Portugal; Solidão
Geriatric Assessment of the Portuguese Population Aged
65 and Over Living in the Community: The PEN-3S Study
Avaliação Geriátrica da População Portuguesa Com 65 ou
Mais Anos a Residir na Comunidade: Estudo PEN-3S
1. Instituto de Medicina Preventiva e Saúde Pública. Faculdade de Medicina. Universidade de Lisboa. Lisboa. Portugal. 2. Instituto de Saúde Ambiental. Faculdade de Medicina. Universidade de Lisboa. Lisboa. Portugal.
3. Escola Superior de Saúde de Leiria. Instituto Politécnico de Leiria. Leiria. Portugal.
4. Centro de Investigação e Estudos de Sociologia. Instituto Universitário de Lisboa. Lisboa. Portugal. 5. Institute of Public Health. University of Porto. Porto. Portugal.
6. Department of Public Health and Forensic Sciences and Medical Education. Faculty of Medicine. University of Porto. Porto. Portugal. Autor correspondente: Teresa Madeira. [email protected]
Recebido: 16 de setembro de 2019 - Aceite: 04 de novembro de 2019 | Copyright © Ordem dos Médicos 2020
Teresa MADEIRA1,2, Catarina PEIXOTO-PLÁCIDO1,2, Nuno SOUSA-SANTOS1,3, Osvaldo SANTOS1,2, Violeta
ALARCÃO1,2,4, Paulo Jorge NICOLA1,2, Carla LOPES5,6, João GORJÃO CLARA1,2
Acta Med Port 2020 Jul-Aug;33(7-8):475-482 ▪ https://doi.org/10.20344/amp.12832
ABSTRACT
Introduction: As populations live longer, they also aim to live better. A crucial step for this is to improve the understanding about older adults’ physical and psychological health. Therefore, the aim of the present study was to characterise the Portuguese population over-65 regarding nutritional status, cognitive function, functional status, symptoms of depression, and loneliness, by sex and age groups. Material and Methods: Cross-sectional study including a nationally representative sample of community-dwelling adults aged 65 and over. Trained interviewers collected data face-to-face on demographic and socioeconomic characteristics, health status, nutritional status, cognitive function, functional status for activities of daily living, symptoms of depression, and loneliness feelings. Complex sample procedures were used in the statistical analysis.
Results: Overall, 1120 community-dwellers (49.0% women, 21.3% aged ≥ 85) participated in the study. The estimated prevalence of risk of malnutrition was 16.4% (95% confidence interval: 13.3 – 19.9), while 17.7% (95% confidence interval: 12.8 – 23.9) were cognitively impaired, and 28.5% (95% confidence interval: 23.7 – 33.8) presented limitations to perform daily living activities. Moreover, 23.5% (95% confidence interval: 19.7 – 27.7) presented symptoms of depression and 13.6% (95% confidence interval: 10.6 – 17.1) reported loneliness feelings. These conditions were more prevalent among women, and generally more frequent in the oldest individuals (≥ 85). Discussion: Risk of malnutrition, cognitive impairment, functional limitations, depression and loneliness were moderately frequent, which may justify screening and preventive actions at a community level.
Conclusion: This study contributed to a national characterisation of the health of older adults, that may inform policies and interventions targeted at the needs of the Portuguese aging population.
Keywords: Activities of Daily Living; Aged; Aged, 80 and over; Depression; Geriatric Assessment; Loneliness; Portugal
INTRODUCTION
In 2017, 21.3% of the Portuguese population were 65 years old and over, the third highest proportion in the Euro-pean Union-28.1 This percentage has been rising in the last
few years mainly due to lower rates of fertility and prema-ture mortality, in addition to higher life expectancy.2 Thus,
after decades of research and successful efforts to increase longevity, the major concern nowadays is to guarantee a healthy ageing, i.e. ‘developing and maintaining the func-tional ability that enables well-being in older age’.3,4
ARTIGO ORIGINAL physical and psychosocial modifications that occur with ageing. Additionally, health status is influenced by the
con-sequences of prevalent diseases among older people (e.g. dementia, diabetes, osteoarthritis), due to the aforemen-tioned underlying changes and to the life-course cumula-tive effect of different risk factors.4 For example, muscle
and bone mass tend to decrease with age, which alone may impact mobility, but also increase the risk of falls and fractures.5 Moreover, impairment of vision and hearing
functions become more frequent, which may affect social interactions, learning and autonomy.6,7 There is also some
decrease in memory capacity and speed of information pro-cessing, even in the absence of dementia.4 All previously
mentioned modifications may lead, for instance, to loss of autonomy and social isolation, which in turn may contribute to depression and/or cognitive decline.8,9 Briefly, the
multi-ple clinical conditions that affect older persons are frequent-ly cause and consequence of each other and interact to perpetuate a vicious circle that undermines functional ability and quality of life.4,9
Therefore, it is crucial to follow a multidimensional, non-disease specific model to assess the health of older adults, such as the Comprehensive Geriatric Assessment (CGA).9
The main goal of this process is to improve the well-being of older adults through the identification of needs and condi-tions that are frequently under-reported by older people and may go under-recognised by caregivers and health profes-sionals due to subtle or atypical clinical presentations.9,10
The structure and length of a geriatric assessment var-ies, but it generally evaluates physical health, functional status, psychological health, and social support. At the indi-vidual level, the assessment is usually followed by an inter-vention plan targeted at the identified needs, and by long-term follow-up.9–11 At a population level, geriatric standard
assessments are critical to characterise the health status of the older population in order to develop adequate public health policies and interventions.
Nevertheless, national representative data is scarce on most of the geriatric assessment dimensions. Such an epidemiological profile would also be relevant to clinical practice. It would inform healthcare professionals about the specific prevalence of common conditions among older adults, and how their patients’ characteristics compare to their counterparts. Therefore, the main goal of the present study was to characterise the Portuguese population aged 65 and over living in the community in terms of the following dimensions: nutritional status, cognitive function, functional status, symptoms of depression, and loneliness feelings, by sex and age groups. These particular set of dimensions (except for loneliness) are part of the CGA proposed by the Portuguese Society of Internal Medicine.12
MATERIAL AND METHODS Study design and subjects
The present study followed a cross-sectional design. It included a nationally representative sample of community-dwelling older adults (aged 65 and over) living in Portugal
that participated in the PEN-3S (acronym for Portuguese
Elderly Nutritional Status Surveillance System) project,
which is detailed elsewhere.13 Sampling and data collection
described here resulted from a collaboration with the Na-tional Food, Nutrition and Physical Activity Survey (IAN-AF) 2014–2016.14 Briefly, a multistage approach sampling was
followed. First, primary health care units were randomly se-lected, stratified by the seven NUTS II (nomenclature of Ter-ritorial Units for Statistics, as defined by the European Un-ion), and weighted by the number of individuals registered in each unit. Second, registered individuals in each unit were randomly selected from the National Health Registry, according to sex and age group. Selected individuals were contacted by phone and letter and invited to participate in this survey. Individuals were considered non-eligible and excluded from this study if: living in collective residences or institutions (e.g., in hospitals, prisons, or military barracks); living in Portugal for less than one year; non-Portuguese speakers; not able to understand and/or answer the ques-tionnaire due to dementia, psychiatric disease or severe hearing and/or visual impairment; bedridden. When it was not possible to contact selected subjects after all planned attempts, their eligibility was classified as ‘unknown’. Inter-views were scheduled with those who accepted to enrol. In total, 1120 individuals aged 65 and over from all seven Portuguese main regions (NUTS II) accepted to participate in this study. The participation rate, given as the ratio ac-cepted/invited to enrol, was approximately 23%.
All procedures involving human subjects were approved by the National Data Protection Committee, Academic Med-ical Centre of Lisbon (Centro Académico de Medicina de Lisboa, CAML) Ethics committee, and all seven Regional Health Administrations Ethics committees.
Data collection procedures and instruments
Following written informed consent, trained nutritionists interviewed the subjects at the healthcare unit or, less fre-quently, at the participant’s home. Data were collected face-to-face, from October 2015 to September 2016, through computer-assisted structured interviews, based on standard questionnaires followed by anthropometric measurements. Data collection included demographic and socioeconomic characteristics (sex, age, educational level, marital status and monthly income), reported clinical diagnoses, self-reported health status, nutritional status (anthropometry and Mini Nutritional Assessment), cognitive function, func-tional status for instrumental activities of daily living (IADLs), symptoms of depression, and loneliness feelings.
General health status
Concerning clinical diagnoses, participants were asked if they had any disease requiring regular healthcare, and also if they were ever diagnosed, by a physician, with any of the following (self-reported information): cardiac disease, cancer, diabetes type 2, hypertension, dyslipidaemia, gas-trointestinal disease, arthritis, or osteoporosis. These ques-tions had a ‘yes/no’ response format. Individuals were also
ARTIGO ORIGINAL asked to rate their own general health in a 5-point scale
ranging from ‘1 – excellent’ to ‘5 – very poor’.15
Anthropometric measurements followed the internation-al standards for anthropometric assessment, as described elsewhere, and were performed with participants wearing minimal clothing and no shoes.13,14,16 Weight and height
were used to calculate body mass index (BMI = weight [kilograms, kg] / height [meters, m]2). When it was not
pos-sible to follow the aforementioned standards, hand length was determined and used to estimate height with the ap-propriate validated Portuguese equations.17 BMI, arm and
leg circumferences were employed to score the respective items in the Mini Nutritional Assessment. Additionally, BMI was used to categorise individuals into the World Health Or-ganization (WHO) categories: < 18.5 kg/m2; 18.5 – 24.9 kg/
m2; 25 – 29.9 kg/m2, ≥ 30.0 kg/m2.18
Geriatric assessment dimensions
The 18-item form of the Mini Nutritional Assessment (MNA® full form) was administered to assess nutritional
sta-tus.19–21 MNA was developed to identify malnutrition defined
as ‘a state resulting from lack of intake or uptake of nutrition leading to diminished physical and mental function and im-paired clinical outcome from disease’,22 not to identify
over-nutrition or excess weight. The MNA version that uses calf circumference instead of BMI was employed when the latter was not available (missing weight).23 MNA total score,
indi-viduals were classified as follows: normal nutritional status (24 – 30 points), at risk of malnutrition (17 – 23.5 points), or malnourished (< 17 points).
Cognitive function was assessed by the Mini Mental State Examination (MMSE).24 Maximum score is 30 points.
The Portuguese cut-offs for cognitive impairment were ap-plied, according to the number of years the participant at-tended school: 0 years ≤ 15 points; 1 – 11 years ≤ 22 points; > 11 years ≤ 27 points.25 When subjects were classified as
cognitively impaired (n = 192/1120), interviewers only col-lected data about demographic and socioeconomic charac-teristics, and nutritional status (anthropometry and MNA). The 15-item version of the Geriatric Depression Scale (GDS-15) was used to evaluate symptoms of depression.26
The final score ranges from zero to 15, and, in this study, a score below five indicated the presence of symptoms of depression.27 In order to assess functional status to perform
instrumental activities of daily living, the Lawton scale was administered.28 It includes eight items assessing cognitive
and/or physical function and the total score ranges from zero to eight. In the present study, a score below eight was applied to classify individuals as having functional limita-tions to conduct IADLs. Additionally, UCLA Loneliness scale was used to study the subjective feelings of loneliness.29 In
this scale, scores range from 16 to 64 points (higher values indicating higher feelings of loneliness or social isolation). Following the cut-off studied for the Portuguese older popu-lation, a score above 32 determined the presence of loneli-ness feelings.30
MNA, MMSE, GDS-15, Lawton scale and UCLA
Loneli-ness scale are widely used instruments, both in research and clinical practice. As already mentioned, they are also part of the CGA (except Loneliness scale) proposed by the Portuguese Society of Internal Medicine.12
Statistical methods
Statistical analyses were performed using IBM/SPSS®
version 24, and the statistical significance level of 5% was used. The normality of the distributions was assessed through the Kolmogorov-Smirnov test together with visual inspection of normality plots. Data were weighted accord-ing to the distribution of the Portuguese population, and the probability of selection of the healthcare unit and the individual in each unit, as detailed elsewhere.14 For
demo-graphic and socioeconomic characterisation, data were not weighted, and results are presented as frequencies (%) or mean and standard deviation (sd). Complex sample analy-ses take into account both weighting and design effect, and were therefore used here to characterise the population in terms of general health status and geriatric assessment di-mensions. These results are generally presented as esti-mates and corresponding 95% confidence intervals (95% CI). Additionally, for categorical variables, between-groups differences, namely between women and men, were as-sessed using chi-square test. Furthermore, a test of Model effects (Wald F test) was performed to compare men and women in terms of BMI.
RESULTS
Sample characterisation
Overall, 1120 individuals accepted to participate in the present study. Almost half (49.0%) of the sample were wom-en and 21.3% were aged 85 and over (Table 1). The mean age was 76.0 ± 8.2 years for women, and 75.9 ± 8.1 years for men. Concerning marital status, 31.0% of this sample were widowed, and 59.2% were married or living together. Moreover, 23.4% never attended school, while the highest educational level for 50.9% was primary school. When con-sidering income, 17.9% of the sample reported a monthly income of less than 485€.
General health status
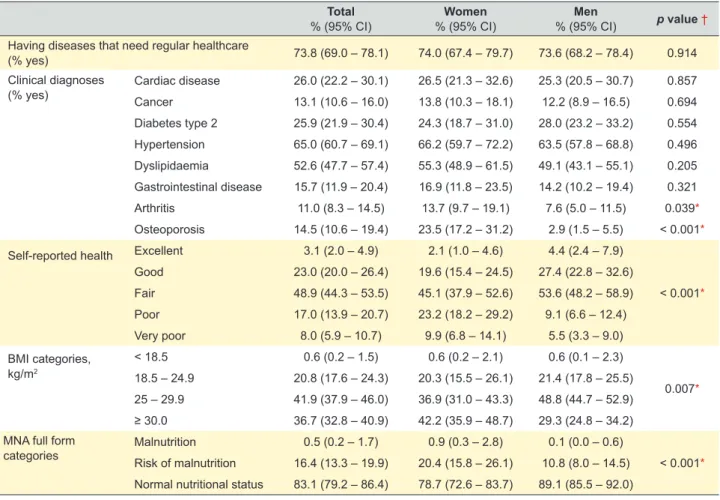
Among the Portuguese population of community-dwell-ers aged 65 and over, it was estimated that 73.8% (95% CI: 69.0 – 78.1) had at least one disease that required regular healthcare (e.g. medical appointments or periodic treat-ments, Table 2). Concerning the most frequently self-report-ed clinical diagnoses, hypertension was indicatself-report-ed by 65.0% (95% CI: 60.7 – 69.1), while dyslipidaemia was reported by 52.6% (95% CI: 47.7 – 57.4), 26.0% (95% CI: 22.2 – 30.1) presented a diagnosis of cardiac disease, and 25.9% (95% CI: 21.9 – 30.4) had diabetes type 2. These percentages were not significantly different between men and women. Moreover, it was estimated that about half [48.9% (95% CI: 44.3 – 53.5)] of the population rated their own general health status as ‘fair’, while 25.0% (95% CI: 21.5 – 28.8) categorised it as ‘poor’ or ‘very poor’ (Table 2). Also, more
ARTIGO ORIGINAL
women than men described their health as ‘poor’ (22.9% vs 9.8%, p < 0.001). The mean BMI was significantly higher for women (29.2 vs. 28.2 kg/m2, p = 0.017). Overall, in 41.9%
(95% CI: 37.9 – 46.0), BMI was between 25 – 29.9 kg/m2,
and 36.7% (95% CI: 32.8 – 40.9) presented a BMI above 30 kg/m2.
Table 1 – Demographic and socioeconomic characteristics of all participants Total n (%) Women n (%) n (%)Men Sex 1120 549 (49.0) 571 (51.0) Age (years) 65 – 74 561 (50.1) 280 (51.0) 281 (49.2) 75 – 84 320 (28.6) 145 (26.4) 175 (30.6) ≥ 85 239 (21.3) 124 (22.6) 115 (20.1)
Marital status Single 48 (4.3) 35 (6.4) 13 (2.3)
Divorced 62 (5.6) 26 (4.7) 36 (6.3)
Widowed 346 (31.0) 239 (43.6) 107 (18.8)
Married or living together 661 (59.2) 248 (45.3) 413 (72.6)
Educational level Illiteracy 260 (23.4) 178 (32.7) 82 (14.5)
Primary school (1st cycle) 566 (50.9) 241 (44.3) 325 (57.3)
2nd or 3rd cycle 194 (17.5) 85 (15.6) 109 (19.2)
High school or higher 91 (8.2) 40 (7.4) 51 (9.0)
Monthly income (€) < 485 200 (17.9) 123 (22.4) 77 (13.6)
485 – 970 382 (34.2) 169 (30.8) 213 (37.5)
> 970 374 (33.5) 158 (28.8) 216 (38.0)
Do not know / do not answer 160 (14.3) 98 (17.9) 62 (10.9)
Table 2 – Health-related characteristics of the Portuguese population aged 65 and over living in the community Total
% (95% CI) % (95% CI)Women % (95% CI)Men p value † Having diseases that need regular healthcare
(% yes) 73.8 (69.0 – 78.1) 74.0 (67.4 – 79.7) 73.6 (68.2 – 78.4) 0.914
Clinical diagnoses
(% yes) Cardiac diseaseCancer 26.0 (22.2 – 30.1)13.1 (10.6 – 16.0) 26.5 (21.3 – 32.6)13.8 (10.3 – 18.1) 25.3 (20.5 – 30.7)12.2 (8.9 – 16.5) 0.8570.694 Diabetes type 2 25.9 (21.9 – 30.4) 24.3 (18.7 – 31.0) 28.0 (23.2 – 33.2) 0.554 Hypertension 65.0 (60.7 – 69.1) 66.2 (59.7 – 72.2) 63.5 (57.8 – 68.8) 0.496 Dyslipidaemia 52.6 (47.7 – 57.4) 55.3 (48.9 – 61.5) 49.1 (43.1 – 55.1) 0.205 Gastrointestinal disease 15.7 (11.9 – 20.4) 16.9 (11.8 – 23.5) 14.2 (10.2 – 19.4) 0.321 Arthritis 11.0 (8.3 – 14.5) 13.7 (9.7 – 19.1) 7.6 (5.0 – 11.5) 0.039* Osteoporosis 14.5 (10.6 – 19.4) 23.5 (17.2 – 31.2) 2.9 (1.5 – 5.5) < 0.001*
Self-reported health Excellent 3.1 (2.0 – 4.9) 2.1 (1.0 – 4.6) 4.4 (2.4 – 7.9)
< 0.001* Good 23.0 (20.0 – 26.4) 19.6 (15.4 – 24.5) 27.4 (22.8 – 32.6) Fair 48.9 (44.3 – 53.5) 45.1 (37.9 – 52.6) 53.6 (48.2 – 58.9) Poor 17.0 (13.9 – 20.7) 23.2 (18.2 – 29.2) 9.1 (6.6 – 12.4) Very poor 8.0 (5.9 – 10.7) 9.9 (6.8 – 14.1) 5.5 (3.3 – 9.0) BMI categories, kg/m2 < 18.5 0.6 (0.2 – 1.5) 0.6 (0.2 – 2.1) 0.6 (0.1 – 2.3) 0.007* 18.5 – 24.9 20.8 (17.6 – 24.3) 20.3 (15.5 – 26.1) 21.4 (17.8 – 25.5) 25 – 29.9 41.9 (37.9 – 46.0) 36.9 (31.0 – 43.3) 48.8 (44.7 – 52.9) ≥ 30.0 36.7 (32.8 – 40.9) 42.2 (35.9 – 48.7) 29.3 (24.8 – 34.2) MNA full form
categories MalnutritionRisk of malnutrition 16.4 (13.3 – 19.9)0.5 (0.2 – 1.7) 20.4 (15.8 – 26.1)0.9 (0.3 – 2.8) 10.8 (8.0 – 14.5)0.1 (0.0 – 0.6) < 0.001* Normal nutritional status 83.1 (79.2 – 86.4) 78.7 (72.6 – 83.7) 89.1 (85.5 – 92.0)
CI: confidence interval; MNA: Mini Nutritional Assessment; BMI: body mass index
ARTIGO ORIGINAL
Geriatric assessment dimensions
Regarding nutritional status, the mean MNA score was 26.2 (95% CI: 26.0 – 26.5) points. Both ‘malnutrition’ and ‘risk of malnutrition’ were significantly more prevalent among women [0.9% (95% CI: 0.3 – 2.8), and 20.4% (95% CI: 15.8 – 26.1), respectively] than men [0.1% (95% CI: 0.0 – 0.6), 10.8% (95% CI: 8.0 – 14.5), respectively, p < 0.001, Table 2]. Moreover, the prevalence of ‘risk of malnutrition’ was 25.2% (95% CI: 15.4 – 38.3) in the upper age group (≥ 85 years), 21.8% (95% CI: 16.0 – 28.9) in those aged 75 – 84 years, and 10.5% (95% CI: 7.9 – 14.0) in the youngest group.
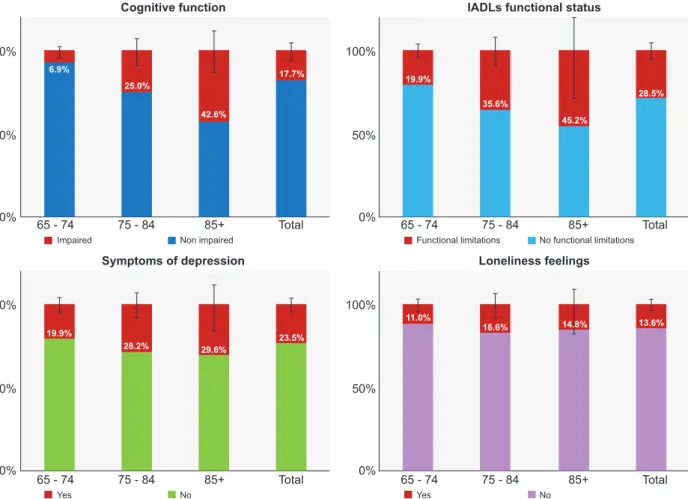
Concerning cognitive function, and following the MMSE cut-offs, the prevalence of cognitive impairment among the community-dwelling older adults was 17.7% (95% CI: 12.8 – 23.9, Fig. 1). It was significantly higher in the oldest age group (≥ 85 years old: 42.6% [95% CI: 30.6 – 55.5]) than in the youngest [65 – 74 years: 6.9% (95% CI: 4.2–11.0),
p < 0.001]. The prevalence of cognitive impairment was
also higher among women [20.2% (95% CI: 13.9 – 28.4)
vs 14.3% (95% CI: 9.5 – 20.9)], but the difference was not
statistically significant.
In total, it was estimated that 28.5% (95% CI: 23.7 – 33.8) of the population presented limitations to perform IADLs, and it reached 45.2% (95% CI: 19.1 – 74.1) in the oldest age group (Fig. 1). The frequency of this condition
was lower in women than men [26.1% (95% CI: 19.4 – 34.1)
vs 31.7% (95% CI: 26.5 – 37.3)], though not significantly.
The mean Lawton score was 7.4 (95% CI: 7.3 – 7.5), in a scale ranging from zero (severe limitations) to eight (ab-sence of limitations).
Furthermore, symptoms of depression were reported by 23.5% (95% CI: 19.7 – 27.7, Fig. 1). The prevalence was twice in women than men [30.1% (95% CI: 24.1 – 36.9) vs 15.0% (95% CI: 11.6 – 19.3), p < 0.001]. The mean UCLA Loneliness scale score was 22.7 (95% CI: 21.9 – 23.4) points, and 13.6% (95% CI: 10.6 – 17.1) were categorised as having subjective loneliness feelings (Fig. 1). Again, this prevalence was much higher among women than men [16.6% (95% CI: 12.4 – 21.8) vs 9.5% (95% CI: 6.3 – 14.0),
p = 0.018]. Additionally, there was a trend towards a higher
prevalence of symptoms of depression and loneliness feel-ings among the oldest old compared to younger age groups, but these differences were not statistically significant.
DISCUSSION
This study characterised the health status of the Portu-guese population aged 65 and over, using standard clinical instruments, with sound psychometric properties, which al-lows for both a national epidemiologic picture and a com-parison with other studies, as discussed next.
The more frequently reported chronic diseases among
Figure 1 – Characterisation of cognitive function, IADLs functional status, symptoms of depression and loneliness feelings of the Portu-guese population aged 65 and over living in the community
Cognitive function
Symptoms of depression
IADLs functional status
Loneliness feelings 6.9% 19.9% 19.9% 11.0% 25.0% 28.2% 35.6% 16.6% 42.6% 29.6% 45.2% 14.8% 17.7% 23.5% 28.5% 13.6% 0% 0% 0% 0% 65 - 74 65 - 74 65 - 74 65 - 74 75 - 84 75 - 84 75 - 84 75 - 84 85+ 85+ 85+ 85+ Total Total Total Total 50% 50% 50% 50% 100% 100% 100% 100% Impaired Yes Functional limitations Yes Non impaired No No functional limitations No
ARTIGO ORIGINAL community-dwelling older adults were hypertension and dyslipidaemia. Moreover, the prevalence of type 2
diabe-tes was 25.9% (95% CI: 21.9 – 30.4). These results are in line with those from the Portuguese cohort EpiDoC 2 (2013 – 15),31 although in the present study the prevalence of
hypertension is reasonably higher (65.0% vs 57.3%). More-over, one quarter of the population classified their general health as ‘poor’ or ‘very poor’. This finding is in line with a previous Portuguese study,32 and also with another study
in-cluding three southern European countries (Spain, Portugal and Italy).33 When compared to the EU-28 pooled data from
2017, the frequency of poorer health found in the present study is higher in the case of women (33.1% vs 20.0 %), but similar for men (14.6% vs 16.5%).34 In fact, apart from
gender, also cultural, social and economic aspects seem to impact on self-perceived health.32,33
The prevalence of BMI ≥ 30 kg/m2 (categorised as
‘obesity’ by WHO) in this study is slightly lower than the one reported by the Portuguese Health Examination Sur-vey, INSEF 2015 (women: 42.2% vs 47.5%, men: 29.3%
vs 35.1%, respectively).35 This difference may be related
to the fact that the latter included people up to 75 years, while the present study had no upper age limit, and that BMI tends to decrease with age, especially from the 80’s onwards36. Data from ten European countries (not
includ-ing Portugal) revealed an overall prevalence of obesity of 18.3% in men and 19.9% in women,36 and yet it ranged from
15.8% in Sweden to 23.1% in Spain.36 Even though a lower
prevalence was expected in the European study because it included a younger population (aged 50 and over), it seems that Portugal really has a higher percentage of older adults with a BMI greater than 30 kg/m2 when compared to other
countries. However, BMI alone may not be a good indica-tor concerning health outcomes among older adults.37
De-spite being simple to measure and widely used, BMI may be overestimated in older people, as height decreases with age, while the percentage of fat mass increases and that of muscle mass decreases.38 These modifications contribute
to the general observation that the BMI range associated with lowest mortality is higher for older adults (e.g. 27 - 30 kg/m2 for men, 30 - 35 kg/m2 for women).37 However,
specif-ic cut-offs for this age group are still not consensual. There-fore, in order to interpret BMI findings as the ones reported in the present study, the definition of excess weight and its health consequences in older ages requires further study. Additionally, a set of geriatric assessment dimensions (nutritional status, cognitive function, IADLs functional sta-tus, symptoms of depression, and loneliness feelings) was evaluated. In this study, the prevalence of risk of malnu-trition (16.4% vs 23.4%) and malnumalnu-trition (0.5% vs 2.1%) are lower compared to pooled data from studies conducted among community-dwelling older adults in Europe.39 These
dissimilarities may be related to participants’ characteristics. For example, those with dementia, bedridden or not able to answer a long questionnaire were not assessed here, and they would be expected to have a worse nutritional status. On the contrary, a consistent finding was also observed in
the present study, a higher prevalence of malnutrition in the oldest old and women. It is unclear if gender differences are related to the social and economic context, age, widow-hood, gender inequality and/or physiological differences.40
Overall, it was estimated that 17.7% (95% CI: 12.8 – 23.9) of the studied population presented an impaired cog-nitive function. A recent meta-analysis reported an adjusted prevalence of mild cognitive impairment of 14% (95% CI: 8% – 21%) in the community setting.41 Moreover, the
per-centage found in the present study was higher for women and much higher among those aged over 85, similarly to other studies.42 A study conducted in Northern Portugal
also found a higher prevalence of ‘cognitive impairment no dementia’ (CIND) in women.43 As observed in the present
study, illiteracy is much more frequent among older women, which may partly explain a worse cognitive status when compared to their male counterparts. Regarding functional status, it was estimated that 28.5% (95% CI: 23.7 – 33.8) of the studied population had limitations for performing their instrumental daily living activities, and this percentage dou-bled in the ≥ 85 years old group. Thus, generally, this may be considered a rather self-competent population for IADLs that becomes more functionally limited with age, as expect-ed.44 Comparable to what was found here, data from
Por-tuguese participants aged 50 and over included in the Sur-vey of Health, Ageing and Retirement in Europe (SHARE) wave 4 (2010 – 2011) revealed that 27.8% presented no limitations in seven IADLs activities. This percentage was the lowest among the 16 European countries that were as-sessed.45
The prevalence of symptoms of depression observed here [23.5% (95% CI: 19.7 – 27.7)] is much more similar to the ones found in ten European countries participating in SHARE46, than the rate (11.8%) reported in a Portuguese
cohort of older adults (EpiDoC 2).47 The prevalence in
SHARE ranged from 19.9% in Sweden to 33.1% in France, with higher rates in Latin ethno-lingual countries, probably due to higher psychosocial adversities (e.g. economic im-poverishment, disability, isolation, caregiving) that increase susceptibility to depression.48 It is noteworthy, though, that
both SHARE and EpiDoC 2 used different instruments, and the first included younger subjects (≥ 50 years old). Thus, comparisons should be made cautiously. The present study also assessed loneliness, which is generally understood as ‘the discrepancy between a person’s preferred and actual level of social contact’.8 Some authors argue that loneliness
and social isolation should be part of the CGA, as they have negative effects on older adults’ psychological and physical health.49 In total, it was estimated that 13.6% (95% CI: 10.6
– 17.1) of Portuguese older adults report loneliness feel-ings, similarly to other Portuguese and English studies.49,50
Others observed higher rates, around 20% in US, for exam-ple.8 The prevalence of loneliness feelings found in the
pre-sent study further supports the importance of screening for this condition and its inclusion in CGA. Once more, depres-sion and loneliness were more frequent among women, as consistently described by others.8,46
ARTIGO ORIGINAL Some points should be considered when interpreting
the results presented in this study. First, persons not capa-ble to understand and/or answer the questionnaires (e.g. due to dementia) or bedridden were excluded. Therefore, one may hypothesise that those in worse clinical condition were not evaluated. Second, data were self-reported, being subject to participants’ interpretation and subjective judge-ment. On the opposite, anthropometric measures were not self-reported, but sometimes it was not possible to meet ideal conditions for measurement (e.g. estimation of height using hand length). As a strength, this community-based study presents prevalence estimates on relevant geriatric assessment dimensions concerning the Portuguese older population, by sex and age group, and based on a national representative sample with no upper age limit. Also, stand-ard methodology of assessment was followed. The em-ployed instruments are widely used for screening, and the great majority are part of the Portuguese proposal for the geriatric assessment.
Comorbidities, cognitive impairment, disability, and malnutrition have been associated with poor survival, and moderate excess weight with better survival.51,52 As a
con-sequence, older adults’ health status should be evaluated to implement effective interventions. Also, gender and age group differences should be considered as the ‘≥ 65 years old’ is a heterogeneous population. In the future it is crucial to monitor the health of the older population and compare it with data and information presented here.
CONCLUSION
In the present study, it was observed that risk of malnutri-tion, cognitive impairment, functional limitations, symptoms of depression and loneliness feelings are moderately fre-quent among Portuguese adults aged 65 and over, and that the prevalence significantly increase with age. The growing number of older people is certainly changing society and provision of care as we knew them. Country-specific data is of utmost importance in order to develop national poli-cies and adjust models of care that promote healthy ageing, like those supporting ‘ageing in place’ through community-based care, for example.
ACKNOWLEDGEMENTS
The authors acknowledge the staff of Faculdade de Me-dicina, Universidade de Lisboa and Central Administration of the Health System (ACSS) for the institutional support. The authors acknowledge the IAN-AF team for their support with the development of data collection software and critical discussion of the study protocol.
The authors also acknowledge the interviewers who col-lected the data, staff from primary healthcare units, and all study participants.
PROTECTION OF HUMANS AND ANIMALS
This study was conducted according to the ethical stand-ards laid down in the Declaration of Helsinki. All procedures involving human subjects were approved by the National Data Protection Committee, Academic Medical Centre of Lisbon (CAML) Ethics committee, and all seven Regional Health Administrations Ethics committees.
DATA CONFIDENTIALITY
Data collection was also formally authorised by partici-pating primary healthcare units. All data was inserted into a database in which each participant was represented by a non-identifiable code (anonymisation). Databases are maintained in encrypted files only accessible by the re-search team.
PATIENT CONSENT
Written informed consent was obtained from all sub-jects. When risk of malnutrition or malnutrition were identi-fied, participants received an informative form about their status and were advised by interviewers (nutritionists) to contact their medical doctors.
COMPETING INTERESTS
The authors declared they have no competing interests.
FUNDING SOURCES
The project PEN-3S (136SI5) was granted by the Pub-lic Health Initiatives Programme (PT06), financed by EEA Grants Financial Mechanism 2009–2014.
TM is supported by a PhD Scholarship (SFRH/ BD/117884/2016) from Fundação para a Ciência e a Tecno-logia (FCT) through national funds (MCTES).
REFERENCES
1. PORDATA [Internet]. População residente: total e por grandes grupos etários (%). Portugal: Fundação Francisco Manuel dos Santos; 2019. [consulted 2019 Jun 25]. Available from: https://www.pordata.pt/Europa/ População+residente+total+e+por+grandes+grupos+etários+(percenta gem)-1865-202233.
2. INE [Internet]. População residente (N.o) por local de residência (NUTS
- 2013), sexo e grupo etário; Anual. Portugal: Instituto Nacional de Es-tatística (Statistics Portugal); 2019 [consulted 2019 Jun 4]. Available from: https://ine.pt/xportal/xmain?xpid=INE&xpgid=ine_indicadores&co ntecto=pi&indOcorrCod=0008273&selTab=tab0.
3. Christensen K, Doblhammer G, Rau R, Vaupel JW. Ageing populations: the challenges ahead. Lancet. 2009;374:1196–208.
4. World Health Organization. World report on ageing and health. Geneva: WHO; 2015.
5. den Ouden ME, Schuurmans MJ, Arts IE, van der Schouw YT. Physical
performance characteristics related to disability in older persons: a systematic review. Maturitas. 2011;69:208–19.
6. Ciorba A, Bianchini C, Pelucchi S, Pastore A. The impact of hearing loss on the quality of life of elderly adults. Clin Interv Aging. 2012;7:159–63. 7. Renaud J, Bédard E. Depression in the elderly with visual impairment
and its association with quality of life. Clin Interv Aging. 2013;8:931–43. 8. Ong AD, Uchino BN, Wethington E. Loneliness and health in older
adults: a mini-review and synthesis. Gerontology. 2016;62:443–9. 9. Seematter-Bagnoud L, Büla C. Brief assessments and screening for
geriatric conditions in older primary care patients: a pragmatic approach. Public Health Rev. 2018;39:8–21.
10. Rubenstein LZ, Siu AL, Wieland D. Comprehensive geriatric assessment: toward understanding its efficacy. Aging. 1989;1:87–98.
11. Stuck AE, Siu AL, Wieland GD, Adams J, Rubenstein LZ. Comprehensive geriatric assessment: a meta-analysis of controlled trials. Lancet.
ARTIGO ORIGINAL
1993;342:1032–6.
12. Núcleo de Estudos de Geriatria da Sociedade Portuguesa de Medicina Interna (GERMI). Avaliação geriátrica. Lisbon: Sociedade Portuguesa de Medicina Interna; 2015.
13. Madeira T, Peixoto-Plácido C, Goulão B, Mendonça N, Alarcão V, Santos N, et al. National survey of the Portuguese elderly nutritional status: study protocol. BMC Geriatr. 2016;16:139–48.
14. Lopes C, Torres D, Oliveira A, Severo M, Guiomar S, Alarcão V, et al. National Food, Nutrition, and Physical Activity Survey of the Portuguese General Population (2015-2016): Protocol for Design and Development. JMIR Res Protoc. 2018;7:e42.
15. DeSalvo KB, Fan VS, McDonell MB, Fihn SD. Predicting mortality and healthcare utilization with a single question. Health Serv Res. 2005;40:1234–46.
16. Stewart A, Marfell-Jones M, Olds T, Carter L. International standards for anthropometric assessment. Lower Hutt: The International Society for the Advancement of Kinanthropometry; 2011.
17. Guerra RS, Fonseca I, Pichel F, Restivo MT, Amaral TF. Hand length as an alternative measurement of height. Eur J Clin Nutr. 2014;68:229–33. 18. World Health Organization. Physical status: the use and interpretation of anthropometry. Report of a WHO Expert Committee. WHO Technical Report Series 854. Geneva: WHO; 1995.
19. Rubenstein LZ, Harker JO, Salvà A, Guigoz Y, Vellas B. Screening for undernutrition in geriatric practice: developing the short-form mini-nutritional assessment (MNA-SF). J Gerontol A Biol Sci Med Sci. 2001;56:M366–72.
20. Vellas B, Villars H, Abellan G, Soto ME, Rolland Y, Guigoz Y, et al. Overview of the MNA - its history and challenges. J Nutr Health Aging. 2006;10:456–63.
21. Guigoz Y. The Mini Nutritional Assessment (MNA) review of the literature - what does it tell us? J Nutr Health Aging. 2006;10:466–85.
22. Volkert D, Beck AM, Cederholm T, Cruz-Jentoft A, Goisser S, Hooper L, et al. ESPEN guideline on clinical nutrition and hydration in geriatrics. Clin Nutr. 2019;38:10–47.
23. Kaiser MJ, Bauer JM, Ramsch C, Uter W, Guigoz Y, Cederholm T, et al. Validation of the Mini Nutritional Assessment short-form (MNA-SF): a practical tool for identification of nutritional status. J Nutr Health Aging. 2009;13:782–8.
24. Folstein MF, Folstein SE, McHugh PR. “Mini-mental state”. A practical method for grading the cognitive state of patients for the clinician. J Psychiatr Res. 1975;12:189–98.
25. Guerreiro M, Silva AP, Botelho MA, Leitão O, Castro-Caldas A, Garcia C. Adaptação à população portuguesa da tradução do “Mini Mental State Examination” (MMSE). Rev Port Neurol. 1994;1:S9–10. 26. Sheikh JI, Yesavage JA. Geriatric Depression Scale: recent evidence
and development of a shorter version. Clin Gerontol. 1986;5:165–73. 27. Pocklington C, Gilbody S, Manea L, McMillan D. The diagnostic accuracy
of brief versions of the Geriatric Depression Scale: a systematic review and meta-analysis. Int J Geriatr Psychiatry. 2016;31:837–57. 28. Lawton MP, Brody EM. Assessment of older people: self-maintaining
and instrumental activities of daily living. Gerontologist. 1969;9:179–86. 29. Russell DW. UCLA Loneliness Scale (Version 3): reliability, validity, and
factor structure. J Pers Assess. 1996;66:20–40.
30. Pocinho M, Farate C, Amaral Dias C. Validação psicométrica da escala UCLA - loneliness para idosos Portugueses. Interações. 2000;18:65– 77.
31. Rodrigues AM, Gregório MJ, Sousa RD, Dias SS, Santos MJ, Mendes JM, et al. Challenges of ageing in Portugal: data from the EpiDoC Cohort. Acta Med Port. 2018;31:80.
32. Brandão MP, Martins L, Szewczyczak M, Talarska D, Philp I, Cardoso MF. Threats to health and well-being perceived by older people in Poland and Portugal. Acta Med Port. 2018;31:409–15.
33. Leão T, Perelman J. Depression symptoms as mediators of inequalities in self-reported health: the case of Southern European elderly. J Public Health. 2018;40:756–63.
34. Eurostat [Internet]. Self-perceived health by sex and age. Luxembourg: European Commission; 2017. [consulted 2019 Jun 26]. Available from: https://ec.europa.eu/eurostat/data/database.
35. Gaio V, Antunes L, Namorado S, Barreto M, Gil A, Kyslaya I, et al. Prevalence of overweight and obesity in Portugal: Results from the First Portuguese Health Examination Survey (INSEF 2015). Obes Res Clin Pract. 2018;12:40–50.
36. Peralta M, Ramos M, Lipert A, Martins J, Marques A. Prevalence and trends of overweight and obesity in older adults from 10 European countries from 2005 to 2013. Scand J Public Health. 2018;46:522–9. 37. Allison DB, Gallagher D, Heo M, Pi-Sunyer FX, Heymsfield SB. Body
mass index and all-cause mortality among people age 70 and over: the Longitudinal Study of Aging. Int J Obes Relat Metab Disord. 1997;21:424–31.
38. Vlassopoulos A, Combet E, Lean ME. Changing distributions of body size and adiposity with age. Int J Obes. 2014;38:857–64.
39. Cereda E, Pedrolli C, Klersy C, Bonardi C, Quarleri L, Cappello S, et al. Nutritional status in older persons according to healthcare setting: A systematic review and meta-analysis of prevalence data using MNA®. Clin Nutr. 2016;35:1282–90.
40. Crichton M, Craven D, Mackay H, Marx W, de van der Schueren M, Marshall S. A systematic review, meta-analysis and meta-regression of the prevalence of protein-energy malnutrition: associations with geographical region and sex. Age Ageing. 2018;48:38–48.
41. Hu C, Yu D, Sun X, Zhang M, Wang L, Qin H. The prevalence and progression of mild cognitive impairment among clinic and community populations: a systematic review and meta-analysis. Int Psychogeriatrics. 2017;29:1595–608.
42. Alexander M, Perera G, Ford L, Arrighi HM, Foskett N, Debove C, et al. Age-stratified prevalence of mild cognitive impairment and dementia in European populations: a systematic review. J Alzheimer’s Dis. 2015;48:355–9.
43. Nunes B, Silva RD, Cruz VT, Roriz JM, Pais J, Silva MC. Prevalence and pattern of cognitive impairment in rural and urban populations from Northern Portugal. BMC Neurol. 2010;10:42–54.
44. Araújo L, Ribeiro O. O paradoxo da incapacidade das pessoas muito idosas. Acta Med Port. 2011;24:S189–96.
45. Buz J, Cortés-Rodríguez M. Measurement of the severity of disability in community-dwelling adults and older adults: interval-level measures for accurate comparisons in large survey data sets. BMJ Open. 2016;6:e011842.
46. Castro-Costa E, Dewey M, Stewart R, Banerjee S, Huppert F, Mendonca-Lima C, et al. Prevalence of depressive symptoms and syndromes in later life in ten European countries. Br J Psychiatry. 2007;191:393–401. 47. Sousa RD de, Rodrigues AM, Gregório MJ, Branco JDC, Gouveia MJ, Canhão H, et al. Anxiety and depression in the Portuguese older adults: prevalence and associated factors. Front Med. 2017;4:196.
48. Alexopoulos GS. Depression in the elderly. Lancet. 2005;365:1961–70. 49. Patel RS, Wardle K, Parikh RJ. Loneliness: the present and the future.
Age Ageing. 2019;48:476–7.
50. Ferreira-Alves J, Magalhães P, Viola L, Simoes R. Loneliness in middle and old age: Demographics, perceived health, and social satisfaction as predictors. Arch Gerontol Geriatr. 2014;59:613–23.
51. Bień B, Bień-Barkowska K, Wojskowicz A, Kasiukiewicz A, Wojszel ZB. Prognostic factors of long-term survival in geriatric inpatients. Should we change the recommendations for the oldest people? J Nutr Health Aging. 2015;19:481–8.
52. Kane RL, Shamliyan T, Talley K, Pacala J. The association between geriatric syndromes and survival. J Am Geriatr Soc. 2012;60:896–904.