Outubro de 2012
Tese de Mestrado
Genética Molecular
Trabalho efectuado sob a orientação da
Professora Doutora Ana Arminda Lopes Preto de Almeida
Paula Alexandra Martins Cosme Vieira de Castro
The role of KRAS mutations signalling in
autophagy control in Colorectal Carcinomas
E co-orientação da
DECLARAÇÃO ESCRITA DO INTERESSADO, QUE A TAL SE
COMPROMETE.
___________________________________________
Paula Alexandra Martins Cosme Vieira de Castroiii
Começo por agradecer à Doutora Ana Preto. Agradeço à Professora, em primeiro lugar pela oportunidade de integrar no seu grupo de trabalho e claro, por todos os conhecimentos transmitidos, dedicação, empenho e ajuda. Agradeço também à Amiga, por toda a força, compreensão, carinho e palavras de apoio nos momentos mais difíceis. Muito obrigada por tudo! Agradeço também, à Doutora Maria Sofia Castro pelo interesse demonstrado e pela correção crítica da Tese.
Agradeço ainda, à Sara por toda a paciência e tempo dispensado. Pela ajuda preciosa durante todo este ano de trabalho, pelos ensinamentos, dedicação e disponibilidade incansáveis. Às minhas meninas do laboratório, Lis, Suellen e Stephanie um enorme obrigada pelo apoio incondicional, ajuda e pelos momentos de boa disposição proporcionados por todas.
Agradeço também, a todos os colegas do laboratório LCA com quem tive oportunidade de aprender e conviver.
Um enorme obrigada à minha Família! Aos meus pais por toda a paciência, carinho e total apoio sempre presentes, mas mais importantes do que nunca neste ano tão atribulado e difícil, que felizmente chegou ao fim com sucesso. À minha irmã Joana pela disponibilidade, carinho, preocupação e ajuda incondicionais. E claro ao meu pequenote, Joni, pelos miminhos e carinho. Uma ajuda fundamental!
Um obrigada muito especial à Becas. Por todo o carinho, amizade e apoio incondicionais. Pela enorme paciência e ajuda. Por estar sempre presente, nos momentos de maior aflição e nos momentos mais felizes: pelas lágrimas partilhadas, abraços tão apertados, sorrisos contagiantes, palavras de conforto, força e incentivo. Obrigada por TUDO! Sem ti teria sido impossível!
Agradeço ainda, a todos os meus amigos de Famalicão e Braga por todo o apoio e preocupação demonstrados, contribuindo para o meu bem-estar e força necessários para terminar esta etapa da minha vida. Um obrigada especial à Mi, Mariana e Ana Luísa, amigas sempre presentes e fundamentais nesta fase.
Por fim quero agradecer ao Rafa. Pelo apoio incansável, palavras de carinho e paciência constante. Por todos os momentos de descontração, fundamentais para mim durante todo este ano.
v
Colorectal carcinoma (CRC) is one of the most common types of cancer, leading to a high rate of mortality in Europe. Current therapies for CRC patients present poor outcomes, being mandatory new therapeutic approaches. Autophagy is an essential process for protein turn-over and cellular homeostasis being tightly implicated in cancer. This process has been described as fundamental in CRC cells chemoresistance emerging as a crucial target to anticancer therapy. One of the most frequent events found in CRC is the presence of activating mutations in KRAS (KRASG13D, KRASG12D and KRASG12V) which have a role in the genesis and progression of these tumours. Several studies have already demonstrated the importance of KRASG12V in autophagy induction either in fibroblasts and epithelial cells. However, little is known concerning the precise role of the different KRAS mutations in autophagy regulation in CRC cells.
This project aimed to determine the role of KRAS mutations signalling in cellular survival/proliferation and autophagy regulation in CRC. For such purpose, a CRC derived cell line harbouring KRASG12V mutation (SW480) and a kidney derived cell line (HEK 293) stably expressing Flag-KRASWT, Flag-KRASG13D, Flag-KRASG12D, and Flag-KRASG12V were used as in vitro models. Down-regulation of KRAS was performed by RNA interference (RNAi); the levels of autophagic markers were accessed by Western-blot analysis; cellular survival and proliferation were evaluated by cell cycle analysis and colony formation assay technique.
Our preliminary results showed that in SW480 cells, upon KRAS inhibition by RNAi, there was a decrease in autophagic markers levels namely LC3 II, Atg5 and p62 as well as a decrease in ERK phosphorylation. Down-regulation of KRAS led to a decrease in S-phase and an increase of sub-G1 phase of the cell cycle. Moreover, treatment with the autophagy inhibitor, Bafilomycin A1, also led to an increase in cell death. In contrast, the results observed in HEK 293 cells do not support the obtained in SW480 cells, which might indicate that HEK 293 cells are not a suitable model to study the role of typical CRC KRAS mutations in autophagy regulation.
Altogether the results indicate that KRASG12V protein may play a crucial role in autophagy regulation, survival and cell proliferation, possibly involving RAS–RAF–MEK–ERK signalling pathway, though further studies are required. The results also showed that CRC cells harbouring KRASG12V mutation seem to be dependent on autophagy for survival which can have important implications in CRC therapy.
vi
O carcinoma colo-rectal (CCR) é um dos tipos de cancro mais comuns, apresentando uma elevada taxa de mortalidade na Europa. Uma vez que as terapias para pacientes com CCR apresentam maus resultados, torna-se fundamental encontrar novas abordagens terapêuticas. A autofagia, um processo de renovação de proteínas e manutenção da homeostasia celular, tem sido descrita como fundamental na quimio-resistência das células do CCR, sendo um alvo importante para a terapia anti-cancro. A presença de mutações ativantes do KRAS (KRASG13D, KRASG12D e KRASG12V) é um dos eventos mais frequentes no CCR, estando implicada na sua formação e progressão. Inúmeros estudos demonstraram a importância do KRASG12V na indução da autofagia em fibroblastos bem como em células epiteliais. No entanto, o papel específico das diferentes mutações do KRAS na regulação da autofagia no CCR é ainda pouco claro.
Este projeto teve como objetivo a determinação da função das mutações do KRAS na sobrevivência/proliferação celular bem como na regulação da autofagia no CCR. Para isso, uma linha celular derivada de CCR com a mutação KRASG12V (SW480) e uma linha celular derivada de rim (HEK 293) que expressa Flag-KRASWT, Flag-KRASG13D, Flag-KRASG12D e Flag-KRASG12V foram usadas como modelos in vitro. O silenciamento do KRAS foi conseguido através da técnica de RNA de interferência (RNAi); os níveis de expressão dos marcadores autofágicos foram analisados por “Western-blot”; a sobrevivência e proliferação celulares foram avaliadas por análise do ciclo celular e pela técnica de “colony formation assay”.
Os nossos resultados preliminares mostraram que, nas células SW480, após inibição do KRAS, a expressão de LC3 II, Atg5 e p62 diminuiu, assim como a fosforilação das ERK. O silenciamento do KRAS levou a uma diminuição de células em fase S e um aumento em fase sub-G1 do ciclo celular. Além disso, o tratamento com um inibidor da autofagia, Bafilomicina A1, promoveu o aumento da morte celular. Os resultados observados nas células HEK 293 não estão de acordo com os obtidos nas células SW480, sugerindo que as células HEK 293 não são um bom modelo no estudo da regulação da autofagia pelas mutações do KRAS típicas do CCR.
Os resultados indicam que o KRASG12V desempenha um papel fundamental na regulação da autofagia, sobrevivência e proliferação celulares, envolvendo possivelmente a via RAS–RAF– MEK–ERK, porém mais estudos são necessários. Os resultados demonstraram também que as células de CCR com a mutação KRASG12V parecem estar dependentes da autofagia para a sua sobrevivência, o que pode ter importantes implicações no tratamento dos CCR.
vii
ABBREVIATIONS ix - xii
1.INTRODUCTION 1
1.1 Cancer Epidemiology 3
1.2 Colorectal Carcinoma 6
1.2.1 Hereditary or Familial Colorectal Carcinoma 7 1.2.2 Sporadic Colorectal Carcinoma: CIN and MIS 8
1.3 MAPK pathway and RAS proteins 9
1.3.1 Oncogenic activation in Colorectal Carcinoma: KRAS Mutations 12
1.4 Autophagy 13
1.4.1 Autophagy Process 14
1.4.2 Autophagy Regulation 17
1.5 RAS and Autophagy 19
1.6 Rationale and aim 21
2. MATERIAL AND METHODS 23
2.1 Cell lines and culture conditions 25
2.2 Optimization of sIRNA transfection in SW480 cell line 25
2.2.1 Forward Transfection 26
2.2.2 Reverse Transfection 27
2.2.3 Assessment of siRNA-AF internalization using Fluorescence Microscopy and Flow Cytometer
27
2.3 Western-blot analysis 28
2.3.1 Total protein extraction 28
2.3.2 Western blotting 28
2.4 Trypan Blue exclusion Assay 30
B A
viii
2.6 Colony Formation Assay 31
2.7 Statistical analysis 31
3.RESULTS 33
3.1 Optimization of RNA interference conditions 35
3.1.1 LipoGen Transfection Reagent 35
3.1.2 RNAi-MAX Transfection Reagent 38
3.1.3 Lipofectamine 2000 Transfection Reagent 40 3.2 Inhibition of KRAS expression in SW480 cells using RNA interference 45 3.2.1 Effect of KRAS inhibition in autophagy of SW480 cells 45 3.2.2 Effect of KRAS inhibition in ERK signalling of SW480 cells 49 3.2.3 Effect of KRAS inhibition in the cell cycle and cell death of SW480 cells 50 3.2.4 Effect of autophagy inhibition in cell survival of SW480 cells 52 3.3 The cellular effect of KRAS mutations in HEK 293 cell line 54 3.3.1 Effect of KRAS mutations in autophagy induction in HEK 293 cells 54 3.3.2 Effect of expression of KRAS mutations on Colony Formation Ability of
HEK 293 cells
57
4.DISCUSSION 61
5. CONCLUSIONS AND FUTURE PERSPECTIVES 67
5.1 Conclusions 69
5.2 Future Perspectives 70
ix
3-MA 3-METHYLADENINE
AIF2 APOPTOSIS INDUCING FACTOR
AMP ADENOSINE MONOPHOSPHATE
AMPK AMP-ACTIVATED PROTEIN KINASE
APC ADENOMATOUS POLYPOSIS COLI
APS AMMONIUM PERSULFATE
ASK APOPTOSIS SIGNAL REGULATION KINASE
ATG AUTOPHAGY-RELATED GENES
ATP ADENOSINE TRIPHOSPHATE
BAFA1 BAFILOMYCIN A1
BCL-2 B-CELL CLL/LYMPHOMA 2
BNIP3 BCL-2/ADENOVIRUS E1B19 KDA PROTEIN –INTERACTING PROTEIN 3
BSA BOVINE SERUM ALBUMIN
CDK4 CYCLIN-DEPENDENT KINASE 4
CIN CHROMOSOMAL INSTABILITY
CMA CHAPERONE-MEDIATED AUTOPHAGY
CRC COLORECTAL CARCINOMA
CRE CYCLIC AMP/CALCIUM RESPONSE ELEMENT
DAPK DEATH-ASSOCIATED PROTEIN KINASE
DNA DEOXYRIBONUCLEIC ACID
DMEM DULBECCO´S MODIFIED EAGLE MEDIUM
DRP1 DYNAMIN-RELATED PROTEIN 1
EGFR EPIDERMAL GROWTH FACTOR RECEPTOR
ELK MIXED LINEAGE KINASE
ERKP ERK PHOSPHORYLATED
ERKT ERK TOTAL
FAP FAMILIAL ADENOMATOUS POLYPOSIS
FBS FETAL BOVINE SERUM
GDP GUANOSINE DIPHOSPHATE
GTP GUANOSINE TRIPHOSPHATE
x
HCL HIDROCHLORIC ACID
HEK HUMAN EMBRYONIC KIDNEY
HHLM HUMAN MUTLHOMOLOG
HNPCC HEREDITARY NONPOLYPOSIS COLORECTAL CARCINOMA
HPP HYPERPLASTIC POLYOSIS
HRAS HARVEY RAT SARCOMA VIRAL ONCOGENE HOMOLOG
HSPIN1 HUMAN HOMOLOGUE OF THE DROSOPHILA SPIN GENE PRODUCT
HVPS34 VACUOLAR PROTEIN SORTING 34 HOMOLOGUE
IARC INTERNATIONAL AGENCY FOR RESEARCH ON CANCER
IBMK IMMORTALIZED BABY MOUSE KIDNEY
JNK C-JUNK N-TERMINAL KINASE
JPS JUVENILE POLYPOSIS SYNDROME
KRAS KIRSTEN RAT SARCOMA 2 VIRAL ONCOGENE HOMOLOG
LC3 MICROTUBULE-ASSOCIATED PROTEIN 1LIGHT CHAIN 3(MAP1LC3)
MAP MUTYH-ASSOCIATED POLYPOSIS
MAPK MITOGEN-ACTIVATED PROTEIN KINASE
MEF2 MYOCYTE ENHANCER FACTOR 2
MIRNA MICRO RNA
MSI MICROSATELLITE INSTABILITY
MTOR MAMMALIAN TARGET OF RAPAMYCIN
NAF SODIUM FLUORIDE
NA3VO4 SODIUM ORTHOVANADATE
NF1 NEUROFIBROMIN 1
NRAS NEUROBLASTOMA RAT SARCOMA VIRAL ONCOGENE HOMOLOG
OPTI-MEM REDUCED SERUM MEDIUM
PBS PHOSPHATE BUFFERED SALINE
PBS-T PHOSPHATE BUFFER SALINE –TWEEN
PE PHOSPHATIDYLETHANOLAMINE
PENSTREP PENICILLIN-STREPTOMYCIN
PERK PHOSPHORILATED ERK PROTEIN
xi
PH PLECKSTRIN HOMOLOGY
PI PROPIDIUM IODIDE
PIP3 PHOSPHATIDYLINOSITOL (3,4,5)-TRISPHOSPHATE
PI3K PHOSPHATIDYLINOSITOL-3KINASE
PIK3CA PHOSPHATIDYLINOSITOL-4,5-BISPHOSPHATE 3-KINASE, CATALYTIC SUBUNIT ALPHA
PJS PEUTZ-JEGHERS SYNDROME
PKB PROTEIN KINASE B
PKC PROTEIN KINASE C
PLCε PHOSPHOLIPASE CΕ
PLD PHOSPHOLIPASE D
PTEN PHOSPHATASE AND TENSIN HOMOLOGUE
PVDF POLYVINYLIDENE FLUORIDE
RALGDS RAL GUANINE NUCLEOTIDE-DISSOCIATION STIMULATOR
RAS RAT SARCOMA
RB RETINOBLASTOMA TUMOUR SUPPRESSOR PROTEIN
RGL RALGDS- LIKE GENE
RNAI RNA INTERFERENCE
ROS REACTIVE OXYGEN SPECIES
RPMI ROSWELL PARK MEMORIAL INSTITUTE
RPM ROTATIONS PER MINUTE
RT ROOM TEMPERATURE
SAPK STRESS-ACTIVATED PROTEIN KINASE
SDS SODIUM DODECYL SULFATE
SDS-PAGE SODIUM DODECYL SULFATE - POLYACRYLAMIDE GEL ELECTROPHORESIS
SIRNA SMALL INTERFERING RNA
SIRNA-AF SMALL INTERFING RNA–ALEXA FLUOR
SOS SON OF SEVENLESS
SQSTM1 SEQUESTROME 1
STAT 1 SIGNAL TRANSDUCER AND ACTIVATOR OF TRASCRIPTION FACTOR 1
TBS-T TRIS BUFFERED SALINE –TWEEN
xii
TIAM1 T-CELL LYMPHOMA INVASION AND METASTASIS-INDUCING PROTEIN 1
TGN TRANS-GOLGI-NETWORK
TSC TUBEROUS SCLEROSIS COMPLEX
1
3
1.1 Cancer Epidemiology
Cancer remains a worldwide major public health problem. Despite consistent development medical research, the global burden of cancer has more than doubled during the last 30 years, being nowadays a major cause of death. In the past years, cancer was generally considered to be a disease of high-resource and industrialised western countries manly because of lifespan increased and population lifestyle. However, nowadays, the situation has dramatically changed, and many cancer cases appeared in low- and medium-resource countries. In the year of 2008, the International Agency for Research on Cancer (IARC) estimated that cancer affected 28 million persons (within 5 years from initial diagnosis) and over than 12 million new cases were diagnosed. In this same year, cancer was responsible for 7.6 million deaths (about 13% of all deaths worldwide) [1].
The most commonly diagnosed cancers worldwide are lung (1.61 million cases, corresponding to 12.7% of the total), breast (1.38 million, 10.9% of the total) and colorectal carcinomas (CRC) (1.23 million, 9.7% of the total). The most abundant causes of cancer related deaths are lung cancer (1.38 million, 18.2% of the total), stomach cancer (738 000 deaths, 9.7% of the total) and liver cancer (696 000 deaths, 9.2% of the total) [2].
In Europe, the most common cancers were colorectal (13.6% of the total), followed by breast (13.1%), lung (12.2%) and prostate cancer (11.9%). The major cause of cancer related deaths in Europe during 2008 was lung cancer (20%) followed by colorectal carcinoma (12.3%), breast cancer (7.5%) and stomach cancer (6.8%) [3] (Figure 1).
The continued growth and ageing of the world’s population will significantly affect the cancer burden so it could be expected that, by the year of 2030, 27 million new cases of cancer and 17 million cancer related deaths would occur [1].
Due to the high levels of incidence and worldwide mortality, enormous efforts are being developed in cancer areas of research to better understand this disease and to discover more efficient treatments and/or diagnostic tests.
Much of the research on the cancer area demonstrated that transformation of a normal cell into a cancer cell requires very few molecular, biochemical and cellular changes, despite all potential causes of cancer and carcinogenic pathways [4]. Overall, these changes occur due to accumulation of genetic mutations in normal cells affecting their proliferation, differentiation and development [5].
4
Figure 1: Estimated numbers (in thousands) of cancer cases and cancer deaths in Europe, during the year of 2008 (Adapted from [3])
Carcinogenesis is the process where cells develop general alterations responsible for its malignant transformation, and it comprise limitless replicative potential, self-sufficiency in growth signals, insensitivity to growth inhibitors, sustained angiogenesis and evasion of apoptosis. Moreover, cancer cells can invade other tissues by activation of invasion and metastasis [6]. Recently, other characteristics were added to these 6 classical hallmarks, such as the instability of genome, leading to an increase of mutations in cancer cells, inflammatory microenvironment around these cells, reprogramming of cellular energy metabolism and finally, the ability of escape to immune destruction. The last two characteristics mentioned, the emerging hallmarks, are very important to the metabolic program, allowing a continuous sustention of cell growth and
5
proliferation. On the other hand, the others are considered facilitating characteristics that can orchestrate all of hallmark capabilities (Figure 2) [7, 8].
Figure 2: The ten hallmarks of cancer: acquired capabilities of cancer cells during carcinogenesis. Despite being considered a complex disease, cancer can be defined by these alterations (Adapted from [7]).
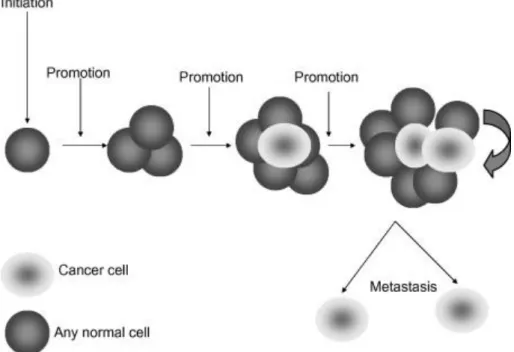
Cancer cells and therefore cancer itself, result from a set of favourable conditions, that result in a breakdown of cellular homeostasis, which can lead to a deregulation of cell division, proliferation and apoptosis mechanisms, causing, ultimately, the disease state. The development of a tumour or the carcinogenic process requires several steps during a long period of time, and can be divided into three distinct phases: initiation, promotion and progression [9]. The initial phase is a rapid event that affects the genome of the cells, giving them the ability to grow faster and to avoid normal cellular growth control mechanisms. If the damage is not repaired by the cell, a mass of abnormal cells is formed, and a progression to a malignant phenotype occurs. Fortunately, this promotion step is much longer and sometimes the disease may not even
6
manifest during lifetime of the individual. The progression step is associated to the ability of cancer cells to invade surrounding tissues and to metastasize [4](Figure 3).
Figure 3:The carcinogenic process. Cancer formation is the result of several changes in any cell type of the body that occurs in a long period of time. After the initiation step, a period of tumour promotion occurs. Each stage of multi-step carcinogenesis reflects genetic changes in the cell with a selection advantage that drives the progression towards a highly malignant cell [4].
1.2 Colorectal Carcinoma
According to the most recent data (2008), colorectal carcinoma is the third most commonly diagnosed cancer worldwide reaching 1 233 711 CRC cases accounting for 9.7% of total cancer cases and one of the most abundant causes of cancer related deaths with approximately 608 000 deaths (8% of total cancer deaths). Incidence and mortality rates of CRC are very similar in both sexes, being the incidence in men 10% and 9.4% in women, while mortality is 7.6% in men and 8.6% in women [3]. In Portugal, CRC is the third most common form of cancer, with 695 200 cancer diagnoses, about 16.1% of all diagnoses and 369 100 deaths (Globocan project, 2008, http://www-dep.iarc.fr/).
CRC is originated as a result of pathologic transformations of apparently normal mucosa (epithelium) into a benign adenomatous polyp that can, ultimately, progress to an invasive
7
tumour. This progression requires mutations in many genes, activation of proto-oncogenes and/or inactivation of tumour-suppressor genes, that confer a proliferative advantaged to cells and contribute for a malignant phenotype, which takes years or even decades to cause the carcinoma. In Figure 4 is represented the multistep progression of the CRC. Although these genetic alterations often occur in a favourite order, the total accumulation of changes appears to be a critical factor of the biological properties of the carcinoma [10].
Figure 4: A multistep genetic model for colorectal carcinogenesis. The arrows represent possible mutations. Among others, mutations in APC (Adenomatous polyposis coli), activation of KRAS (Kirsten rat sarcoma viral oncogene homolog) and inactivation of p53 are the most frequent events in this carcinogenic process (Adapted from [11]).
Colorectal carcinomas can have two different origins, so it can be divided into two distinct groups: the hereditary CRC group that represent about 20% of total CRC cases, and the sporadic CRC group that have a bigger impact with an incidence of 80% [11].
1.2.1 Hereditary or familial Colorectal Carcinoma
In hereditary or familial CRC, a little part of the total percentage is very well known and defined, being associated with well-characterized syndromes, such as hereditary nonpolyposis colorectal carcinoma (HNPCC), familial adenomatous polyposis (FAP), attenuated FAP, and MUTYH-associated polyposis (MAP), that correspond to conditions expressing adenomatous polyps. Other examples are the conditions with hamartomatous polyps like Peutz-Jeghers syndrome (PJS) and juvenile polyposis syndrome (JPS). The last condition is the hyperplastic polyposis (HPP), which is rare but has a substantial cancer risk. All of these conditions are inherited, autosomal dominant disorders, except MAP, which is autosomal recessive, and HPP, which is rarely inherited [12]. The remainder percentage of this class of CRC is still not
8
completely understood. However, it is though that they could correspond to alterations in single genes that are less penetrant but more common, leading to the high-risk familial, non-syndromic colon cancers and common familial-risk colon cancers [12]. A better understanding of the genetics of this group is very important to improve preventions strategies, as well as the efficiency of diagnosis and treatments.
1.2.2 Sporadic Colorectal Carcinoma: CIN and MSI
The sporadic group of CRC can be subdivided in two types of colorectal tumours that can be distinguished by their carcinogenesis process. One of them is the traditional pathway, also called the “suppressor” or chromosomal instability pathway (CIN) and the second colorectal carcinogenesis pathway is the “mutator” pathway or the microsatellite instability (MSI) [11, 13].
The CIN group, which represents more than 2/3 of CRCs, is characterized by the accumulation of structural or numerical abnormalities, preferentially in chromosome 5q, 17p and 18q [14-16]. This carcinogenesis pathway shows mutations in classical proto-oncogenes like KRAS (Kirsten rat sarcoma viral oncogene homolog) and tumour-suppressor genes such asp53, APC (adenomatous polyposis coli) and SMAD4, besides having alterations in the Wnt pathway [17]. However, just a small group of CIN has the complete set of these molecular abnormalities [18].
The MSI pathway represents about 15 - 20% of all cases of sporadic colorectal carcinoma [19] and it is characterized by the existence of alterations/mutations in the microsatellite sequences [17]. Microsatellites are nucleotide repeat sequences that exist naturally throughout the genome with two to nine nucleotides. In a situation of MSI the number of nucleotide repeats, in these microsatellite regions, is different when compared with germline DNA. The alterations in the microsatellites sequences in MSI are caused by dysfunctions of DNA mismatch repair genes, during DNA replication, typically in hMLH1 (MutS Homolog 1) or hMSH2 (MutS Homolog 2) [11].
The two different pathways previously referred (CIN and MSI) are mutually exclusive, so it is reasonable to think that the presence of genomic instability is essential and that either pathway is sufficient to drive colorectal carcinogenesis. More recently, epigenetic factors have been considered as important factors in the development of some subsets of cancers and polyps [20].
9
1.3 MAPK pathway and RAS proteins
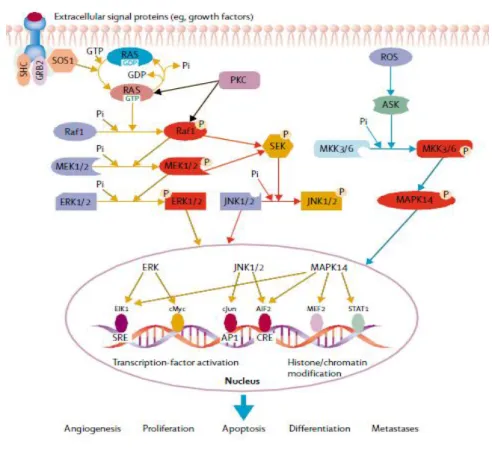
The MAPK (mitogen-activated protein kinase) pathway is involved in very important cellular processes, such as proliferation, differentiation, cell survival, senescence and apoptosis [21] being the key signalling pathways for cell proliferation from the cell surface to the nucleus [22] (Figure 5). There are three major subfamilies of mitogen-activated protein kinases: the c-junk N-terminal or stress-activated protein kinases (JNK or SAPK); the MAPK14 and finally the extracellular-signal-regulated kinases (ERK MAPK, RAS – RAF – MEK – ERK) having the last one a large involvement in the pathogenesis, progression and oncogenic behaviour of CRC [23]. It is thought that at least 50% of colorectal carcinomas have a deregulation of the MAPK pathway [24].
Figure 5: The MAPK signalling in pathogenesis. Three related signal transduction cascades activated through growth factors, stress or inflammation. (AIF2=apoptosis inducing factor. ASK= apoptosis signal regulating kinase. CRE=cyclic AMP/calcium response element. ELK=mixed lineage kinase. MKK=MAPK kinase. MEF2=myocyte enhancer factor 2. PKC=protein kinase C.
10
ROS=reactive oxygen species. SOS=son of sevenless. STAT1=signal transducer and activator of transcription factor 1) (Adapted from [24]).
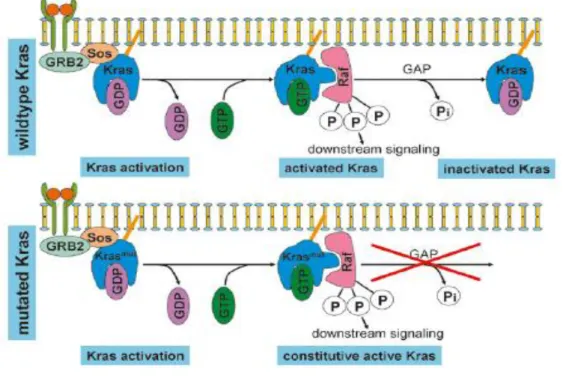
RAS (rat sarcoma) proteins, encoded by three different RAS genes, are small GTPases (guanosine triphosphatases) consisting of 188 or 189 amino acids, involved in intracellular signalling [25]. These proteins change between an active state, linked to a guanosine triphosphate (RAS-GTP), and an inactive guanosine diphosphate (GDP) – bound state (RAS-GDP) [26] (Figure 6).
Figure 6: The mechanism of KRAS activation. This activation occurs as a result of the formation of a complex, GRB2 (Growth factor receptor-bound protein 2) and SOS, that leads to a conformational change mediating the exchange of GDP (inactive state) for GTP (active state). In wild type KRAS, this activation can be reversed by hydrolyses of GTP however, mutated KRAS remains constitutive active (Adapted from [27]).
There are four highly homologous RAS proteins, the HRAS (Harvey rat sarcoma viral oncogene homolog), NRAS (neuroblastoma rat sarcoma viral oncogene homolog) and KRAS (4A and 4B). KRAS is activated in response to receptors activation, and this response is usually transient as result to its intrinsic GTPase activity. However, when KRAS is mutated, it is constitutively active which results in an activation of downstream signalling pathways and
11
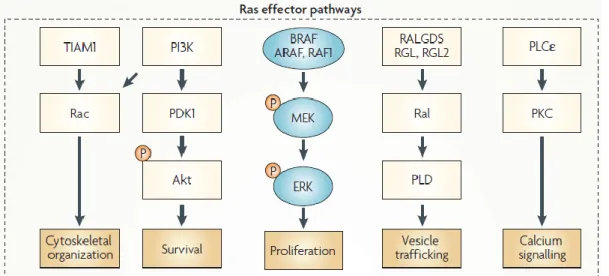
probably oncogenesis [28]. The activation of RAS regulates a complex signalling network that modulates the cellular behaviour, such as cytoskeletal organization, cell survival and proliferation, vesicle trafficking and calcium signalling, through the interaction with several effectors such as TIAM1 (T-cell lymphoma invasion and metastasis-inducing protein 1), PI3K (PhosphatidylInositol-3 Kinase), RAF, RalGDS (Ral guanine nucleotide-dissociation stimulator) and PLCε (Phospholipase Cε) (reviewed by [28]). The signalling pathways regulated by RAS protein are schematized in Figure 7.
Figure 7: The RAS signalling pathway. RAS protein activates the BRAF–mitogen-activated and extracellular-signal regulated kinase kinase (MEK) – extracellular signal-regulated kinase (ERK) cascade which often determines proliferation and becomes deregulated in certain cancers and in developmental disorders. RAS also activates the phosphatidylinositol kinase (PI3K) – 3-phosphoinositide-dependent protein kinase 1 (PDK1)–Akt pathway that frequently determines cellular survival. RalGDS (Ral guanine nucleotide-dissociation stimulator), RALGDS-like gene (RGL), RGL2 and TIAM1 (T-cell lymphoma invasion and metastasis-inducing protein 1) are exchange factors of Ral and Rac, respectively. Phospholipase D (PLD), an effector of Ral, is an enzyme that regulates vesicle trafficking. Rac regulates actin dynamics and, therefore, the cytoskeleton. RAS also binds and activates the enzyme phospholipase Cε (PLCε), the hydrolytic products of which regulate calcium signalling and the protein kinase C (PKC) family. P, phosphate. (Adapted from [28]).
12
1.3.1 Oncogenic activation in Colorectal Carcinoma: KRAS Mutations
KRAS is one of the initial members of the MAPK signalling pathway and it is mutated in 21% of all human sporadic cancers and in about 30 - 60% of CRCs cases [24, 29, 30].
In human tumours, the KRAS mutations can be somatic mutations of the KRAS gene (KRASG12D, KRASG12V and KRASG13D), upstream activation of receptor tyrosine kinases [31]. In CRC this mutations result in amino-acid substitutions, usually in exon 2, at codons 12 or 13 (about 85% of all KRAS mutations) and in exons 3 and 4 (about 15%) at codons 61, 117 and 146 [32, 33]. Activating KRAS mutations are very common in CRC and correspond to an early event in this type of cancer, noting it greater occurrence in adenomas larger than one centimetre [34].
Whereas the relevance of KRAS mutations in the pathogenesis of colorectal carcinoma is undisputed, the data regarding the role of this protein in tumour progression are conflicting, however the incidence of KRAS mutations have been reported to be identical throughout all the tumour stages [34]. Mutant RAS is capable of stimulating tumour cells proliferation through ERK MAPK signalling pathway [35] and can also stimulate angiogenesis by the activation of interleukin-8 synthesis [36]. Moreover, RAS activation can inhibit DNA repair genes [37]. Thus, the combination of these characteristics: tumour cell proliferation, induction of angiogenesis and DNA repair inhibition, seems to be a potential mechanism for enhancement of tumour progression and metastasis namely in CRC, although further clinical studies are needed in order to confirm it.
KRAS mutations have been implicated in the response to anti-cancer drugs in CRC, being established predictors of absence of response to epidermal growth factor receptor (EGFR) – targeted agents [38]. However, the utility of KRAS mutation as a prognostic marker in CRCs is unclear and more studies are still needed. In fact, recent studies demonstrated contradictory results of the importance of KRAS mutation as prognostic marker, being considered a negative prognostic indicator [39], and reported without a prognostic value in other studies, such as the large PETACC-3 (Pan European Trial Adjuvant Colon Cancer 3) translational trial [40].
In the current year, Valentino and co-workers showed that either KRAS small interfering RNA (siRNA) alone or combined PIK3CA (phosphatidylinositol-4,5-bisphosphate 3-kinase, catalytic subunit alpha) and KRAS siRNA treatments increased apoptosis in HCT116 cells. They also showed that siRNA treatment combined with 5-fluorouracil further inhibited CRC cells proliferation. As main conclusions, the authors claimed that the combination of PIK3CA and
13
KRAS siRNA treatments offer an effective therapy against colorectal carcinoma cells with coexisting mutations in PI3K/AKT/mTOR and RAS pathways, and that siRNA directed to PIK3CA and KRAS can be used to enhance the effects of current chemotherapy [41].
1.4 Autophagy
Autophagy or type II programmed cell death is a catabolic process of self-degradation of intercellular compounds, such as organelles or proteins, at lysosomal compartments [42, 43]. This is a genetically controlled and evolutionarily conserved process present in all eukaryotic cells [44]. This process occurs in tumour cells as well as in normal cells, particularly when the first ones have apoptotic defects, allowing autophagy to sustained cell survival for a long period in conditions of nutrients deprivation [45-48]. Autophagy is important to regulate normal turnover of organelles and to remove those with compromised function. This process can be activated during various types of stress, resulting in protection of cells. Thus, this cellular response can be activated by nutrient limitation, oxidative stress, hypoxia and heat in order to maintain homeostasis [49]. Autophagy is also important in cellular development and differentiation [50], as well as in innate and adaptive immunity [51]. In addition, it is known that this process is implicated in a large number of diseases like cancers, mainly localized in the centre of the tumour mass where the hypoxic stress is bigger due the lack of blood vessels [52], and neurodegenerative disorders, including Huntington’, Alzheimer’ and Parkinson’s diseases [43, 53-55].
There are three major types of autophagy in eukaryotic cells that can be differentiated by their different machineries and physiological functions: the macroautophagy, microautophagy and chaperone-mediated autophagy (CMA) [56, 57] (Figure 8), being the first one the most extensively studied.
Both macroautophagy and microautophagy involve dynamic membrane rearrangement that allows the engulfment of portions of cytoplasm containing large structures, like organelles. Microautophagy process involves the direct engulfment of small volumes of cytosol at the lysosome surface by invagination, protrusion and septation of the lysosome membrane [58]. While, macroautophagy is a more complex process that needs a special and double-membrane organelle, the autophagosome, which is formed by the elongation of phagophore and
14
subsequently annexation of a portion of cytoplasm. In the next step, the autophagosome fuses with the lysosome (forming the autolysosome) and there is the release, into the lumen, of the inner-single-membrane vesicle [59, 60]. In both cases, after formation of autophagic bodies they are lysed and their contents (the macromolecules) are transported back into the cytosol through membrane permeases for reuse [61]. Finally, the CMA method does not involve a membrane rearrangement; it involves a direct translocation of selective and soluble proteins across the membrane of the lysosome, instead. This translocation requires protein unfolding by chaperone proteins [62].
Figure 8: Schematic representation of the three main types of autophagy: Macroautophagy (engulfment of biggest cytosolic components and long-lived active proteins through the formation of autophagosome); Microautophagy (engulfment of small volumes of cytosolic components through the action of lysosome) and chaperone-mediated autophagy - CMA (translocation of soluble substrates into the lysosome with help of lysosomal chaperone proteins). Adapted from [43]).
1.4.1 Autophagy Process
Macroautophagy, hereafter termed autophagy, is a process by which cellular components are sequestered within vesicular structures (autophagosomes) and delivered to lysosomes for degradation. This process can be divided into distinct mechanistic steps: the initial induction
15
step, followed by nucleation, vesicle elongation, completion of autophagosome, fusion between autophagosome and lysosome and finally, degradation inside the acidic autolysosome with consequent release of the degraded products for its recycling (Figure 9).
The execution of autophagy involves a group of evolutionary conserved genes. Until now, 31 autophagy-related genes (ATG) are known in yeast and the majority of them have mammalian homologues [53, 63]. According to respective ATG proteins functions, in the autophagic process, they are separated in several different groups.
The induction phase of autophagy is regulated by two main complexes: the (mTOR)/Atg1/Atg13/Atg17 complex and the Beclin1/hVps34/p150/Atg14 complex also known as type III PI3K complex [64-66]. Thus, the autophagic process can be initiated by the inhibition of mTOR (mammalian Target Of Rapamycin) and consequent activation of mammalian homologues of Atg1 and Atg13 responsible for conformational alterations essential for this initial step [64, 67]. The induction of autophagy could also be promoted by the type III PI3K complex which comprises Beclin1. Beclin 1 was the first tumour suppressor gene related with autophagy. This protein is a very important autophagic regulator that participates either in induction phase of autophagy, through interactions with vacuolar protein sorting 34 (hVps34) and mAtg14 [66, 68-70], and in autophagosomal maturation into autolysosome through the complex with hVps34 and UVRAG (UV radiation resistance-associated gene) [66, 68, 71]. Beclin 1 function in autophagy is mostly regulated by an anti-apoptotic Bcl-2 (B-Cell CLL/Lymphoma 2) protein [72, 73], that could inhibit the autophagic process by binding and sequestering Beclin 1 [64]. Dissociation of Beclin 1 from Bcl-2 is necessary to occur induction of autophagy and, consequently, there is a relationship between the induction of autophagy and increased expression of Beclin 1 [74, 75].
Phagophore nucleation and elongation, that leads to autophagosome formation, is possible thanks to the coordinated action of type III PI3K complex and several proteins such as Atg5-Atg12-Atg16 and pro-LC3 and Atg9 [76-78]. Microtubule-associated protein light chain 3 (LC3) is a major constituent of the autophagosomes [79]. This protein is synthesized as a pro-LC3 that is cleaved at the glycine residue by mAtg4, forming the cytosolic pro-LC3 I [80]. The C-terminal glycine of LC3 I is then conjugated with phosphatidylethanolamine (PE) through an ubiquitin-like conjugation reaction, becoming LC3 II [81, 82]. This LC3 II is associated with both the surfaces of the double autophagosomal membrane in contrast with Atg5-Atg12-Atg16 complex, which is found only on the cytosolic surface [76, 83]. Despite all this knowledge, the origin of autophagosome membrane is not clearly understood. Several studies suggest that a
16
range of organelles such as endoplasmic reticulum, mitochondria and Golgi complex can provide the required membrane components for autophagosome formation [84]. The final autophagosome could be detected by the presence of LC3 II on the internal surface of autophagosome.
Autophagosome-lysosome fusion is the following step of the autophagic process. The hydrolytic enzymes of the lysosome are essential for the acidification of the autophagosome environment allowing the complete digestion and destruction of nonfunctional proteins and organelles. After this fusion, the LC3 II is degraded in LC3 I leading to the decrease of LC3 II content in autolysosome [60, 85]. Thus, LC3 II is considered a good autophagic flux marker [86]. Another important marker for the autophagic process is the p62 protein. This protein coupled with sequestrome 1 (SQSTM1) binds directly to LC3 II being transported into the autophagosome and degraded in autolysosome [81]. Both LC3 II and p62 proteins allow the autophagic flow study once there is degradation or an accumulation of these proteins in response to an autophagy induction or inhibition, respectively. The inhibition of this fusion between autophagosome and lysosome through Bafilomycin A1 (Baf A1) leads to accumulation of the LC3 II and p62 proteins [87].
Figure 9: Schematic representation of the autophagic process: autophagy begins with the induction step, followed by nucleation, vesicle elongation, completion of autophagosome, fusion between autophagosome and lysosome and finally, degradation inside the acidic autolysosome with consequent release of the degraded products (adapted from [65]).
17
1.4.2 Autophagy Regulation
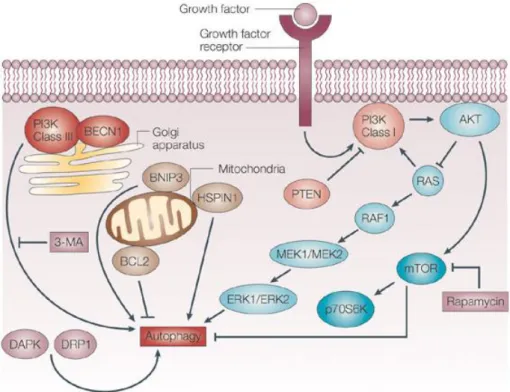
Autophagy is an important process for the maintenance of cellular homeostasis. This process occurs at basal levels in non-stress situations, allowing the recycling of nutrients and removal of unnecessary proteins and organelles to the cell [61]. In stress conditions such as nutrient and energy deprivation and hypoxia, the autophagy levels increase as a pro-survival action [42, 54, 88]. The regulation of autophagy process and the associated molecular machinery is very complex and involves several well characterized signalling pathways that are responsible for its induction or inhibition (Figure 10). mTOR have a crucial position in autophagy regulation under stress condition, as a major negative regulator, since the majority of signaling pathways converge in this kinase [89].
Several studies indicates that class I PI3K – AKT – mTOR pathway is very important in autophagy regulation process under starvation conditions [54, 90, 91]. The classes I PI3K is often activated in response to growth factors (insulin) and once activated, the generated PIP3 (phosphatidylinositol (3,4,5)-trisphosphate) binds to the pleckstrin homology (PH) domains of PDK 1 (phosphoinositide-dependent protein kinase 1) and AKT leading to the translocation of both proteins to the cell membrane and their consequent activation [92, 93]. The activation of the serine/threonine kinase AKT, also named protein kinase B (PKB) occurs in two different steps: an initial phosphorylation at threonine 308 in the catalytic domain by PDK 1 and a
subsequent phosphorylation at serine 473 mediated by AKT itself, PDK 1 or mTORC2 complex [94-97]. AKT activation leads to the activation of the subsequent kinase of PI3K – AKT – mTOR pathway, the mTOR, and to the inhibition of the RAS protein. While mTOR activation leads to the inhibition of autophagy, the RAS activation has a dual effect in this process. When RAS activates class I PI3K there is an autophagy inhibition, but on the other hand when this protein selectively activates the kinase cascade RAF1 – MEK1/MEK2 – ERK1/ERK2, autophagy is stimulated [98]. The phosphatase and tensin homologue (PTEN) is also able to regulate autophagy. PTEN reverses PIP3 production by class I PI3K dephosphorylation and inhibition, which suppresses the downstream AKT signaling and thus positively regulates autophagy [99].
Although mTOR is considered central key in autophagy regulation, mTOR independent pathways have also been reported to regulate autophagy. These pathways converge on Beclin1/hVps34/p150/Atg14 complex also known as type III PI3K complex (Figure 10). This complex promotes the sequestration of cytoplasmic material and consequently the autophagic
18
process [100]. Beclin 1 can be activated by the stress-responsive c-Jun amino-terminal kinase 1 and by the death-associated protein kinase (DAPK) and the dynamin-related protein 1 (DRP 1) [101, 102]. JNK1 and DAPK proteins phosphorylate and disrupt the association of anti-apoptotic proteins, Bcl-2 and Bcl- XL, with Beclin 1, leading to the activation of the Beclin 1-associated to class III PI3K complex, which localizes in the Trans-Golgi-Network (TGN), and stimulation of autophagy. The upregulation of the BCL- 2/adenovirus E1B 19 kDa protein – interacting protein 3 (BNIP3) or HSPIN1 (human homologue of the Drosophila spin gene product) at the mitochondria also induces the autophagic process [103].
Figure 10: Schematic representation of autophagy regulation. In nutrients limiting conditions, mTOR is inhibited, de-repressing autophagy. Activation of growth factor receptor (insulin receptors) stimulates the class I PI3K. This stimulation generates PIP3 (phosphatidylinositol (3,4,5)-trisphosphate) leading to the phosphorylation and activation of AKT. AKT activation leads to the activation of the mammalian target of rapamycin (mTOR) and to the inhibition of the RAS protein. mTOR activation leads to the inhibition of autophagy but the RAS activation has a dual effect in this process. When RAS activates class I PI3K there is an autophagy inhibition, but on the other hand when this protein selectively activates the kinase cascade RAF1 – MEK1/MEK2 – ERK1/ERK2, autophagy is stimulated. The phosphatase and tensin homologue (PTEN) is also able to positively regulate autophagy once PTEN reverses PIP3 production by class I PI3K
19
dephosphorylation and inhibition, which suppresses the downstream AKT signalling. Another important regulator of autophagy is the type III PI3K – Beclin 1 (BECN1) complex. This complex which is inhibited by 3-methyladenine (3-MA) promotes the sequestration of cytoplasmic material and activates the autophagic process. Beclin 1 can be activated by the death-associated protein kinase (DAPK) and the death-associated related protein kinase 1 (DRP 1). Downregulation of BCL2, or upregulation of the BCL- 2/adenovirus E1B 19 kDa protein – interacting protein 3 (BNIP3) or HSPIN1 (human homologue of the Drosophila spin gene product) at the mitochondria also induces the autophagic process. (adapted from [104])
Another important regulator of the autophagy is the level of ATP (Adenosine Trisphosphate) in cells. The detection of lower ATP levels (due to glucose starvation for example) leads to the phosphorylation and activation of AMP-activated protein Kinase (AMPK) [105]. AMPK, which senses changes in the intracellular ATP/AMP ratio phosphorylates and activates tuberous sclerosis complex 1/2 (TSC1–TSC2), leading to inactivation of mTOR and autophagy induction [106, 107].
1.5 RAS and Autophagy
In about 30% of human cancers, mutations in RAS proto oncogene occurs, leading to the formation of an oncogenic form of RAS. This data suggests that RAS plays important roles in tumour development. In colorectal carcinoma mutated KRAS has been frequently reported [108-110].
As previously mentioned, autophagy has important functions for the survival of cells in unfavourable conditions and, in other hand allows the repair or, in more severe cases, the destruction of damage cells. Recently, the autophagic process has been implicated in cancer prevention, suppressing cancer initiation; and cancer progression, enabling growth of aggressive cancers [42, 45, 111].
Very recent publications suggest that cell lines harbouring oncogenes such as HRASV12 or KRASV12 (RAS) strongly increase basal autophagy, being dependent on this process to survive to starvation. Guo and colleagues suggest that, in iBMK (immortalized baby mouse kidney) cells,
20
RAS-induced high basal autophagy must result from an mTOR-independent mechanism [112]. Their study demonstrated that in activated-RAS expressing cells autophagy facilitates tumourigenesis and cancer cell survival through the maintenance of mitochondrial metabolic function, essential for the cell viability [112]. Another study demonstrates, for the first time, that autophagy is essential to KRASV12 - induced malignant transformation in human breast cells (MCF10A). In KRASV12 - overexpressed cells was observed an increase of ATG proteins (Atg5 and Atg7) and an activation of MAPK pathway. The JNK was also involved in the induction of malignant transformation, in an indirect-way. Thus, the activation of JNK by ROS (Reactive Oxygen Species) was able to induce autophagy through upregulation of Atg5 and Atg7, leading to the malignant transformation of cells [113]. In both studies, the implication of autophagy in initiation and progression of cancers was demonstrated. The relation between RAS and autophagic process was also shown in ovarian HOSE epithelial cells by Elgendy and co-workers. They demonstrated that depending on the intensity of oncogene expression of HRASV12, in the absence of other co-transforming genes, caspase-independent cell death, autophagy, could occur [114]. This study reveals that RAS-induced autophagy is Noxa- and Beclin 1 –dependent, observing an increase of their expression. Noxa (BH3-only protein), which has a great affinity to Mcl-1 (Bcl-2 family member) [115], promotes autophagy through the displacement of Mcl-1 from Beclin 1.
As conclusion, depending on the degree of oncogenic RAS activation, the consequences in cell are different. This mutation can be crucial for the survival of tumour cells in aggressive cancers, or contrarily, to the destruction or repair of damage cell, preventing tumour development, both through autophagy.
In colorectal carcinoma harbouring KRAS mutations, there are indirect evidences that KRAS might regulate autophagy. In HCT116 cell line, a human CRC cell line with KRASG13D activation, the basal levels of autophagy increased compared with a cell line without KRAS mutations, which has important consequences for cell survival and proliferation [112]. Another recent study showed that activated KRAS also increase the autophagic response after an extracelular matrix detachment stimulus, protecting cells from detachment-induced cell death (anoikis) [116].
21
1.6 Rationale and aim
According to the most recent data, colorectal carcinoma is the third most commonly diagnosed cancer worldwide and one of the most abundant causes of cancer related deaths (Globocan project, 2008, http://www-dep.iarc.fr/). KRAS, one of the four highly homologous RAS proteins, is one of the initial members of the MAPK signalling pathway and is mutated in about 30% of human cancers [24, 29, 30].
Autophagy is an important process for the maintenance of cellular homeostasis. This process occurs at basal levels in non-stress situations, allowing the recycling of nutrients and removal of unnecessary proteins and organelles to the cell [61]. In stress conditions such as nutrient and energy deprivation and hypoxia, the autophagy levels increase as a pro-survival action [42, 54, 88]. The regulation of autophagy process and the associated molecular machinery is very complex and involves several well characterized signalling pathways.
When KRAS is mutated, it is constitutively active which results in an activation of downstream signalling pathways and probably oncogenesis. KRAS protein can modulate cell survival through interaction with class I PI3K, inhibiting autophagy, or through RAS – RAF – MEK - ERK pathway that stimulate autophagy [98]. Despite the association between RAS proteins and autophagic process, the precise role of KRAS mutations in the regulation of cellular survival through autophagy process in CRC, is not well understood.
The major aim of this work was to understand the precise contribution of KRAS in autophagy regulation in CRC. We also aimed to study the role of KRAS in cell proliferation and to understand the role of autophagy in the survival of CRC cells harbouring KRASG12V mutations. This study might have important consequences in the identification of new therapeutic approaches for CRC.
For that purpose, a CRC cell line was used. The SW480 cell line, with a KRASG12V mutation, was transfected with specific siRNA for KRAS protein in order to inhibit KRAS and the autophagic phenotype was studied. Thus the initial task of this work was to optimize the transfection conditions for the SW480 cell line. Moreover HEK 293 (Human Embryonic Kidney 293) cells stably expressing Flag-KRASWT, Flag-KRASG13D, Flag-KRASG12D and Flag-KRASG12V were used in order to study the influence of the different genetic mutations of KRAS in autophagy. All cell lines were subjected to HBSS (Hank´s Balanced Salt Solution) treatment, a starvation- autophagic inducer and to Bafilomycin A1 treatment, an autophagy inhibitor, and the autophagy
22
related proteins were monitored (Beclin 1, Atg5, p62, LC3 (I/II)) by Western-blot analysis. Moreover, we also analyzed cell survival and proliferation by cell cycle analysis and colony formation assay.
23
25
2.1 Cell lines and culture conditions
SW480 cell line and stable cell lines derived from HEK 293 cells were used as study models. SW480, a human CRC-derived cell line (CCL-228, ATCC), harbouring a KRASG12V mutation was kindly provided by Professor Raquel Seruca from IPATIMUP. Stable cell lines derived from HEK 293 cells (CRL-15t3, ATCC), infected with Flag-KRASWT and Flag-KRASG13D, Flag-KRASG12D, and Flag-KRASG12V mutations were produced by PhD student Sara Alves from CBMA/ Department of Biology.
SW480 cells, used between 5 and 25 passages, were grown in RPMI (Roswell Park Memorial Institute) 1640 medium with Stable Glutamine (PAA, Austria) supplemented with 10% (v/v) inactivated fetal bovine serum (FBS) (SIGMA, USA) and 1% (v/v) Penicillin-Streptomycin (PenStrep) (GIBCO, USA). HEK 293 derived cell lines, used between 13 and 20 passages, were grown in DMEM (Dulbecco's Modified Eagle Medium) with L-Glutamine (PAA, Austria) supplemented with 2% (v/v) Sodium Bicarbonate (GIBCO, USA), 1% (v/v) Sodium Pyruvate (GIBCO, USA) and also 10% (v/v) of inactive FBS (SIGMA, USA) and 1% (v/v) of PenStrep (GIBCO, USA). All cell lines were maintained in 25 cm2 polystyrene flasks (TPP, USA), under a humidified, 5% CO2, 37ºC atmosphere and sub-cultured whenever the cultures became confluent (approximately 80% of confluence) using 0.05% Trypsin/ 0.02% EDTA solution (GIBCO,, USA).
All cell lines were subjected to an autophagy induction by nutrient deprivation with HBSS (Hank´s Balanced Salt Solution) (GIBCO) for 6 hours, and to an autophagy inhibition by Bafilomycin A1 (Baf A1). Bafilomycin A1 is an inhibitor of the vacuolar ATPase, which blocks the fusion of autophagosomes with lysosomes, leading to an accumulation of autophagosomal structures [117]. Bafilomycin A1 was mixed with HBSS or complete RPMI or DMEM medium at a final concentration of 20nM.
2.2 Optimization of sIRNA transfection in SW480 cell line
In order to optimize small interfering RNA (siRNA) transfection conditions in the SW480 cell line, we used two different approaches, the forward and the reverse transfection. The first one is the most common technique for delivering siRNA into cells for gene silencing and involves preplating cells one day before siRNA and transfection reagent treatment. In the other hand, in
26
reverse transfection, siRNAs are plated at the same time as the cell suspension followed by addition of the transfection reagent, being a less-time consumer technique.
Furthermore, we also used a fluorescent control siRNA linked to Alexa Fluor 488 (all stars negative siRNA – AF 488, from Qiagen), which allowed a faster and easier result achievement since the analysis is very direct and simple and does not need Western-blot analysis.The efficacy of siRNA - AF uptake was evaluated by two different methods: Fluorescence microscopy (Leica - DM5000B + CTR5000 + ebq100) and Cytometer analysis (Beckman Coulter – Epics XL).
The specific siRNAs target sequences used in this study, were the siRNA KRAS, specifically Hs_KRAS2_8, with the following target sequence: 5`AAGGAGAATTTAATAAAGATA -3`, and a negative control siRNA with the following target sequence: 5`-AATTCTCCGAACGTGTCACGT-3´that were purchased from Qiagen. The transfection reagents tested were Lipofectamine 2000 (Invitrogen), Lipofectamine RNAiMAX (Invitrogen) and LipoGen (Invivogen).
2.2.1 Forward Transfection
In the forward transfection, SW480 cells were plated in 6-well plates at 2x10⁵cells/well (20% of confluence) in RPMI complete medium and were incubated at 37ºC for 24 hours allowing a correct attachment. The cells were then washed twice with phosphate buffer saline 1x (PBS) for FBS removal and incubated with 750μl of Opti-MEM (Reduced serum medium) at 37ºC, while the transfection mix was prepared. For the transfection mix, the desired volume of transfection reagent was diluted in Opti-MEM at a final volume of 125μl (Mix 1) and incubated 5 minutes at room temperature (RT). Then, the desired volume of siRNA was also diluted in Opti-MEM at a final volume of 125μl (Mix 2) and Mix 1 was gently added to Mix 2. After 20 minutes at RT, the transfection mix was added to each well. In the control condition, without transfection reagent or siRNA, it was added 250μl of Opti-MEM. Cells were incubated at 37ºC and 14 hours later, the medium was replaced for RPMI complete medium and the cells were allowed to grow for another 48 hours. All procedures were performed under RNAse free conditions.
27
2.2.2 Reverse Transfection
In the reverse transfection method, the desired volume of siRNA was diluted in Opti-MEM and the transfection reagent was gently added to the mixture for a total volume of 250μl. After 20 minutes at RT, the transfection mix and 750μl of cell suspension (2x10⁵cells/well) were added into the respective well. Cell suspension was composed by RPMI medium without antibiotics and supplemented with 10% of inactive FBS. In order to mix the cells and the transfection mix, we gently shake the plate back and forth. After approximately 24 hours at 37ºC, the medium was replaced by RPMI complete medium and cells were allowed to grow for 48 hours, at 37ºC. All procedures were performed under RNAse free conditions.
2.2.3 Assessment of siRNA-AF internalization using Fluorescence Microscopy and Flow Cytometer
After transfection, 2x10⁵ SW480 cells were plated in 6-multiwell culture plates for fluorescent microscopy internalization analysis (Leica - DM5000B+CTR5000+ebq100) and 2x10⁵ SW480 cells were seeded in fisherbrand cover slips (12mm) for cytometer analysis (Beckman Coulter – Epics XL). For fluorescent microscopy analysis siRNA- transfected SW480 cells were washed three times with PBS 1x and fixed with 4% paraformaldehyde (PFA) for 30 minutes. Moreover, these cells were incubated with a fluorescent DNA - binding dye, using 3μl of Vectashield Mounting Medium with DAPI. Images were analyzed with an appropriated protocol in LAS AF software. siRNA - AF transfected - SW480 cells were represented as FITC - labelled cells and thus the percentage of uptake efficiency was determined by [FITC - labelled cells/total of cells * 100]. The uptake efficiency by SW480 cells were determined through manual counting of at least 500 cells for each condition.
For the assessment of siRNA-AF internalization using cytometer, siRNA-AF transfected - SW480 cells were trypsinized (500μl) and collected by centrifugation (1000 rpm for 5 minutes). The cells were then washed by centrifugation (14000 rpm, 5 minutes) three times and ressuspended in 500μl of PBS 1x. The RNAi-Alexa Fluor fluorescence was detected in a Beckman Coulter – Epics XL flow cytometer using Fl-1 (488/525 nm).
28
2.3 Western-blot analysis
Western-blot technique was performed to assess the expression of several proteins involved in autophagy pathway, namely KRAS, Beclin 1, LC3 I and LC3 II, Atg5, p62 and ERK: pERK (phosphorylated ERK) and tERK (total ERK). β -Actin, a constitutively expressed protein in human cells encoded by a housekeeping gene, was used as a loading control.
2.3.1 Total protein extraction
SW480 cells were plated in 6-multiwell culture plates (TPP, USA) at 4x10⁵ cells/well and 48 hours after treatment the total proteins were extracted. Cells were washed with PBS 1x, trypsinized and twice washed (5084R - EPPENDORF) at 2000 rpm for 10 minutes at 4ºC. Then the pellet was vigorously resuspended in ice-cold RIPA buffer containing 1mM PMSF, phosphatase inhibitors (20mM NaF, 20mM Na3VO4) and 40mM of protease inhibitor cocktail, and the cell suspension was kept on ice for 20 minutes to promote cell lysis. Finally, a last centrifugation (Sigma - 2K15) was performed (14000 rpm, for 15 minutes at 4ºC) allowing the recovery of total proteins in the supernatant fraction.
The protein concentration was quantified using the Bio-Rad DC protein assay (Bio-Rad Laboratories, USA) and BSA (Bovine Serum Albumin) was used as protein standard.
2.3.2 Western blotting
25μg of proteins were separated by SDS - Polyacrylamide gel electrophoresis (12.5% bis-acrylamide, 375mM Tris-HCl, 0.4% SDS, 15% Glycerol, 0.1% TEMED and 10% APS) in running buffer during approximately 1h30 at 20mA. The samples were mixed with laemmli buffer 4x (Tris – HCl1M, 40% glycerol, 10% SDS, β-Mercaptoethanol and Bromophenol Blue) and 15μl was loaded into each well. Besides, 2μl of protein molecular weight ladder (PAGE Ruller Unstained Protein Ladder – Thermo Scientific), was loaded in other well.
Proteins were transferred to a Polyvinylidene Fluoride (PVDF) membrane (ThermoScientific, USA) that was previously hydrated with methanol. Transference occurred in a mini transfer system at 54mA during 1 hour using transfer buffer (0,25M Tris - Base, 1,92M
29
Glycine and Methanol). Membranes were blocked for 1 hour at RT in PBS-T (PBS with 0.5% Tween-20 (Bio-Rad laboratories)) containing 5% skim milk (Molico) or in PBS-T containing 3% of BSA for phosphorylated proteins.
After blocking, the membranes were incubated with the primary antibodies overnight at 4ºC, washed with PBS-T or TBS-T and incubated with the secondary antibodies for 1 hour at RT. The primary antibodies used for immunoblotting were: anti-KRAS (Santa-Cruz), anti-Beclin 1 (Cell Signalling), LC3 I/II (Sigma-Aldrich), Atg5 (Sigma-Aldrich), p62 (Santa-Cruz), anti-pERK, anti-tERK and anti-β-Actin (all from Cell Signalling). Secondary antibodies used were goat anti-mouse or goat anti-rabbit from Jackson Laboratories. All dilutions are represented in table 1.
For ERK proteins immunodetection, an additional step was done in order to reprobe the membranes. Thus after pERK immunodetection, the membranes were striped with stripping solution (Tris-HCl1M, β-Mercaptoethanol and 10% SDS) for 30 minutes at 50ºC and washed with PBS-T and TBS -T (three times, 10 minutes each solution). Membranes were then blocked again and incubated with the desired primary and secondary antibodies as previously described.
Finally, the substrate - antibodies reaction was detected with ECL reagents (Thermo Scientific) under a chemiluminescence system, the ChemiDoc XRS (Bio-Rad). Band intensity was quantified using the Quantity One software from Bio-Rad.
Primary Antibody Dilution Secondary Antibody Dilution
Anti – KRAS 1:100 Goat anti-mouse 1:3000
Anti – Beclin1 1:750 Goat anti-rabbit 1:3000
Anti – LC3 (I/II) 1:3000 Goat anti-rabbit 1:2000
Anti – Atg5 1:1000 Goat anti-rabbit 1:5000
Anti – p62 1:1000 Goat anti-mouse 1:2000
Anti – pERK 1:1000 Goat anti-rabbit 1:2000
Anti – tERK 1:1000 Goat anti-rabbit 1:2000
Anti – β-Actin 1:5000 Goat anti-mouse 1:5000
30
2.4 Trypan Blue exclusion Assay
Trypan blue exclusion assay is a simple and quick method to study cell viability. This dye exclusion stain allows distinguishing viable cells, with an intact membrane, from death cells since living cells are able to exclude the dye while cells without an intact membrane take up the colouring agent, presenting a blue coloration.
For cellular viability study, a cell suspension of SW480 cell line after treatment was prepared and mixed with trypan blue solution in a 1:1 dilution. After 5 minutes at 37ºC, 10μl of the mixture were loaded in counting chambers of a haemocytometer, and the number of stained and total cells was counted. The percentage of cell death is the result of the formula: [(blue cells/total of cells)*100].
2.5 Cell Cycle analysis
The cell cycle is the ordered series of events required for cell division which allow the continuity of life. The stages of the cell cycle include interphase (which is made up of three stages: G1, S and G2), mitosis and cytokinesis. The interphase is composed for two “gap” phases (G1 and G2) responsible for cell preparation and growth and for the S phase, where DNA duplication occurs. After interphase, the duplicated chromosomes are separated through a set of well characterized steps (prophase, anaphase, metaphase and telophase) culminating in cytoplasm division, the cytokinesis [118].
Cell cycle analysis of SW480 cell line was performed by flow cytometry that allows the study of the amount of cells in interphase cell cycle phases. The cytometer is able to distinguish the different phases according to DNA content present in each cell. In this work G1, S and G2 phases were analyzed as well as a sub-G1 peak, correspondent to apoptotic cells. Apoptotic cells present reduced DNA content due the DNA fragmentation. Therefore this group is represented by a sub-G1 population seen to the left of the G1 peak.
For cell cycle analysis, cells were collected by centrifugation (500g for 3 minutes) and ressuspended in 500μl. After 15 minutes on ice, the cell suspension was rapidly pipeted into 1.5ml of ice-ethanol (stored at -20ºC) and incubated on ice for more 15 minutes for cells fixation. After ethanol fixation cells were centrifuged at 3000rpm during 3 minutes at 4ºC (EPPENDORF –
31
5804R) and the resulting pellet was washed in 2ml of PBS 1x. Two more washes were done and after the last wash, cells were ressuspended in 500μl of PBS 1x. 50μl of RNAse A solution (200µg/ml in sodium citrate (1% w/v)) was added into cells and after vortex, cells were incubated at 37ºC in a water bath for 15 minutes. In the end, PI (Propidium Iodide) stain solution (0.5mg/ml in sodium citrate (1% w/v)), which is light sensitive, was added to cells and after vortex were incubated in darkness at RT for at least 30 minutes.
The cells were analysed in Beckman Coulter- Epics XL flow cytometer and the data obtained was treated using FlowJo 7.6 software.
2.6 Colony Formation Assay
Colony formation assay is a method where the ability of one single cell to form a colony is tested. For that purpose, 400 and 800 HEK 293 cells were plated (per well) using DMEM complete medium. Cells were maintained at 37ºC in a humidified atmosphere with 5% of CO2 during three weeks, allowing their growth. The DMEM medium was replaced once a week in order to restore all the nutrients needed. At the end of three weeks, cells were fixed and stained using a 6% glutaraldehyde/0.5% crystal violet solution. Firstly DMEM medium was carefully removed and cells were washed twice with PBS 1x. Then, 2-3ml of fixing and staining solution were added to cells, for at least 30 minutes at RT. Finally, after careful removal of glutaraldehyde/crystal violet solution and thorough rinsing with water, cells were allowed to dry at RT. Colonies of HEK 293 derived cell lines were then photographed and counted.
2.7 Statistical analysis
Data is reported as the mean ± standard error of the mean (SEM). Statistical analysis was performed by the one-way ANOVA test, following by the Tukey post test, using the GraphPad Prism 5.0 software (San Diego, CA, USA).
33
![Figure 1: Estimated numbers (in thousands) of cancer cases and cancer deaths in Europe, during the year of 2008 (Adapted from [3])](https://thumb-eu.123doks.com/thumbv2/123dok_br/17910612.849565/18.892.230.585.108.699/figure-estimated-numbers-thousands-cancer-cancer-europe-adapted.webp)