Márcia Andreia Oliveira Cruz
Outubro de 2011Universidade do Minho
Escola de Ciências
U M in ho |2 01 1 M ár ci a An dr ei a O liv ei ra C ru zEvaluation and characterization of
antioxidant and antigenotoxic properties
of Portuguese propolis
E va lu a ti o n a n d c h a ra ct e ri za ti o n o f a n ti o xi d a n t a n d a n ti g e n o to xi c p ro p e rt ie s o f P o rt u g u e se p ro p o li sMárcia Andreia Oliveira Cruz
Outubro de 2011
Universidade do Minho
Escola de Ciências
Trabalho realizado sob a orientação da
Professora Doutora Cristina Aguiar
e do
Professor Doutor Rui Oliveira
Dissertação de Mestrado
Mestrado em Biotecnologia e Bio-empreendedorismo
em Plantas Aromáticas e Medicinais
Evaluation and characterization of
antioxidant and antigenotoxic properties
of Portuguese propolis
ii
Declaração
Nome: Márcia Andreia Oliveira Cruz
Endereço electrónico: [email protected] Telefone: 912060518
Número do Bilhete de Identidade: 13235377
Título da tese: Evaluation and characterization of antioxidant and antigenotoxic properties of
Portuguese propolis
Orientadores: Prof. Doutora Cristina Aguiar e Prof. Doutor Rui Oliveira Ano conclusão: 2011
Designação do mestrado: Mestrado em Biotecnologia e Bio-empreendedorismo em Plantas
Aromáticas e Medicinais
É AUTORIZADA A REPRODUÇÃO INTEGRAL DESTA TESE/TRABALHO APENAS PARA EFEITOS DE INVESTIGAÇÃO, MEDIANTE DECLARAÇÃO ESCRITA DO INTERESSADO, QUE A TAL SE COMPROMETE
Universidade do Minho, 31 de Outubro de 2011
iii Acknowledgments/Agradecimentos
My academic life was only possible with the help of my parents and my brother. The effort, care and love that they gave me through these years were essential to the success of my work. For all that support, I want to thank them a lot. I will love you forever!
Thanks to my boyfriend, always my company, in the best and worst moments, my friend and my love.
To my supervisors, Cristina Aguiar and Rui Oliveira, I thank all their availability, patience, and friendship.
I also want to thank professors Ana Cunha and Margarida Ferreira for helping me to prepare and to analyse propolis extracts. Thanks for sharing your knowledge with me.
I would like to thank Alberta, Ana Raquel and Isabel for their friendship, help and company in the laboratory.
Finally, I would like to show my gratitude to all the staff of the Department of Biology for all assistance in the realization of this work, especially to Cristina Ribeiro for the great help in cytometry and to Isabel.
A huge thank to Pedro Fernandes from “Mel do Abel”, for the kindness in providing Propolis to this work.
v
Avaliação e caracterização das propriedades antioxidante e antigenotóxicas de propolis português
Resumo
O própolis é uma substância produzida pelas abelhas (Apis mellifera L.) após a colheita de brotos e cascas de plantas e pela mistura posterior com a enzima salivar β-glicosidase. As abelhas utilizam o própolis nos seus favos como proteção, para reparar danos, construir locais assépticos para os ovos da rainha, e também como isolante térmico. A composição química do própolis varia geograficamente, com a flora disponível, a época da colheita, e da raça das abelhas. Vários grupos de compostos podem ser encontrados nos extractos de própolis, tais como, polifenóis, terpenóides, esteróides e aminoácidos. Estes compostos têm estado associados a diversas actividades biológicas: antioxidante, antimicrobiana, scanvenger de radicais livres, antigenotóxico/genotóxico e antimutagénico. O própolis português tem sido pouco estudado o que abre a perspectiva da sua valorização económica através da validação cientifica das suas actividades biológicas normalmente atribuídas a amostras de outras origens. Assim, o nosso objectivo prende-se com a análise e estudo do própolis português, nomeadamente no que respeita à sua caracterização química e avaliação das suas actividades biológicas. Uma amostra colhida na Beira Interior (Côa) foi usada para preparar um extracto etanólico de própolis (PEE) para testar em diferentes ensaios utilizando Saccharomyces cerevisiae como modelo biológico. Para investigar o efeito protector do PEE em células de levedura, efectuaram-se ensaios de viabilidade com peróxido de hidrogénio (H2O2). Para avaliar o efeito antigenotóxico de PEE
usou-se o ensaio cometa e para verificar a sua actividade antioxidante intracelular usou-usou-se citometria de fluxo. A amostra de própolis foi analisada quimicamente para quantificar o teor em polifenóis totais e flavonóides, e os métodos de DPPH e ABTS foram usados para demonstrar a actividade antioxidante in vitro. Os nossos resultados sugerem que o própolis português tem capacidade antioxidante quando avaliada pelo ensaio DPPH (in vitro) e por citometria de fluxo (in vivo). Do mesmo modo, a viabilidade celular da levedura aumentou, tanto em condições de pré-incubação e co-incubação, na presença de um agente oxidante (H2O2). No entanto em incubações
prolongadas de células com PEE observamos um decréscimo da viabilidade. O ensaio cometa sugere que o PEE tem efeito antigenotóxico, ao proteger o DNA contra stresse oxidativo, e genotóxico quando usado sozinho na incubação de células. Para além da acção antioxidante, estes resultados sugerem uma acção pró-oxidante do PEE.
vii
Evaluation and characterization of antioxidant and antigenotoxic properties of Portuguese propolis
Resume
Propolis is a substance produced by bees (Apis mellifera L.) after harvest of buds and bark of plants and by subsequent mixing with the salivary enzyme β-glucosidase. Bees use propolis in their combs as protection, to repair damage, to build aseptic locals for the eggs of the queen, and also as a thermal insulator. The chemical composition of propolis varies geographically, with the available flora, the time of collection and the race of the bees. Different group of compounds can be found in propolis extracts, such as polyphenols, terpenoids, steroids and amino acids. These compounds have been associated with diverse biological activities: antimicrobial, antioxidant and scavenger of free radicals, antigenotoxic and genotoxic, antimutagenic. Portuguese propolis has been insufficiently studied, which possibilitates the opportunity for its economic valorization by scientifically support the biological activities commonly assigned to samples from other origins. Thus, our objective relates to the analysis and study of Portuguese propolis, particularly in what concerns chemical characterization and evaluation of biological activities. A sample collected in Beira Alta (Côa) was used to prepare an ethanol extract (PEE) and this extract was tested in different assays, using Saccharomyces cerevisiae as biological model. To investigate the protector effect of PEE in yeast cells, viability assay was made using hydrogen peroxide (H2O2). Comet assay was made to evaluate the antigenotoxic effect of PEE and
flow cytometry to verify the antioxidant activity. The sample was analyzed chemically to quantify total polyphenolic and flavonoids content, and DPPH and ABTS to demonstrate the antioxidant activity in vitro. Our results suggest that Portuguese propolis has antioxidant capacity when assessed by the DPPH assay (in vitro) and flow cytometry (in vivo). Accordingly, viability has improved when propolis was assayed, either by pre-incubation or co-incubation with yeast cells shocked with an oxidant agent (H2O2). However, prolonged incubation of cells with high
concentrations of PEE promoted decrease of viability. Results obtained by the comet assay suggest that PEE has antigenotoxic activity, protecting the genome against oxidative stress, and genotoxic effect when used alone in incubation of yeast cells. Besides the antioxidant activity, we provide results suggesting a prooxidant activity of PEE.
ix
Index
1. Introduction ... 1
1.1. Oxidative stress and genome integrity ... 1
1.1.1. Oxidative stress ... 1
1.1.2. DNA damage and repair ... 2
1.1.3. Methods for DNA damage assessment ... 3
1.1.4. Prevention of DNA damage/oxidative stress using phytochemicals ... 5
1.2. Propolis ... 6
1.2.1. Chemical composition of propolis and biological activities ... 7
1.2.2. Polyphenol and flavonoid compounds... 8
1.2.3. Portuguese propolis ... 8
1.3. Biological problem and objectives of this work ... 9
2. Material and Methods ... 11
2.1. Yeast strain, media and growth conditions ... 11
2.3. Viability assay ... 11
2.4. Comet assay ... 12
2.5. Flow cytometry ... 13
2.6. Chemical analysis of Propolis ... 14
2.6.1. Quantification of total polyphenols content ... 14
2.6.2. Quantification of flavonoids ... 14
2.6.3. DPPH assay ... 14
2.6.4. ABTS assay ... 15
2.7. Statistic analysis... 15
3. Results ... 16
3.1. Effects of PEE on cell viability under stress conditions ... 16
3.2. PEE protects yeast cells from DNA damage by H2O2 ... 19
3.3. Chemical characterization of propolis ... 22
3.4. PEE decreases intracellular oxidation ... 23
4. Discussion ... 25
5. Future perspectives ... 28
x Abbreviation list:
8-oxoG – 8-oxo-7,8-dihydroguanine
ABTS - 2,2'-azino-bis(3-ethylbenzothiazoline-6-sulphonic acid) A/P – apuric/apyrimidinic
BER – Base Excision Repair CAT – catalase
DNA – deoxyribonucleic acid DSB – double-strand breaks
DPPH – 1,1-diphenyl-2-picrylhydrazyl PEE – propolis ethanol extract
EDTA – ethylenediamine tetraacetic acid GSH-Px – glutathione peroxidase
GSH-Red – glutathione dehydrogenase G6PD – glucose-6-phosphate dehydrogenase HR – homologous recombination
H2DCFDA – dichlorofluorescein diacetate
MMR – mismatch repair
NADPH – nicotinamide adenine dinucleotide phosphate (reduced form of NADP+)
NER – Nucleotide Excision Repair NMA – Normal Melting Agarose
NHEJ – non-homologous end joining pathways N7-megG – N7-methylguanine
xi
PCR – polymerase chain reaction ROS – reactive oxygen species SOD – superoxide dismutase SSB – single-strand breaks
Tg – 5,6-dihydroxy-5,6-dihydrothyamine TLS – translesion synthesis
1 1. Introduction
1.1. Oxidative stress and genome integrity 1.1.1. Oxidative stress
Reactive oxygen species (ROS) are formed during the reduction of molecular oxygen to water. This is a reaction occurring in aerobic organisms and it is involved in the production of energy in the electron transport chain. ROS such as superoxide anion (O2
·-), hydrogen peroxide (H2O2) and hydroxyl radicals (·OH) are constantly produced by the mitochondrial respiratory chain,
ionizing radiation, metabolism of exogenous compounds, as a response against infections and inflammation (Huang et al., 2005) and by antioxidant defenses. They interfere with cell components including nucleic acids, proteins and lipids, causing several damages if not neutralized (Tran et al., 1995; Collins, 2009).
In homeostasis, ROS are balanced by antioxidants but if this equilibrium is disrupted, either by an excess of free radicals production or by deficient antioxidant defenses, cells become under oxidative stress (Collins, 2009). This stage causes cellular damage, which may be involved in human diseases such as atherosclerosis, cancer, and neurodegenerative diseases (Parkinson and Alzheimer) (Good et al., 1996; Gssen et al., 1997; Halliwell et al., 1999) and in processes such as aging and apoptosis (Laun et al., 2001).
Aerobic organisms can counteract the effects of ROS by enzymatic antioxidant or nonenzimatic processes that attract and inactivate ROS and maintain the redox stability of cells (Huang et al., 2005). Superoxide anion (O2
·-) produced by cellular respiration or by enzymatic reactions, such as NADPH oxidase and xanthine oxidase, is rapidly converted to H2O2, the
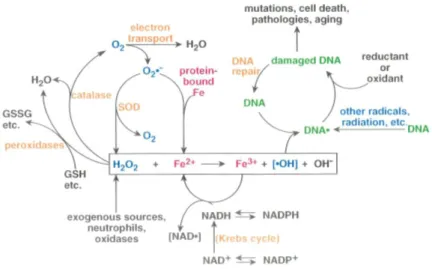
principal cellular mediator of oxidative stress. Many mechanisms are intrinsically correlated with the formation of ROS and, among them the Fenton reaction has an important role (Figure 1). This reaction occurs in the presence of H2O2 that can be formed by endogenous metabolism or
by an exogenous source. In the reduction of O2 in the electron transport chain a small amount of
superoxide (O2·-) is formed and is converted to H2O2 by superoxide dismutase, which reacts with
Fe2+, formed by the release of protein-bound iron, resulting in the formation of ·OH radicals. The
presence of NADH promotes Fe2+ replenishing by reduction of Fe3+. H
2O2 can be depleted by
2
from ROS in cells include low molecular weight scavengers, such as α-tocopherol, cysteine, β-carotene, reduced glutathione or ascorbic acid and enzymatic systems, such as superoxide dismutase (SOD), catalase (CAT), glutathione peroxidase (GSH-Px), glutathione dehydrogenase (GSH-Red) and glucose-6-phosphate dehydrogenase (G6PD) (Halliwell et al., 1989; Izawa et al., 1995).
Figure 1 – Cellular reactions leading to oxidative damage in DNA via the Fenton reaction (Adapted from
Henle et al., 1997).
1.1.2. DNA damage and repair
The integrity and stability of DNA is essential for the survival and normal function of organisms. However, there are constantly damages by endogenous and exogenous genotoxic agents, including those that are produced by oxidative electron transport chain in mitochondria, ionizing radiation, metabolism of exogenous compounds, infection and inflammation. The DNA damage that can occur involves single- and double-stranded DNA breaks (SSB and DSB, respectively), base and sugar modifications, formation of apurinic/apyrimidinic (AP) lesions, and DNA-protein crosslinks (Newcomb et al., 1998; Wang et al., 1998; Friedberg, 2003; Boiteux et al., 2004). One of the most frequent lesions in DNA - the AP sites - can be formed by spontaneous hydrolysis of the N-glycosidic bond or by elimination of damaged or inappropriate bases. These lesions can be mutagenic and can lead to cell death (Huang et al., 2005). DNA bases are under several types of damage occurring by methylation, oxidation and deamination, that can cause lesions such as N7-methylguanine (N7-meG), 8-oxo-7,8-dihydroguanine (8-oxoG),
3
of DNA oxidative damage and can produce GC to TA transversions, pairing with adenine, and potentially increases the risk of mutation and cancers (Kelley et al., 2003). AP sites block DNA replication and transcription (Lindahl et al., 1974; Cadet et al., 1997). The cleavage of AP sites by AP endonucleases or by DNA N-glycosylases/AP lyases forms SSBs with 3’- or 5’-blocked ends that cannot be used as substrates by DNA polymerases or DNA ligases (Krokan, 1997). Besides, 3’- or 5’-blocked SSBs can be converted into highly toxic DSBs after DNA replication (Caldecott, 2001).
Normally, organisms can respond to alterations in their genomic DNA by repairing the damage and restoring the genome to the normal physical and functional state, or they can support the lesions in a way that reduces their lethal effects (Friedberg and Wood, 1996). This DNA repair is possible due to cellular mechanisms such as base excision repair (BER), nucleotide excision repair (NER), mismatch repair (MMR), translesion synthesis (TLS), homologous recombination (HR) and non-homologous end joining (NHEJ) pathways (Prakash et al., 2000; Sluppehaug et al., 2003; Boiteux et al., 2004).
The major DNA repair pathway for the removal of endogenous DNA damage in yeast and mammalian cells seems to be the BER pathway. This pathway is involved in the removal of DNA lesions such as 8-oxoG, uracil, thymine glycols and hydrates. Specific DNA glycosylases participate in BER and occur in two steps: these enzymes catalyze the excision of the base by cleavage of the glycosidic bond, leaving noncoding AP sites in DNA; then, the AP site is cleaved by AP endonucleases and the resulting gap is filled by action of DNA polymerase β (Boiteux et al., 2004; Hanna et al., 2004). The nucleotide excision repair (NER) pathway operates on a large spectrum of base damages, mainly lesions that destabilize the double helix and perturb the DNA structure. These are usually bulky lesions produced by environmental mutagenic and carcinogenic agents such as ultra-violet light (UV) or DNA intrastrand and interstrand crosslinks. This pathway consists in the incision of the DNA strand on both sides of the lesion, resulting in the removal of the damage in an oligonucleotide fragment (25-30 oligonucleotides), followed by repair synthesis and ligation steps (Friedberg et al., 1996).
1.1.3. Methods for DNA damage assessment
DNA damage has been studied in a variety of organisms such as bacteria, cyanobacteria, phytoplankton, macroalgae, plants and animals like humans (Horio et al., 2007). Detection of
4
DNA damage is crucial in the study of processes such as carcinogenesis and ageing (Kumari et al., 2008). Several methods have been developed for DNA damage/repair assessment such as polymerase chain reaction (PCR), comet assay, halo, terminal deoxyribonucleotidyltrasnferase-mediated deoxyuridine triphosphate nick end labeling (TUNEL) assay, HPLC-electrospray tandem mass spectrometry, fluorescence in situ hybridization (FISH) and flow cytometry (FCM) (Kumari et al., 2008). The correlation between the potentialities of each methodology, its advantages and disadvantages and the kind of specific results that can be obtained dictates the selection of the method.
The comet assay or single cell gel electrophoresis (SCGE) was initially developed by Ostling and Johanson (1984) to quantify DNA damage using a microgel electrophoresis technique in neutral conditions, allowing exclusively the detection of DNA double-strand breaks. In 1988, Singh et al. adapted this method to alkaline conditions, allowing assessment of both double- and single-strand DNA breaks, as well the alkali labile sites expressed as frank strand breaks in the DNA (Dhawan et al., 2009). This method has been used to study the role of oxidative stress in human diseases, to detect effects of environmental exposure to genotoxins, and to better understand the importance of antioxidants in our diet (Collins, 2009). Nowadays the assay is well established in genotoxicity testing, it is simple, rapid and visual, and allows assessment of DNA damage and repair in individual cell populations. Other advantages include sensitivity (detection of low levels of DNA damage requires small number of cells - 10,000 - per sample), flexibility (allows the use of proliferating as well as non-proliferating cells), low cost and speed (Dhawan et al., 2009). Nevertheless, the comet assay has some limitations such as the requirement of viable, non-aggregated cell suspension and the impossibility of discrimination between strand breaks from base damage in sample containing necrotic and apoptotic cells. In addition, variation of results can occur due to sample variability (cells and cultures), image analysis systems or visual scoring, and the use of different DNA damage parameters (e.g. olive tail moment and percentage of DNA in the tail), which contribute to inter-laboratory variability (Dhawan et al., 2009). Even though, the advantages of the comet assay outweigh these disadvantages and it is, nowadays, intensively used to assess DNA damage and repair both quantitatively and qualitatively in individual cells (Olive et al., 2006).
5
1.1.4. Prevention of DNA damage/oxidative stress using phytochemicals
Currently, the interest in finding naturally occurring antioxidants has increased, because they can replace synthetic antioxidants, which are being restricted due to reports of suspected carcinogenicity. Herbs have been used for a large range of purposes including medicine, nutrition, fragrances, cosmetic and industrial uses mainly due to their polyphenol contents, that promote the antioxidant potential, flavor and fragrance (Zeng et al., 2001).
Chronic diseases such as cardiovascular diseases, cancer, or Parkinson and Alzheimer diseases tend to be associated to a large production of free radicals, which lead to oxidative stress. However, balanced diets, rich in fruits and vegetables have been associated with lower risk of these diseases, mainly because of antioxidant properties displayed by some of their constituents such as the polyphenolic compounds flavonoids (Arts et al., 2005). In plants, the role of polyphenols is associated with defense mechanisms. In stress conditions, such as temperature alterations, UV exposure and pathogenic attacks, plants increase polyphenol production (Dixon et al., 1995).
One of the most important attributes of polyphenols is their capacity to protect against oxidative damage. They are beneficial in heart diseases to protect from peroxidation of low-density lipoprotein (LDL), and prevent against cancer and genomic instability by combating oxidative DNA damage (Fergunson, 2001). Polyphenols have been associated to antioxidant activity in vitro, being capable of scavenging a wide range of reactive oxygen and nitrogen species, such as superoxide anion, hydroxyl radical, peroxyl radicals, nitric oxide and peroxynitrous acid. Polyphenols can also chelate metal ions, such as iron and copper, preventing or minimizing their participation in Fenton reaction, and thus decreasing pro-oxidant activity of these reactive species (Manach et al., 2004; Halliwell et al., 2005).
Nevertheless, some studies have shown flavonoid pro-oxidant activity in vitro. Pro-oxidant activity appears to require the presence of Fe3+ and high flavonoid concentrations, increasing the
formation of Fe2+ that reacts with H
2O2 in the Fenton reaction (Laughton et al., 1989). In addition,
kaempferol can induce DNA degradation and concurrent lipid peroxidation in rat liver nuclei under aerobic conditions (Sahu et al., 1994).
6
In the presence of copper and absence of H2O2, flavonoids may act as pro-oxidants rather
than antioxidants, and this activity in vitro increases with concentration (Cao et al., 1997). The generation of reactive species and the subsequent damage to macromolecules in flavonoids-Cu2+
-O2 systems can be accounted for the following reaction sequences (Figure 2), where F represents
flavonoids with the structure presented in Figure 3. However, this mechanism may occur in a different way in the intercellular medium because different cellular constituents can interfere with these reactions (Cao et al.,1997).
Figure 2 – Generation of reactive species using copper as catalyst of Fenton reaction. Adapted from Cao et
al. (1997).
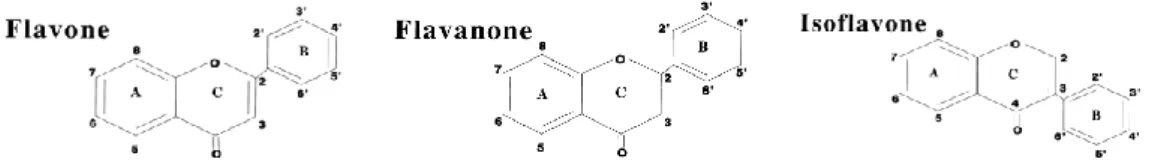
Figure 3 – Struture of the flavonoids Flavone, Flavanone and Isoflavone (Cao et al., 1997).
1.2. Propolis
Propolis is a resinous substance collected by honey bees (Apis mellifera L.) from the buds and bark of plants such as poplar (Populus spp.), birch (Betula alba), beech (Fagus sylvatica), chestnut (Aesculus hippocastanum) and alder (Alnus glutinosa) (Silica et al., 2005; Chen et al., 2007) or from plants such as rosemary (Baccharis dracunculifolia), eucalyptus (Eucalyptus sp.) and pine (Araucaria angustifolia) (Sforcin et al., 2005). Bees mix the resinous substance collected from plants with the salivary enzyme β-glucosidase causing the hydrolysis of glycosyl flavonoids into flavonoids aglucones (Pereira et al., 2002).
Etymologically, the word propolis comes from the Greek words pro – for or in defense – and polis – city – meaning defense of the hive (Sforcin, 2007). Bees use propolis in their combs as protection, to repair damage (cracks and/or openings), to build aseptic locals for the eggs of
7
the queen, to embalm killed invaders - avoiding problems arising from the putrefaction of the corpses (Simões et al., 2004) and preventing the proliferation of microbial infections (Laskar et al., 2010) - and also as a thermal insulator (Moreira et al., 2008; Fokt et al., 2011).
1.2.1. Chemical composition of propolis and biological activities
The composition of propolis varies geographically, with the available flora and the season of collection as well as with the race of the producing bees (Miguel et al., 2006; Sforcin et al., 2011). In general, propolis is composed of 50% resin and vegetable balsam, 30% wax, 10% essential and aromatic oils, 5% pollen and 5% of other substances (Kalogeropoulos et al., 2009). This product is a complex mixture where about 300 compounds have been identified so far. Chemical compounds present in propolis belong to different groups, such as polyphenols (flavonoids including flavones, flavonones, flavonols, dihydroflavonols and chalcones; phenolic acids and their esters), terpenoids, steroids and amino acids (Banskota et al. 2002; Usia et al., 2002; Melliou et al., 2004; Kalogeropoulos et al., 2009). With appropriate solvents such as water, methanol, hexane, acetone and ethanol, extracts of propolis can be obtained containing these compounds. The most used and more efficient in extracting the majority of the main propolis bioactive compounds seems to be ethanol (Gómez-Caravaca et al., 2006; Miguel et al. 2010), also used by beekeepers to make propolis “tincture”.
Propolis has a huge variability worldwide and as such the chemical composition among samples from different continents differs considerably. The American propolis is mainly composed of terpenoids and prenylated derivatives of p-coumaric acids while European (Miguel et al., 2010) and Asian (Usia et al., 2002) propolis contain several types of flavonoids and phenolic acid esters. These compounds, in particular polyphenolic components, caffeic acid derivatives and flavonoids, have been associated with biological activities of propolis, namely antimicrobial (Murad et al., 2002; Silici et al., 2005; Orsi et al., 2005; Kalogeropoulos et al., 2009; Nolkemper et al., 2010) cytotoxic and hepatoprotective (Banskota et al., 2000), radioprotective (Benkovic et al., 2008), antimutagenic (Varanda et al., 1999; Pereira et al., 2008), antioxidant (Mohammadzadeh et al., 2007; Moreira et al., 2008; Miguel et al., 2010; Valente et al., 2010; Laskar et al., 2010) and as a scavenger of free radicals (Banskota et al., 2000; Cardile et al., 2003). Tavares et al. (2006) showed that Brazilian green propolis acted as antigenotoxic at low concentration and as genotoxic substance at high concentration. Compounds that have “double face”, in other words, two different and opponent modes of action, are considered to
8
have a “Janus” effect (from the name of the roman god with two faces), and this type of compounds have been called Janus compounds (von Borstel et al., 1998).
1.2.2. Polyphenol and flavonoid compounds
The human diet is made up of more than 8000 polyphenols. They are phytochemicals derived from phenylalanine containing an aromatic ring with a reactive hydroxyl group. They can be divided into different classes, being the following the most important: flavonoids and phenolic acids (eg. gallic acid), stilbenes (eg. resveratrol) and lignins (eg. secoisolariciresinol). The group of flavonoids comprises seven classes: flavones, flavonol, flavonones, anticianidines, flavan, isoflavones, and chalcones (Araújo et al., 2011). Polyphenols functions in plants are related with the formation of flowers, fruits and seed pigmentation; the attraction of pollinators and dispersion of seeds; protection from UV radiation and the promotion of plant-microorganism interactions (Duthil et al., 2000; Schijlen et al., 2004). Polyphenols are fundamental in the human diet due to the antioxidant (Gladine et al., 2007) and chemopreventive properties (Araújo et al., 2011), protection of UV radiation (Liu et al., 2008) and prevention of oral diseases (Petti et al., 2009).
1.2.3. Portuguese propolis
In the Northern Hemisphere bees collect propolis in final spring, summer and beginning of autumn (Bankova et al., 1998; Sforcin, 2007). Results obtained with Portuguese propolis indicate differences in polyphenols composition of samples collected in winter and in spring, being such content higher in spring. Miguel et al. (2010) took samples from different areas of Algarve (Portugal) and concluded that large distance between apiaries are not necessary to found significant differences in propolis phenol and flavonoids contents. The presence of polyphenols such as flavonoids may explain the antioxidant capacity of propolis, since they can act as scavengers of free radicals. Samples from Algarve display higher scavenger 1,1-diphenyl-2-picrylhydrazyl (DPPH) capacity in winter than in spring which is unexpected because propolis samples collected in spring usually have higher polyphenols and flavonoids content. So, this suggests that propolis phenol content and the antioxidant activity do not correlate, unlike what happens with propolis from the North and Centre of Portugal (Moreira et al. 2008); however, the studies available are still scarce to support this.
Chemical analysis of propolis from Northeast of Portugal demonstrated the presence of 37 compounds such as methylated and/or esterified or hydroxylated derivatives of common
9
polar flavonoids, peculiar derivatives of pinocembrin/pinobanksin containing a phenylpropanoic acid derivative moiety in their structure and a p-coumaric ester derivative dimmer (Falcão et al., 2010). The chemical analysis of Portuguese propolis is very important in order to identify its compounds, to ascribe bioactive compounds to propolis activities, and to compare national propolis with other worldwide samples.
1.3. Biological problem and objectives of this work
Excessive agricultural and industrial activities promote increasing release of toxic substances in the environment, leading to deterioration of air, water and soil quality, which comprehend several risks to the survival of species (Dhawan et al., 2009). Nowadays, the interest in natural products has been increasing since the suspected toxicity of some synthetic compounds used in food (Stone et al., 2003), and because of that industries such as cosmetic and pharmaceutical have increased their efforts in obtaining bioactive compounds from natural products by extraction and purification (Halliwell, 1997).
Many natural products have been identified as containing several bioactivities capable to provide protection against disorders associated with cancer, cardiovascular diseases, aging and neurodegenerative diseases such as Parkinson and Alzheimer (Good et al., 1996; Gassen et al., 1997; Halliwell et al., 1999; Russo et al., 2003). These activities are correlated with the presence of polyphenols, mainly flavonoids, which have high antioxidant properties and also protect nuclear DNA from damage caused by hydrogen peroxide through the role of iron chelation (Melidou et al., 2005). However, some studies showed that several flavonoids act, either, as prooxidant and genotoxic (Cao et al., 1997).
Saccharomyces cerevisiae has been used as a model to understand the complex physiological, biochemical and molecular processes in metazoan cells. The advantages of this biological model are well known and relate to fast growth, cheap cultivation and tractability. The molecular mechanisms of fundamental cellular processes are very similar between higher eukaryotes and yeast, in transcription, replication, and DNA repair. The full genome sequence of S. cerevisiae is now available, and so this organism is one of the most studied model systems in cell biology, molecular biology and genetics (Grzelak et al., 2006).
10
The aim of this work relates to the analysis and study of the antioxidant and antigenotoxic properties of Portuguese propolis. This work comprises a chemical characterization and the investigation of biological activities in a sample collected in Beira Alta (Côa), used to prepare a propolis ethanol extract (PEE), which was used in the following studies.
In order to investigate the antigenotoxic/genotoxic effect of PEE the comet assay was performed to measure DNA damage after pre-, and co-incubation of S. cerevisiae cells with propolis. Hydrogen peroxide, which causes base oxidation and single-strand breaks mediated by the highly reactive hydroxyl radicals (Miloshev et al., 2002), was used as stressing agent. Cell viability under stress (5 mM H2O2) and non-stress conditions, was also evaluated in pre-, co- and
post-incubation assays to understand propolis effects. To complete the study, flow cytometry was used to evaluate intracellular oxidation and antioxidant activity in vivo.
11 2. Material and Methods
2.1. Yeast strain, media and growth conditions
In all experiments the haploid Saccharomyces cerevisiae strain BY4741 (MATahis3Δ1 leu2Δ0 met15Δ0 ura3Δ0) (Brachmann et al., 1998) was used. Cells were grown on liquid YPD medium (1% w/v yeast extract, 1% w/v peptone and 2% w/v glucose), in an orbital shaker at 30 ºC and 200 revolutions per minute (rpm). Growth of cultures was monitored by optical density measurement at 600nm (OD600).
2.2. Propolis extract
Propolis was obtained in August 2010 from an apiary in Côa (Beira Interior), Portugal. For alcoholic extraction the raw propolis was incubated with 100 mL absolute ethanol in an orbital shaker at room temperature and in the dark. The solution was filtered (Whatman filter nr. 4) and the residue was re-dissolved in 100 mL absolute ethanol three times more. The filtrates were pooled and dried in a rotary evaporator, at 40 ºC under stirring, yielding the propolis ethanolic extract (PEE), which was stored in the dark at 4 ºC until further use.
2.3. Viability assay
Cultures of 5mL YPD media were incubated overnight at 30 ºC and 200 rpm (pre-inoculum). Pre-inocula were diluted with fresh media to obtain 50 mL cultures with OD600 0.1 and
incubated under the same conditions until OD600 0.4-0.8 (exponential phase), ensuring growth for
2 generations. For each assay, cells were harvested from 5 mL of the culture by centrifugation at 5869 x g, 2 min at 4 ºC, washed twice with the same volume of sterilized deionized H2O at 4 ºC
and suspended in the same volume of S buffer (1 M sorbitol, 25 mM KH2PO4, pH 6.5) at 4 ºC.
Assays were performed with these cell suspensions using PEE in pre-incubation, co-incubation and post-incubation conditions.
A volume of 100 µL of cell suspension (in S buffer) was removed, serially diluted to 10-4 in
sterilized deionized H2O and spread on solid YPD medium (YPD with 2% w/v agar), in order to
obtain a control situation.
In pre-incubation conditions, different stock solutions of PEE were added to the cell suspension for 300 µg/mL, 100 µg/mL or 25 µg/mL final concentration (final volume of 5 mL
12
was maintained in all samples). Alternatively, S buffer and ethanol were added to a similar cell suspension, to be used as control. The different suspensions were incubated for 20 min, at 30 ºC, 200 rpm. At the end of this incubation time, 100 µL was taken, serially diluted to 10-4 in
sterilized deionized H2O and transferred to YPD plates as 7 drops of 40 µL each. Cells of the
suspension were washed twice with the same volume of sterilized deionized H2O at 4 ºC and
suspended in the same volume of S buffer. From a stock solution of 1M H2O2, 25 µL were added
for 5 mM final concentration and the suspension was incubated for 90 min under the same conditions. Samples were harvested at 5, 10, 15, 30, 60 and 90 min, serially diluted to 10-4 in
sterilized deionized H2O and 7 drops of 40 µL each were transferred to YPD plates. Plates were
incubated at 30 ºC for 48 h and the colonies were counted. Survival rates were calculated as percentage of colony-forming units (CFU), assuming 100% survival for cells of the suspension before any treatment (H2O2, propolis or ethanol).
In co-incubation experiments, the procedure was the same, except for the simultaneous incubation with PEE or ethanol and H2O2. In post-incubation experiments the procedure was also
similar except for the previous incubation with H2O2 (5 mM final concentration) with subsequent
incubation with PEE or ethanol (control) for 20 min. 2.4. Comet assay
Cultures in 5 mL YPD medium were incubated overnight at 30 ºC, 200 rpm (pre-inoculum). Pre-inocula were diluted to obtain 10 mL cultures with OD600 0.1 and were incubated under the
same conditions until OD600 0.4-0.8 (exponential phase), ensuring 2 generations growth. Cells
were harvested by centrifugation of 1 mL of the suspension at 17608 x g, 2 min at 4 ºC, and washed twice with the same volume of deionized H2O at 4 ºC. The pellet was ressuspended in
lyticase buffer (200U/mL lyticase, 500 µL S buffer 2x, 300 µL deionized H2O and 50 mM
β-mercaptoethanol) and incubated at 30 ºC, 200 rpm for 40 min in order to obtain spheroplasts. Spheroplasts were washed twice with deionized H2O, ressupended in the same volume of S
buffer and distributed by aliquots of 50 µL. Each aliquot was centrifuged at 17608 x g, 2 min at 4 ºC and the pellet ressuspended in 500 µL S buffer. PEE (300 µg/mL, 100 µg/mL and 25 µg/mL), H2O2 (10 mM), and S buffer or ethanol (controls), were added according to the type of
incubation described above: pre-, co- and post-incubation. In all cases, the incubation time was 20 min, followed by two washes with deionized H2O. The resultant pellet was ressuspended in
13
previously layered with 0.5% (w/v) normal melting agarose (NMA), covered with cover slips and incubated in ice in order to solidify the agarose. The cover slips were removed after 5min and the glass slides were submerged in lysing buffer (300 mM NaOH, 5 M NaCl, 0.5 M Ethylenediamine tetraacetic acid (EDTA), 0.1 M Tris-HCl, 0.05% w/v Laurylsarcosine, pH 10) for 20 min. Glass slides were incubated in electrophoresis buffer (300 mM NaOH, 0.5 M EDTA, 0.1 M Tris-HCl, pH 10) for 20 min, placed in the electrophoresis chamber with electrophoresis buffer and electrophoresis was performed at 0.7 V/cm for 10 min at 4º C. The gels were neutralized with 10 mM Tris-HCl buffer, pH 7.4, for 10 min, and samples were fixed, firstly during 10 min in 76% v/v ethanol and then 10 min with 96% v/v ethanol. The slides were dried at room temperature or in a laminar flow chamber and visualized immediately or stored at 4 ºC until observation. The comets were analyzed by fluorescence microscopy (Leica DMB 5000, black and with camera) after staining with 10 µL of GelRed™ (diluted 10,000 fold from the stock solution; Biotium). The tail length was measured with CometScore software.
2.5. Flow cytometry
Cultures in 5 mL YPD medium were incubated overnight at 30 ºC, 200 rpm (pre-inoculum). Pre-inocula were diluted to obtain 10 mL cultures with OD600 0.1 and were incubated under the
same conditions until OD600 0.4-0.8 (exponential phase), ensuring 2 generations growth. Cells
were harvested by centrifugation of 1 mL of the suspension at 17608 x g, 2 min at 4 ºC and washed twice with the same volume of PBS (137 mM NaCl, 2.7 mM KCl, 4.3 mM Na2HPO4, 1.47
mM KH2PO4, pH 7.4). The suspension was diluted to OD600 0.02 and 500 µL were removed for
auto fluorescence measurement. Dichlorofluorescein diacetate (H2DCFDA) of was added to the
suspension (50 µM final concentration) before incubation at 30 °C, 200 rpm during 1 h in the dark. Cells were washed twice with the same volume of PBS and aliquots of 1 mL were mixed with the PEE and H2O2 in co-incubation conditions and incubated at 30 °C, 200 rpm, 20 min in
dark. Treatments were as follows: PBS, 10 mM H2O2, 2% ethanol, 300 µg/mL PEE, 300 µg/mL
PEE and 10mM H2O2, 100 µg/mL PEE, 100 µg/mL PEE and 10mM H2O2, 25 µg/mL PEE, and
25 µg/mL PEE and 10mM H2O2. Twenty thousand cells of each sample were analyzed by flow
cytometry in an Epics® XLTM cytometer (Beckman Coulter) equipped with an argon-ion laser
emitting a 488 nm beam at 15 mW. Green flurescence was collected through a 488 nm blocking filter, a 550 nm long-pass dichroic and a 225 nm band-pass filter. Data were analyzed and histograms were made with the WinMDI 2.8 software.
14
2.6. Chemical analysis of Propolis
Spectrophotometric methods were used to perform PEE chemical analysis: the determination of total polyphenols and flavonoids contents and the evaluation of the antioxidant capacity of the sample.
2.6.1. Quantification of total polyphenols content
To quantify total polyphenol content in PEE, 300 mg ethanol solution of propolis, diluted 4-fold (0.0499 mg/g final concentration), mixed with 2.0 g deionized H2O, 200 mg Folin-Ciocalteu
reagent, 2,0 g of 10% NaCO3, and H2O to complete 10,000 g final mass of the mixture. The
reducing power of phenols in the mixture was observed by optical density at 760 nm (OD760) after
1 h incubation. Polyphenol concentration in propolis sample was calculated taking the standard gallic acid as reference and results were expressed as gallic acid equivalents.
2.6.2. Quantification of flavonoids
This method allows quantification of substances (flavonoids) capable to inhibit the chelation of aluminum of the ethanolic solution of AlCl3·6H2O. Five hundred mg of the solution
AlCl3·6H2O 2% were added to 300 mg of ethanolic solution of propolis (10,887 mg/g) and
ethanol was used to complete the mixture final mass of 10,000 g. After 30 min, chelation of aluminum was followed by optical density at 420 nm (OD420). Flavonoids concentration in PEE
was calculated comparing with quercetin (1,2mg/g), used as standard, and results are expressed as quercetin equivalents.
2.6.3. DPPH assay
One of the main referred propolis activities is antioxidant capacity. This capacity can be tested by chemical assays such as DPPH or 2,2'-azino-bis(3-ethylbenzothiazoline-6-sulphonic acid) (ABTS) methods. DPPH assay quantifies the existence of antioxidant activity of a solution that can reduce the DPPH molecule, by the capture of the free electron of nitrogen atom present in DPPH. xThis reduction is visible by the loss of violet colour and is followed by OD517, after 20 min in dark.
Two hundred mg of PEE 4x diluted (0.0498 mg/g final concentration) were added to 500 mg ethanol solution of DPPH (0.5 mM) and the final mass of the mixture (3,000 g) was completed with absolute ethanol. After 20 min incubation OD517 was measured and the amount of
15
antioxidant substances present in PEE was calculated taking the standard gallic acid as reference (5 mg/g 5x diluted) and results were expressed as gallic acid equivalents.
2.6.4. ABTS assay
The antioxidant capacity of propolis extract was also determined by the ABTS assay, which quantifies the substances capable to inhibit oxidation of ABTS radical. ABTS work-solution (2.5 g) was added to 100 mg of PEE (10,887 mg/g) and ethanol was added to complete a final mass of the mixture of 3,000 g. After 30 min incubation in the dark, the optical density of the samples was measured at 734 nm and the amount of antioxidant substances present in propolis sample was calculated taking the standard gallic acid as reference (5mg/g 5x diluted) and results were expressed as gallic acid equivalents.
2.7. Statistic analysis
The experiments were done in triplicate and results are presented as a mean±standard deviation (SD). One-way analysis of variance (ANOVA) was used for comparison of more than two means and Tukey’s test was used to perform multiple comparisons. All asterisks indicate statistically significant differences when compared to the respective control: * means p < 0.05, ** means p < 0.01, and *** means p < 0.001.
16 3. Results
Several reports in the literature have recently provided evidence of the anticancer and antioxidant properties of ethanolic extracts of Portuguese propolis (Moreira et al., 2008; Miguel et al., 2010; Valente et al., 2011). Based on the documented antioxidant properties and flavonoids presence in propolis, we decided to investigate the effect of a Portuguese propolis ethanol extract (PEE) against oxidative stress in S. cerevisiae cells measured as viability and antigenotoxicity.
3.1. Effects of PEE on cell viability under stress conditions
In viability assays, three methodologies were applied: pre-incubation, co-incubation and post-incubation. In all cases, cultures of yeast cells were diluted 50 fold in S buffer when incubated with PEE. In pre-incubation experiments, cultures were incubated with PEE at 30 ºC, 200 rpm for 20 min, washed twice with deionized H2O and subsequently incubated with 5 mM
H2O2 under the same conditions. Aliquots of the culture were harvested at different time-points,
diluted (10-4 dilution) and plated solid YPD medium in order to count colonies after 48 h
incubation at 30 ºC. Cell death was considered as loss of viability expressed as percentage of colonies of test plates when compared to the reference plate, without toxic treatment. A control experiment without PEE and H2O2 was included so that viability of untreated and non-stressed
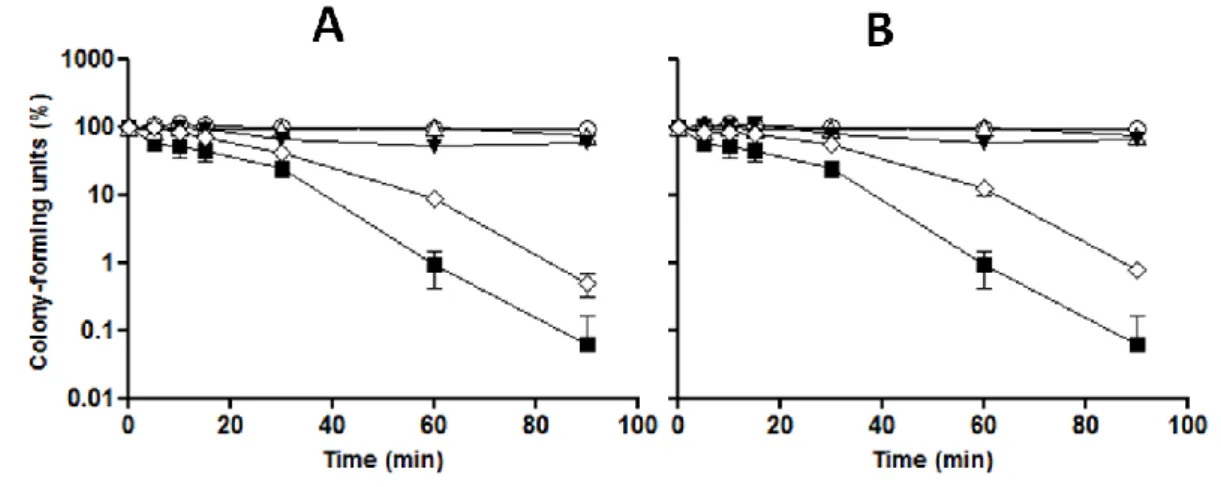
cells could be determined. Results obtained (Figure 4) show that yeast cells when exposed to 5 mM H2O2 had a significant decrease in survival rate. However, when cells were pre-treated with
300 µg/mL (Figure 4A) and 100 µg/mL (Figure 4B) of PEE, loss of viability was slower during the 90 min of exposure to 5 mM H2O2. As expected, cells without any treatment and treated only
with PEE or ethanol 2% showed a nearly constant survival rate for 90 min incubation. These results suggest that PEE in pre-incubation protect yeast cells against oxidative stress, by promoting cell adaptation to oxidative stress.
17
Figure 4 – Pre-incubation with PEE increases viability of S. cerevisiae cells under oxidative stress. Yeast
cells were incubated with PEE (A: 300 µg/mL; B: 100 µg/mL) for 20 min, washed and suspended in S buffer, and subsequently, incubated with 5 mM H2O2 for different points (0, 5, 10, 20, 30, 60 and 90 min). At each
time-point, an aliquot was collected, diluted to 10-4 and spread on YPD plates. Colonies were counted after 48 h
incubation at 30 ºC. The same procedure was applied to all treatments: cells only with S buffer ( ), treated with H2O2 ( ), treated with 2% ethanol ( ), treated only with PEE ( ) and treated with PEE and H2O2 ( ). Data are
the mean±SD of three independent experiments.
To investigate a direct antioxidant activity of PEE on the toxicant we have performed co-incubation experiments. Cells were incubated simultaneously with PEE (300 µg/mL, 100 µg/mL and 25 µg/mL) and 5 mM H2O2 under the same conditions. Aliquots of the culture were
harvested at different time-points, diluted (10-4 dilution) and plated on YPD plates in order to
count colonies after 48 h incubation at 30 ºC. Cell death was considered as loss of viability expressed as percentage of colonies of test plates when compared to the reference plate, without toxic treatment. A control experiment without PEE and H2O2 was included so that viability of
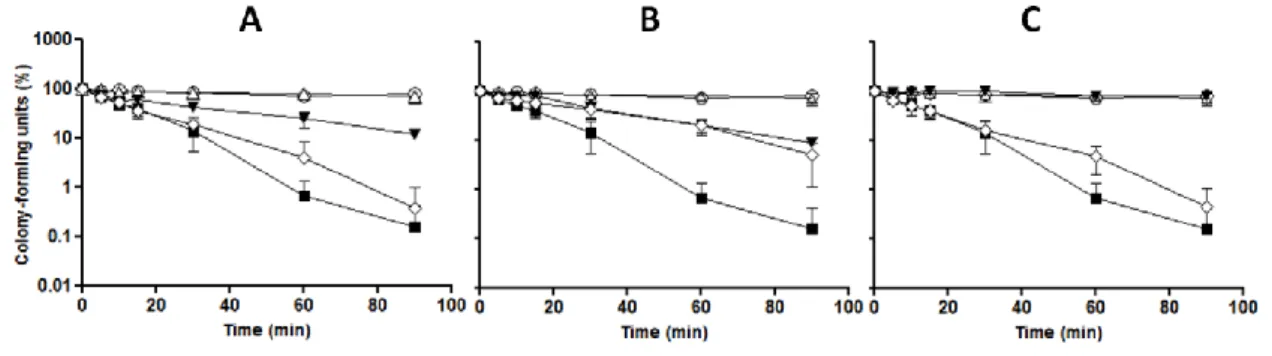
untreated and non-stressed cells could be determined. Results obtained (Figure 5) show that yeast cells when exposed to 5 mM H2O2 had a significant decrease in survival rate. However,
when cells were incubated with of PEE, the loss of viability was slower during the 90 min of exposure to 5 mM H2O2. As expected, cells without any treatment and treated only with PEE or
ethanol 2% displayed a nearly constant survival rate during all the experiment. At 100 µg/mL (Figure 5B) PEE provided more protection when compared with the other concentrations (figs. 5A and 5C). These results suggest that PEE protects yeast cells against oxidative damage also in co-incubation with H2O2.
18
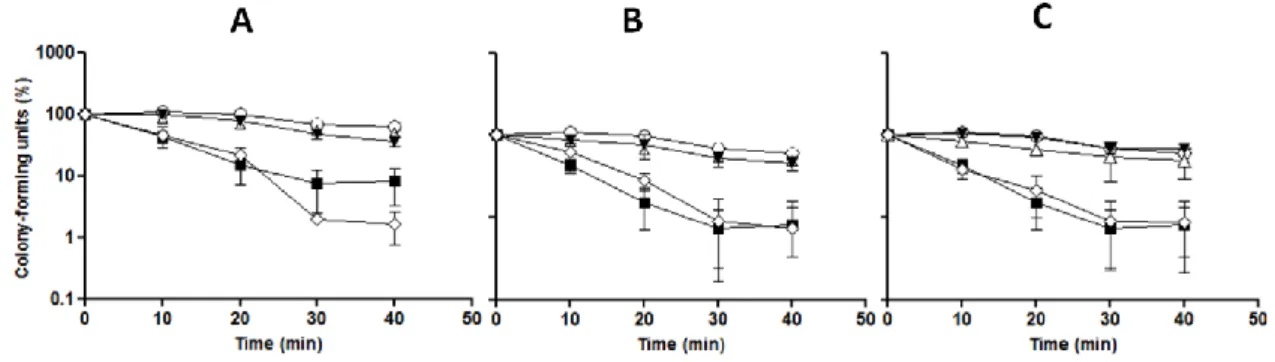
Figure 5 – PEE increases viability of S. cerevisiae cells when co-incubated with H2O2. Yeast cells were
co-incubated with PEE (A: 300 µg/mL; B: 100 µg/mL; C: 25 µg/mL) and 5 mM H2O2 for different time-points (0, 5, 10,
20, 30, 60 and 90 min). At each time-point, an aliquot was collected, diluted to 10-4 and spread on YPD plates.
Colonies were counted after 48 h incubation at 30 ºC. The same procedure was applied to all treatments: cells only with S buffer ( ), treated with H2O2 ( ), treated with 2% ethanol ( ), treated only with PEE ( ) and treated
with PEE and H2O2 ( ). Data are the mean±SD of three independent experiments.
After investigating protection in pre- and co-incubation, we have performed post-incubation experiments to study if PEE promotes recovery from damage caused by H2O2 in yeast cells. Cells
were incubated with 5 mM H2O2 during 20 min, at 30 ºC, 200 rpm, washed twice and
subsequently incubated with PEE (300 µg/mL, 100 µg/mL and 25 µg/mL) for 20 min. Aliquots of the culture were harvested at different time-points, diluted to 10-4 and spread on YPD plates in
order to count colonies after 48 h incubation at 30 ºC. Cell death was considered as loss of viability expressed as percentage of colonies of test plates when compared to the reference plate, without toxic treatment. A control experiment without PEE and H2O2 was included so that viability
of untreated and non-stressed cells could be determined. Results obtained (Figure 6) show that post-treatments with PEE with yeast cells exposed to 5 mM H2O2 did not change significantly
survival rate, except for 300 µg/mL (Figure 6A) PEE, which promoted faster loss of viability than with H2O2 alone. These results suggest that PEE at 100 µg/mL and 25 µg/mL did not improve
oxidative damage recovery after damage in cells promoted by H2O2,. However, at 300 µg/mL
evidence suggests that oxidative damage is more pronounced. As expected, cells without any treatment and treated only with PEE or 2% ethanol showed a nearly constant survival rate throughout the experiment.
19
Figure 6 – Post-incubation with PEE did not affect the viability of S. cerevisiae cells exposed to oxidative
stress. Yeast cells were incubated 10 min with 5 mM H2O2, washed and incubated with PEE (A: 300 µg/mL; B: 100
µg/mL; C: 25 µg/mL) for 10 min. At each time-point 0, 10, 20, 30, 40 min, an aliquot was collected, diluted to 10-4
and spread on YPD plates. Colonies were counted after 48 h incubation at 30 ºC. The same procedure was applied to all treatments: cells only with S buffer ( ), treated with H2O2 ( ), treated with 2% ethanol ( ), treated only
with PEE ( ) and treated with PEE and H2O2 ( ). Data are the mean±SD of three independent experiments.
3.2. PEE protects yeast cells from DNA damage by H2O2
The capacity of propolis decrease DNA damage promoted by H2O2 has been scarcely
reported before (Russo et al., 2006). In addition, to our knowledge, Portuguese propolis has not been studied for antigenotoxicity. Therefore, we decided to investigate antigenotoxicity of Portuguese propolis, using the yeast comet assay in cells, under pre- and co-incubation conditions.
Yeast spheroplasts were pre-treated with 300 µg/mL, 100 µg/mL and 25 µg/mL in S buffer to maintain osmotic protection of spheroplasts, and then, exposed to 10 mM H2O2. Several
controls were included: incubation only with S buffer; incubation with ethanol as control of the dilutions of PEE used; incubation with H2O2; and incubation only with PEE. Control experiments
indicate that S buffer (untreated cells) and ethanol (PEE solvent) did not cause damage to DNA (Figure 7). As expected, H2O2 increased dramatically comet tail length and when yeast
spheroplasts were treated with PEE before exposure to H2O2, a statistically significant decrease in
20 Untr eate d ce lls O2 2 10 m M H Eth anol 300µg /mL PEE 2 O 2 300µg /mL PEE+ H 100µg /mL PEE 2 O 2 100µg /mL PEE+ H 25µg /mL PEE 2 O 2 25µg /mL PEE+ H 0 10 20 30 40 T a il l e n g th ( m)
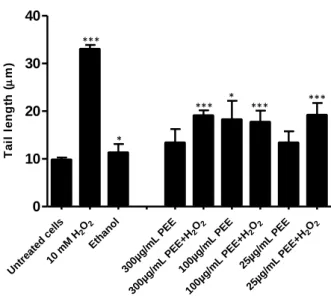
Figure 7 - Pre-treatment of S.cerevisiae cells with PEE protects DNA against oxidative damage by H2O2.
Spheroplasts were incubated with PEE (300 µg/mL, 100 µg/mL and 25 µg/mL) for 20 min, washed, and subsequently incubated with 10mM H2O2 for 20min. In samples with exclusive PEE treatment H2O2 was replaced by S
buffer. DNA damage was analyzed with the yeast comet assay (see Materials and Methods). Cells without any treatment were included in the experiment (untreated cells) as well as cells treated with ethanol and with H2O2 (10
mM H2O2) and treated only with PEE solvent (ethanol). Mean±SD values are from three independent experiments (*
represent p < 0.05 and *** p < 0.001).
Figure 8 – Photomicrographss of yeast comets after DNA staining with GelRed. A: control experience only
with S buffer; B: cells treated with ethanol before incubation with 10 mM H2O2; C: incubation with ethanol before
incubation with S buffer; D: incubation with 300 µg/mL PEE before incubation only with S buffer; E: incubation with 300 µg/mL PEE before incubation with 10 mM H2O2; F: incubation with 100 µg/mL PEE before incubation only with
S buffer; G: incubation with 100 µg/mL PEE before incubation with 10 mM H2O2; H: incubation with 25 µg/mL PEE
before incubation only with S buffer; I: incubation with 25 µg/mL PEE before incubation with 10 mM H2O2. All
images were obtained at 400x magnification.
***
*** * *** ***
21
When cells were incubated only with 100 µg/mL of PEE, a statistically significant increase in comet tail length compared with cells treated with ethanol was observed, suggesting that PEE has also genotoxic activity. As depicted in Figure 7, genotoxicity did not correlate directly with PEE, however, this activity is in accordance with a previous report by Tavares et al. (2006) who concluded that PEE is both, genotoxic and antigenotoxic.
Subsequently, we decided to assay co-incubation of yeast cells with PEE and H2O2 to
investigate if antioxidant activity of PEE protects DNA cells from damage under oxidative stress conditions. In this experiment we incubated spheroplasts with PEE (300 µg/mL, 100 µg/mL and 25 µg/mL) and 10 mM of H2O2 for 20 min and then we analyzed DNA damage. Several controls
were included: incubation only with S buffer; incubation with ethanol as control of the dilutions of PEE used; incubation only with H2O2; and incubation only with PEE. Control experiments indicate
that S buffer did not cause damage of DNA, but ethanol caused a significant increased in the tail length of the comets (Figure 9). In addition, H2O2 increased dramatically comet tail length and
when yeast spheroplasts were treated only with PEE, we observed a statistically significant increase in tail length comparing with the control (ethanol). These results suggest that PEE acted as a genotoxic agent to S. cerevisiae cells. However, in the presence of a toxic agent, H2O2, 300
µg/mL PEE displayed antigenotoxic activity, since the tail length of the comets had a statistically significant decrease relatively to the control (H2O2) (Figures 9 and 10). So, in co-incubation
conditions PEE can act either, as an antigenotoxic and as genotoxic agent. Interestingly, while genotoxicity was observed for all assayed concentrations, antigenotoxicity was only observed for the higher concentration (300 µg/mL).
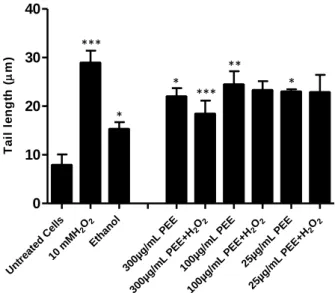
Untr eate d C ells 2O2 10 m MH Ethan ol 300µg /mL PEE 2 O 2 300µg /mL PEE+ H 100µg /mL PEE 2 O 2 100µg /mL PEE+ H 25µg /mL PEE 2 O 2 25µg /mL PEE+ H 0 10 20 30 40 T a il l e n g th ( m)
Figure 9 – Co-incubation of S. cerevisiae cells with 300 µg/mL PEE protects cells from DNA damage under
oxidative stress with 10 mM of H2O2. In samples with exclusive PEE treatment H2O2 was replaced by S buffer. DNA
damage was analyzed with the yeast comet assay (see Materials and Methods). Cells without any treatment were included in the experiment (untreated cells; suspended in S buffer) as well as cells treated with ethanol and with H2O2
(10 mMH2O2) and treated only with PEE solvent (ethanol). Mean±SD values are from three independent experiments
(* represent p < 0.05, ** p < 0.01 and *** p < 0.001). *** *** * * * **
22
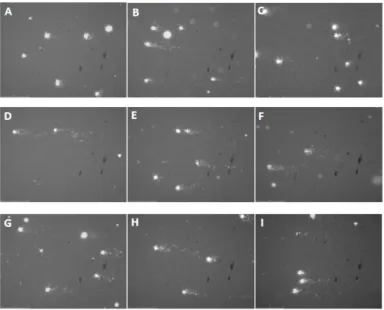
Figure 10 – Photomicrographs of yeast comets after DNA staining with GelRed. A: control experience only
with S buffer; B: cells treated with 10 mM H2O2; C: incubation with ethanol; D: incubation with 300 µg/mL PEE; E:
incubation with 300 µg/mL PEE and 10 mM H2O2; F: incubation with 100 µg/mL PEE; G: incubation with 100
µg/mL PEE and 10 mM H2O2; H: incubation with 25 µg/mL PEE; I: incubation with 25 µg/mL PEE and 10 mM H2O2.
All images were obtained at 400x magnification.
3.3. Chemical characterization of propolis
To characterize chemically propolis used in this work we analyzed the total content of polyphenols and flavonoids, the main potentially bioactive compounds found in propolis. We analyzed total polyphenols with the Folin-Ciocaulteu method by measuring OD760 after reaction
PEE, Folin-Ciocaulteu reagent and Na2CO3, the result was expressed in mg galic acid equivalent/g
of sample. To analyze the flavonoids content, we used AlCl3·H2O2, which is quelated by flavonoids,
resulting a yellow color proportional to the concentration flavonoids and the result was expressed in mg quercetine equivalent /g of sample. In addition, we used DPPH (violet color) and ABTS (blue-green color) radicals to quantify the in vitro antioxidant capacity of PEE, both in mg galic acid equivalent/g of sample. The results are express in table 1. We can’t comparing ours results of DPPH and ABTS with others reports, because no one did the methods in mg/g of sample like us.
Table 1 – Chemical analysis of PEE. Total polyphenols and flavonoids content, and in vitro antioxidant
activity of PEE by DPPH and ABTS methods.
Total Polyphenols
(mg GAE/g) Flavonoids (mg QE/g) (mg GAE/g) DPPH (mgGAE/g) ABTS
23
3.4. PEE decreases intracellular oxidation
Chemical characterization of PEE suggests antioxidant capacity of PEE, which correlates with results obtained in viability assays with cells stressed with H2O2. To investigate if PEE
influences the intercellular oxidation in the presence of H2O2, we have performed experiments in
co-incubation conditions using flow cytometry with H2DCFDA as probe. This substance enters the
cell and is deacetylated to dichlorofluorescein (DCFH2) by intracellular esterases. The
deacetylated form DCFH2 is hydrophilic and becomes trapped inside the cells due to
impermeability of plasma membranes. In the presence of oxidants, DCFH2 oxidizes, forming DCF,
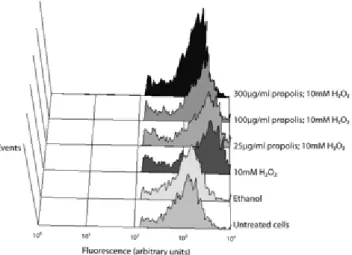
which is fluorescent with excitation at 530nm and emission at 485nm. With this approach, we expected to observe a decrease in fluorescence in cells treated with PEE and H2O2 10mM
comparing with controls (H2O2). As depicted in Figure 11, treatment with PEE decreased
intracellular fluorescence in a dose-dependent manner when compared with cells treated only with 10 mM H2O2. To verify that fluorescence measured in the cytometer was from intracellular
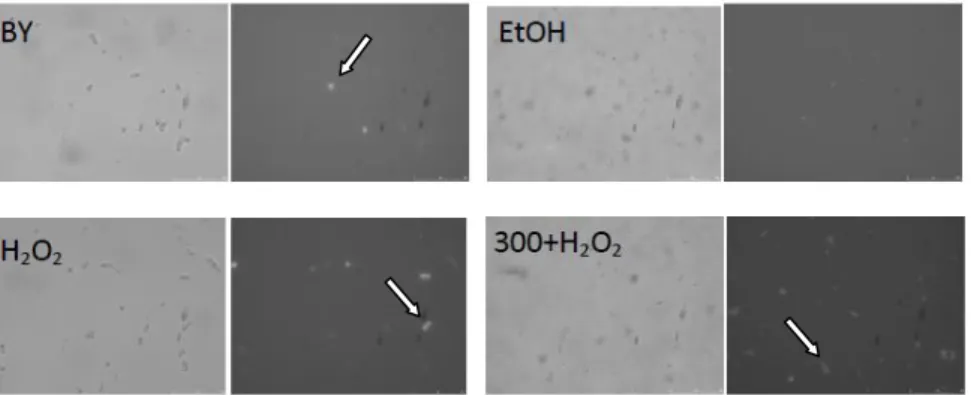
fluorochrome, we analyzed an aliquot of cells from each sample in fluorescence microscopy (Figure 12). As shown in Figure 12, a significant proportion of cells displayed intracellular fluorescence upon incubation with H2DCFDA.
Figure 11 – Intercellular oxidation of S. cerevisiae cells co-incubated with PEE and 10 mM H2O2, by flow
cytometry. Cells were loaded with H2DCFDA, treated with PEE and 10 mM H2O2 for 20 min and analyzed for
24
Figure 12 – Photomicrographs of S. cerevisiae cells with fluorescence (H2DCFDA) after co-incubation with S
buffer (BY; 200x magnification), ethanol (EtOH; 400x magnification), H2O2 10 mM (H2O2; 200x magnification), and
PEE and H2O2 (300+H2O2; 400x magnification). For each sample bright field (left image) and fluorescence microscopy
25 4. Discussion
Our interest in Portuguese propolis relates to the existence of only few reports on biological activities, namely antioxidant and antigenotoxic and genotoxic. In the last decades propolis has been widely study to complement its use in medicine, cosmetic and food. Over the last decades, research has been engaged to support scientifically characteristics that confer propolis the traditionally known healing properties and subsequently increase its economical valorization. The principal significance of the study of propolis relates to the importance of standardization for its acceptance as a medicine (Sforcin et al., 2011). One of the most documented characteristics of propolis is antioxidant activity (Silici et al., 2005), free radical scavenging (Banskova et al., 2000; Russo et al., 2003; Simões et al., 2004), antigenotoxicity and genotoxicity (Tavares et al., 2006), antimutagenicity (Varanda et al., 1999), anti-cancer activity (Valente et al., 2011) and antimicrobial activity (Kalogeropoulos, et al., 2009). In the literature on Portuguese propolis several reports mention mainly antioxidant potential (Moreira et al., 2008; Miguel et al., 2010; Moreira et al., 2011) and the potencial to inhibit human renal cancer cell growth (Valente et al., 2011).
In our work, we aimed to further support the antioxidant activity and the antigenotoxic/genotoxic activities of Portuguese propolis ethanolic extract. When we incubated cells firstly with PEE and then with H2O2, we observed an increase in cell viability relatively with
the control (H2O2) (Figure 4). These results suggest that PEE activates the antioxidant
mechanisms in cells, promoting an alert state in intercellular medium allowing cells to cope more efficiently with oxidative stress. Some reports suggest that polyphenols can act either, as anti-oxidant and as pro-anti-oxidant, mainly by promoting the Fenton reaction with cooper ions (Cao et al., 1997). In co-incubation with PEE and H2O2, we observed a more pronounced increase in cell
viability when 100 µg/mL was used relatively with the control situation (H2O2) (Figure 5B). This
suggests that a direct ROS scavenging effect (co-incubation) is more efficient than an activation of stress responses (pre-incubation) in promoting cell survival under oxidative stress. However, when cells were incubated only with PEE, in the concentration of 300 µg/mL and 100 µg/mL, we observed decreased cell viability in co-incubation than in pre-incubation experiments. In the former case cells were in contact with PEE and H2O2 for 90 min, far more than the 20 min
incubation with PEE in pre-incubation experiments. Therefore, the pro-oxidant activity would have more impact in cell viability as is further supported by the dose-dependent decrease in cell
26
viability caused by PEE in co-incubation (Figure 5). To complete the study of the effect of PEE in cell viability, we did a post-incubation experience to verify if PEE can improve recovery from exposure to an oxidative agent. Our results suggest that PEE does not improve recovery upon oxidative shock and may even contribute to decrease cell viability, especially at high concentrations. This further support the prooxidant activity of PEE discussed above, which is especially patent at high concentrations.
We have performed the yeast comet assay to investigate the antigenotoxic/genotoxic effects of PEE. When cells were pre-treated with PEE, before H2O2 exposure, we detected a
statistically significant decrease of comet tail length in all concentrations used (Figure 7). On the other hand, in incubation only with PEE, we observed an increase of comet tail length relatively of the control (ethanol) in the concentration of 100 µg/mL (Figure 7). These results, indicating that PEE has antigenotoxic and genotoxic activities, correlate with viability assays, in which protection against oxidative stress and toxicity were detected. We did a complementary experience, using co-incubation, to investigate if PEE protects DNA under oxidative stress with H2O2. Here, again,
PEE displayed an antigenotoxic and genotoxic effect on yeast cells (Figure 9). Tavares et al. (2006) have reported before antigenotoxicity and genotoxicity of hydro-alcoholic propolis extracts from Brazilian propolis in mammalian cells. Our results are in accordance with this study and suggest that Portuguese propolis can have similar biological activities than propolis from South America.
Interestingly, genotoxicity of PEE, in experiments without H2O2 treatment, was higher in
co-incubation than in pre-co-incubation experiments (Figures 7 and 9). This difference can be explained by the experimental design of these experiments, since in pre-incubation, cells were exposed to PEE, washed and incubated with S buffer, while in co-incubation, cells were analyzed with the comet assay immediately after incubation with PEE. Therefore, pre-incubation experiments allow cells to repair DNA damage before application of the comet assay. This argues in favor of an induction of an alert state of cells discussed above for viability assays. In fact here we show that PEE has mild genotoxic activity, which can be a consequence of the prooxidant properties of PEE that promote activation of cellular stress responses. Under these conditions, cells become more prepared to cope with stress leading to improved viability.
Our sample of propolis has a total polyphenolic and flavonoids content relatively close to propolis from Portuguese propolis from Fundão (Moreira et al., 2008), Indian propolis (Laskar et
27
al., 2010) and to Brazilian propolis (Alencar et al., 2007; Mello et al., 2010). However, comparisons should be cautious due to differences between the solvent used for the extracts (different percentages of ethanol) and in the procedure to obtain the extracts. To our knowledge antioxidant activity of PEE (extraction only with ethanol), measured by the DPPH and ABTS assays, has not been reported before. Therefore, comparison, in terms of in vitro antioxidant capacity between Portuguese propolis and propolis from different origins is not possible. Nevertheless, we show evidence suggesting that Portuguese propolis has similar composition in polyphenolols and flavonoids, the phytochemicals with more potential to have biological activity found in propolis. This correlates with the in vitro antioxidant activity and protection against oxidative stress measured in terms of viability and antigenotoxicity.
To detect the intracellular antioxidant activity of PEE in living cells, we used flow cytometry with a redox-sensitive fluorochrome. As expected, cells displayed decrease in intracellular oxidation by incubation with PEE upon oxidative shock (Figure 11). This dose-dependent intracellular antioxidant activity is in accordance with the in vitro antioxidant activity and the protection effect in viability and antigenotoxicity upon oxidative shock.
In this work we present evidence strongly suggesting that Portuguese propolis has antioxidant and prooxidant activity and antigenotoxic and genotoxic activity, which fits in the so-called “Janus” effect. According to this model, substances that has dual effect, one positive and one negative, are “Janus” compounds (von Brostel et al., 1998).
Portuguese propolis had been demonstrate an important significance in medicine, namely in Hereditary spherocytosis (HS) (Moreira et al., 2011), to protect erythrocytes from damage promoted by free radicals and inhibition of human renal cancer cell growth (Valente et al., 2011) and its antioxidant properties could be extensible used mainly in food industry (Moreira et al.,2008; Miguel et al., 2010). However, additional studies are required to complete the evaluation of Portuguese propolis potentials.