Structural and technical changes in
Brazil: an analysis of the declining
coefficients hypothesis from 2003 to
2013
Henrique Morrone
Abstract
The aim of this paper is to investigate the declining coefficients hypothesis for Brazil in the 2003-2013 period and its subperiods. In our estimations, we employed the technical coefficient matrices for the years 2003, 2006, 2008, 2010 and 2013 at constant prices from 2003. These tables were estimated using the technique developed by Guilhoto and Sesso (2005). We applied parametric and nonparametric statistical tests to verify the validity of the declining coefficient hypothesis. The empirical results have supported the declining coefficients hypothesis for Brazil between 2003 and 2013 and its two subperiods (2003-2008, 2006-2010). The subperiod 2008-2013 was marked by a rise in technical coefficients.
Keywords: Structural change. Input-output. Brazil.
Submissão: 02/08/2019. Aceite: 05/09/2019.
PhD. em Economia (Universidade de Utah). Professor adjunto (Universidade Federal do Rio Grande do Sul). E-mail: [email protected]
1. Introduction
One important, somewhat unresolved and partly forgotten question in econo-mics is how technical coefficients evolve over time. Leontief direct technical (input) coefficients’ changes are mainly driven by technical change. Usually these coeffi-cients can be altered by relative price differences, changes in the mix of activities that comprise a given sector (SCHUMANN, 1990), invention of new products, in-creasing imported inputs (or vice versa) and national accounting measurement problems (MILLER; BLAIR, 2009). Despite these several factors that may play a secondary role, technical change is key to explain changes in the Leontief technical coefficient matrix (CARTER, 1970; FORSELL, 1972; SKOLKA, 1989; AROCHE--REYES, 1995). The change in technical coefficients can capture the process of technical change at the mesoeconomic level of analysis.
Multisectoral models can shed some light on the structural and technical change processes. Leontief (1953), Rasmussen (1956), Chenery and Watanabe (1958) are the pioneers in the field. Carter (1970), Forsell (1989), Craven (1983) and more recently Ostblom (1992) and Aroche-Reyes (1995, 2006) provide some of the studies that tackle the question about the trend of technical coefficients chan-ges (the coefficients of the Leontief’s direct input “A” matrix) during the growth of economies.
An economic system might evolve according to two trends (AROCHE-REYES, 2006): (1) a decrease in technical coefficients (that expresses a diminishing need for inputs - that is, an increase in the productivity of inputs, a result of an efficiency gain in the production lines); and (2) increase in technical coefficients (which indi-cates a rise in sectoral interdependence and/or a rise in the intersectoral division of labor) (BERNI, 1999; MILLER; BLAIR, 2009). In this case, gains in productivity are concentrated in productive factors (that is, nonproduced factors such as labor and capital) (AROCHE-REYES, 1995, 2006). This can be a typical case of a rise in vertical integration.
In this paper we employed parametric and nonparametric statistical tests to investigate the hypothesis of declining coefficients for Brazil from 2003 to 2013, when the last upswing in the business cycle occurred. We used the Leontief’s te-chnical coefficients matrix at constant prices of 2003 in our computations. The matrices for the years 2003, 2006, 2008, 2010 and 2013 were estimated using the
an investigation of the declining coefficient hypothesis for Brazil is lacking in the literature.
This article is structured as follows. In section 2, we briefly overview the eco-nomic performance of Brazil during the 2000s. The method and data are displayed in Section 3. Section 4 presents and analyses the results. Section 5 concludes.
2. The Brazilian economy during the 2000s: a
brief review
The Brazilian economy grew vigorously during the 2000s. The economy grew from 2004 to 2010 (per capita GDP rose by 2.8% per year), even after the effects of the great recession of 2008. Nonetheless, despite recovering part of its dynamism, the country grew slower than in 1950-1973 (UNITED NATIONS, 2010).
The external scenario up to 2008 contributed positively to the Brazilian eco-nomic performance. The global economy grew significantly, mainly pushed by two Asian countries: China and India. They have exhibited robust output growth ra-tes. As a result of this process, Brazil benefited from rising exports and booming commodities’ in the early 2000s. The country became less prone to external crises, receiving a substantial amount of foreign direct investment. When the great re-cession unfolded, Brazil had international reserves and hence space to implement countercyclical policies.
An important characteristic of the expansion was the improvement of the in-ternal market containing three essential measures. Firstly, the government foste-red a plan to improve the infrastructure and promote economic development. The objective of the Growth Acceleration Plan (PAC) was to recover the State’s role in planning and coordinating public investments.
Secondly government employed redistributive policies to boost consumption and increase the level of economic activity. The Bolsa Família (a family subsidy programme) and real increases in the minimum wage were applied in the period. Therefore, an improvement in income distribution took place.
Thirdly the credit’s supply increase was crucial with the State-owned banks leading the process. The amount of credit in relation to GDP augmented substan-tially from 2000 to 2014 (MORRONE, 2015; MARQUETTI; HOFF; MIEBACH, 2017).
The unemployment rate fell due to the implemented domestic-market-led po-licies. The growth in formal employment helped in reaching political and social stability (MORRONE, 2015).
Despite the growth achieved, the exchange rate overvaluation has damaged industry’s economic performance. To keep the economy going, the government pro-moted massive tax cuts to selected sectors and stimulated agglomerations. The de-velopment model showed its limit by 2014 and after this date the economy started slowing down. Brazil has embarked into a profound political and economic crisis in 2015.
3. Methodology and Data
This section presents the procedure to test the declining coefficient hypothesis and the dataset. First let us begin showing the methodology. The antecedents of the statistical procedure applied to input-output tables are Ostblom (1992) and Aroche-Reyes (1995, 2006). Next, the data is presented. We employed the Make and Use tables of the official statistical office (IBGE, 2019) as our main data sour-ce to construct the input-output matrisour-ces for Brazil from 2003 to 2013 and its subperiods.
3.1 Method
Leontief’s well known quantitative input-output method was crucial in undes-tanding the structure of economies. He understands structural change as a result of a change in the technical coefficients matrix. His seminal work applied to the american economy from 1919 to 1939, opened new branches for future research (LEONTIEF, 1953). Further studies focused on the quantitative and qualitative aspects of the economic structure. These tried to find the key interindustry links of the economy (e.g, CHENERY; WATANABE, 1958).
Here we are concerned with the tendency of the technical coefficient matrix (A) in the Leontief system to decline as a result of the development of an economy. This section draws heavily on Ostblom (1992) and Aroche-Reyes (1995). Craven (1983) shows mathematically that declining coefficients are necessary to keep an
economy productive over time. In this vein, other studies tried to estimate the changes of those coefficients. However, the results are mixed.
Carter (1970) estimated the change in coefficients for the U.S. in the 1939-1961 period. He found that intermediate inputs tended to increase in this period, diminishing nonproduced inputs (labor and capital) requirements. The rise in economy’s productivity is concentrated in the primary inputs employed. In this sense, he argued that as the economy develops the labor division takes place, in-creasing structural complexity. That is, the productive specialization leads to an increase in intermediate purchases and in technical coefficients. Specifically for the U.S., the input coefficients for the energy and transportation sectors rose over time. Urata (1988) found similar results for the Soviet Union between 1959 and 1972.
Conversely, Ostblom (1992) tested the hyphotesis of declining coefficients in Swedan for 1957, 1975 and 1980. The estimated results showed a declining trend in technical coefficients. Aroche-Reyes (1995) tested the same hypothesis for Mexico from 1970 to 1980, validating the declining coefficients hypothesis. These results indicated a negative change in technical coefficients, confirming his hypothesis.
The method to capture those changes is simple. It consists of separating the changes in gross output between two periods (here hypothetical periods “t” and “n”) into two components: Leontief’s direct input (technical) coefficients change and final demand changes. It can be expressed in the Equation 1 presented below.
Where:
= a gross output column vector in time t;
= a gross output column vector in time n; = the technology direct coefficient matrix (A), i= t, n;
= a final demand column vector, i=t,n.
There is evidence that technical progress is mainly driven by changes in the direct technical coefficient matrix, Leontief “A” matrix (CARTER, 1970; FORSELL, 1972; SKOLKA, 1989). In this sense, changes in final demand would be secondary which poses an important empirical critique for many models that claim the cen-trality of demand.
The statistical tests performed in this study are applied in two versions of the technical coefficient matrix “A”: a complete “A” matrix in its standard form, and one without the main diagonal, as proposed by Leontief (1953). Eliminating the main diagonal allow us to wholly focus on intersectoral relationships. We follow here Aroche-Reyes (1995)’s notation.
The technical change is measured in the following matrix
The procedure to perform the statistical tests consists of finding out if the mean of the difference between matrices (D matrix) is significantly different from zero. In the Leontief version, in which we eliminate the main diagonal, we test if
the mean of otherwise (for i = j). In this
sense, our null hypothesis claims that the mean of the difference matrix (in both versions) is zero, while the alternative hypothesis states that it is different from zero. More details about the statistical model below.
Where stands for the statistical error which follows the classical assump-tions. We test if the mean of differences is equal to zero (s=0) or not (s≠0) in stati-cally terms. In other words, our hypothesis test is:
H0: s = 0
H1: s ≠ 0
In the context of the Brazilian economy, we examine if the mean is different from zero in the 2003-2013 period and its subperiods (2003-2008 and 2008-2013). The period known as “Milagrinho” (In English: Small Miracle) from 2006 to 2010 (CARVALHO, 2018) was also examined to see if it presents better economic num-bers. Below we show the schematic difference matrices for each period analyzed in the next section:
(3)
(4)
In the same fashion, this procedure was applied for the Leontief version wi-thout the main diagonal,
Δ
.After having these difference matrices, the statistical tests to verify if the difference between means is statistically significant at 5% can be performed. In this study, three tests are employed: the well-known parametric “t” test (using the normal approximation for large samples), the Fisher sign test and the Wilcoxon signed rank test. The last two are nonparametric tests, they allow less restrictive assumptions about the errors. They are distribution free tests and they focus on the median. These tests are the same as the ones applied by Ostblom (1992) and Aroche-Reyes (1995).
3.2 Data
The dataset to build the input-output matrices for 2003, 2006, 2008, 2010 and 2013 comes from the Brazilian Statistical Office. There was a methodological change in the System of National Accounts in 2010 which made comparisons with previous years difficult. To circunvent this problem, we estimated the input-output tables from the Make and Use tables following the procedure developed by Guilho-to and Sesso (2005)1. The Resources and Uses table (containing 107 commodities
and 51 activities) gives the information necessary to built the I-O table at constant prices from 2003. They are domestic tables, separated from imports. The final ma-trices comprise 50 sectors (a total of 2,500 technical coefficients), since we excluded the domestic service activity, an imputed activity in national accounts2. The
ag-gregation of sectors follows the classification employed by the Brazilian Statistical Office. The econometric software Eviews VII was employed in our estimations.
After the construction of the input-output tables, we applied parametric and nonparametric statistical tests to assess the validity of the hypothesis of declining coefficients of the Leontief direct technical coefficient “A” matrix.
4. Results
Tables 1 and 2 report the results for the statistical tests for the 2003-2013 period and its subperiods. Table 1 displays the estimations for the standard “A” matrices which includes the main diagonal. Table 2 exhibits the results for the matrices as suggested by Leontief (1953), that is, netted out of the main diagonal. As mentioned before, this latter table shows the results that focus on interindustry relations only.
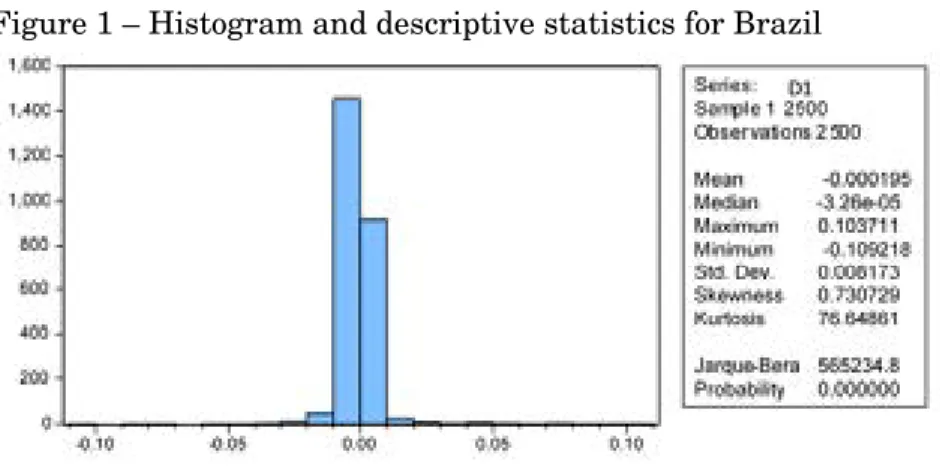
A glance at Table 1 suggests mixed results for Brazil in the aforementioned period. The parametric test indicates that the null hypothesis (the mean of di-fference matrices are equal to zero) cannot be rejected for the 2003-2013 period. It broadly shows the stability of coefficients over time. Usually this test is more efficient than nonparametric tests, although the latter is less restrictive than the former. However the parametric test assumes that the data follows a normal dis-tribution, an hypothesis that is rejected when we look at the Jarque Bera statistic in the appendix. In this case, the nonparametric test is more appropriate and it focuses on the median of the distribution.
The nonparamtric test confirms the thesis of declining coefficients for Brazil. The null hypothesis is rejected at 5% significance level. When performed, the exer-cise seems to corroborate Craven (1983)’s thesis. For a country to remain producti-ve, it has to present declining technical coefficients.
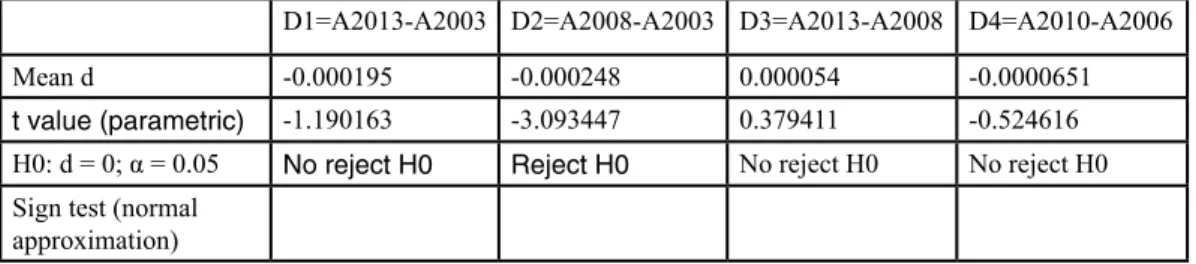
Table 1 – Statistical tests (parametric and nonparametric) for the matrices of differences for Brazil D1=A2013-A2003 D2=A2008-A2003 D3=A2013-A2008 D4=A2010-A2006
Mean d -0.000195 -0.000248 0.000054 -0.0000651
t value (parametric) -1.190163 -3.093447 0.379411 -0.524616 H0: d = 0; α = 0.05 No reject H0 Reject H0 No reject H0 No reject H0 Sign test (normal
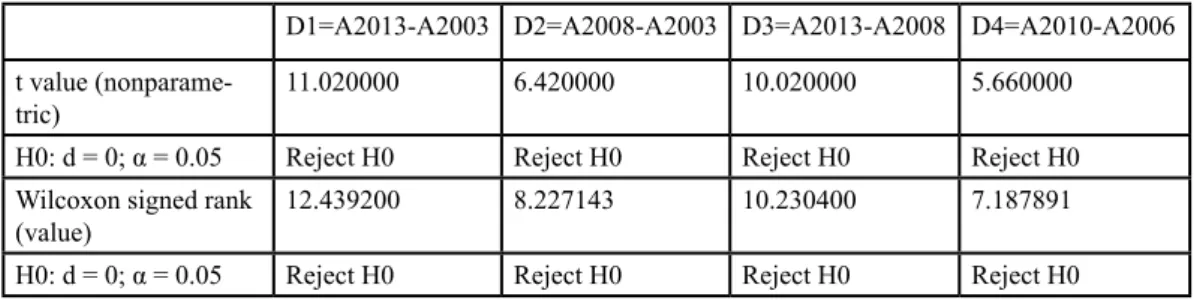
D1=A2013-A2003 D2=A2008-A2003 D3=A2013-A2008 D4=A2010-A2006 t value
(nonparame-tric) 11.020000 6.420000 10.020000 5.660000
H0: d = 0; α = 0.05 Reject H0 Reject H0 Reject H0 Reject H0 Wilcoxon signed rank
(value) 12.439200 8.227143 10.230400 7.187891
H0: d = 0; α = 0.05 Reject H0 Reject H0 Reject H0 Reject H0 Source: author’s elaboration.
Turning to the 2003-2008 subperiod, we found a similar pattern. Technical coefficients decline over time. The parametric and nonparametric tests support our thesis. In the same fashion, we found similar results for the 2006-2010 period. This period is characterized by relatively rapid economic growth in Brazil (CARVALHO, 2018).
For the period between 2008 and 2013, the results indicate a different pat-tern. The coefficients tend to increase in this subperiod. It can reflect a rise in sectoral interdependence, a rise in the intersectoral division of labor or a rise in vertical integration (BERNI, 1999; MILLER; BLAIR, 2009). In this case, gains in productivity are concentrated in nonproduced factors such as labor and capital (AROCHE-REYES, 1995, 2006). Notice that the Brazilian economy slowed its’ eco-nomic growth performance after 2010.
The results presented in Table 2, for the statistical tests that exclude the main diagonal, tend to support the declining coefficients hypothesis3. Overall, technical
coefficients decline during the 2003-2013 period. Both the standard version (with main diagonal) and Leontief’s version (without the matrices’ main diagonal) con-firm the declining coefficients hypothesis.
Table 2 – Statistical tests (parametric and nonparametric) for the matrices of differences (without the main diagonal) for Brazil
Δ1=A2013-A2003 Δ2=A2008-A2003 Δ3=A2013-A2008 Δ4=A2010-A2006
Mean δ -0.000019 -0.000136 0.000117 -0.0000069
t value (parametric) -0.132012 -2.072013 0.873884 -0.058597 H0: δ = 0; α = 0.05 No reject H0 Reject H0 No reject H0 No reject H0 Sign test (normal
approximation) t value
Δ1=A2013-A2003 Δ2=A2008-A2003 Δ3=A2013-A2008 Δ4=A2010-A2006 H0: δ = 0; α = 0.05 Reject H0 Reject H0 Reject H0 Reject H0 Wilcoxon signed
rank (value) 12.136960 7.879283 9.991945 6.877119 H0: δ = 0; α = 0.05 Reject H0 Reject H0 Reject H0 Reject H0 Source: author’s elaboration.
The estimation results therefore, show the validity of the declining coefficients thesis when applied to Brazil. Craven’s (1983) claim that productive economies present declining coefficients seems valid for the Brazilian case. In the 2003-2013 period, Brazil presented a positive economic performance. The exception is the 2008-2013 subperiod, which is marked by difficulties in maintaining the economic momentum, mainly after 2008 (the great recession) and 2010. This period was ma-rked by increasing technical coefficients.
5. Final Remarks
This paper has applied parametric and nonparametric statistical tests to in-vestigate the declining technical coefficients hypothesis for the Brazilian economy from 2003 to 2013. We computed input-output matrices for the years 2003, 2006, 2008, 2010 and 2013 at constant prices of 2003. Applying the tests, we could exa-mine broad patterns of the economy.
The results have confirmed the declining coefficients hypothesis for Brazil in the 2003-2013 period and its subperiods (2003-2008, 2006-2010). The exception is for the 2008-2013 subperiod, when increasing technical coefficients were found. It arguably suggests that periods of difficulties to maintain economic growth are accompanied by increasing technical coefficients for Brazil, although further rese-arch is required to prove it.
The results thus support the declining coefficients thesis for Brazil. Overall, the Brazilian economy presented a positive economic preformance marked by a rise in the productivity of inputs.
Mudanças estruturais e técnicas no Brasil: uma
análise da hipótese de coeficientes declinantes de 2003 a
2013
Resumo
O objetivo deste artigo é investigar a hipótese de coeficientes declinantes para o Brasil no período 2003-2013 e em seus subperíodos. Em nossas estimativas, utilizamos as matrizes de coeficientes técnicos para os anos de 2003, 2006, 2008, 2010 e 2013 a preços constantes de 2003. Essas tabelas foram estimadas utilizando-se a técnica desenvolvida por Guilhoto e Sesso (2005). Foram aplicados testes estatísticos paramétricos e não paramétricos para verificar a validade da hipótese de coeficientes declinantes. Os resultados empíricos confir-maram a hipótese de coeficientes declinantes para o Brasil entre 2003 e 2013 e seus dois subperíodos (2003-2008, 2006-2010). O subperíodo 2008-2013 foi marcado pelo aumento dos coeficientes técnicos.
Palavras-chave: Mudança estrutural. Insumo-produto. Brasil.
Cambios estructurales y técnicos en Brasil: un análisis de
la hipótesis de la disminución de los coeficientes de 2003 a
2013
Resumen
El objetivo de este artículo es investigar la hipótesis de la disminución de los coeficientes para Brasil en el período 2003-2013 y sus subperíodos. En nuestras estimaciones, emple-amos las matrices de coeficientes técnicos para los años 2003, 2006, 2008, 2010 y 2013 a precios constantes a partir de 2003. Estas tablas se estimaron utilizando la técnica de-sarrollada por Guilhoto y Sesso (2005). Aplicamos pruebas estadísticas paramétricas y no paramétricas para verificar la validez de la hipótesis de los coeficientes decrecientes. Los resultados empíricos han apoyado la hipótesis de la disminución de los coeficientes para Brasil entre 2003 y 2013 y sus dos subperíodos (2003-2008, 2006-2010). El subperíodo 2008-2013 estuvo marcado por un aumento de los coeficientes técnicos.
Palabras clave: Cambio estructural. Insumo-producto. Brasil.
Notas
1 For consistency’s sake, we compared our estimations of the IO table for 2010 with the official one. We found that the mean of technical coefficients of the official table was not significantly, in statistical terms, different from the one estimated.
2 The Input-Output table for Brazil contains 50 activities. The sectors of the disaggregated I-O are: agri-culture, forestry, and logging (1), livestock and fisheries (2), oil and natural gas (3), iron ore (4), other mining and quarrying (5), food and beverages (6), tobacco products (7), textiles (8), articles of apparel and accessories (9), leather goods and footwear (10), wood products - furniture exclusive (11), pulp and paper products (12), newspapers, magazines, and discs (13), petroleum refining and coke (14), alcohol (15), chemicals (16), resin manufacturing and elastomers (17), pharmaceutical products (18), pesticides (19), perfumery hygiene and cleanliness (20), enamels varnishes paints and lacquers (21), various che-mical products and preparations (22), rubber and plastic (23), cement and other non- metallic mineral products (24), steel manufacturing and derivatives (25), non- ferrous metallurgy (26), metal products - ex-cept machinery and equipment (27), machinery and equipment including maintenance and repairs (28), appliances and electronic equipment (29), office machines and equipment, and electronic materials (30), automotive manufacturing (31), parts and accessories for motor vehicles (32), other transport equipment (33), furniture and products of various industries (34), production and distribution of electricity gas water sewage and urban cleaning (35), construction (36), trade (37), transport storage and postal services (38), information services (39), financial intermediation, insurance and pension plan, and related services (40), real estate activities and rentals (41), maintenance and repair services (42), accommodation and food services (43), business services (44), commercial education (45), commercial health (46), services rendered to families and associations (47), public education (48), public Health (49), and public administration and social security (50).
3 If the Classical/Marxian approach is employed to separate productive and unproductive sectors - rede-fining the productive boundary for the economy, we can investigate the sensitivity of our results. We separated productive and unproductive activities, following Shaikh and Tonak (1994). In this sense, we excluded from our tables the trade sector (37), financial intermediation, insurance and pension plan, and related services (40), real estate activities and rentals (41), public education (48), public Health (49) and public administration and social security (50). We excluded from the analysis unproductive sectors since they do not create value and many times their numbers are imputed in national accounts (ASSA, 2016). In other words, and in line with Mazzucato (2018), we redefined the productive boundary of the Brazilian economy. The results indicate that the declining coefficients thesis is accepted, i.e.; the null hypothesis that the mean of the difference matrix (from 2003-2013) is equal to zero can be rejected at 5% significance level. This redefined production boundary produces robust results. Both t and sign tests have rejected the null hypothesis. Further details on demand
Referências
AROCHE-REYES, F. Cambio técnico y cambio estructural. La hipótesis de coeficientes decre-cientes. Pruebas estadísticas con datos para México. Estudios Económicos, v. 10, n. 2, p. 147-162, 1995.
AROCHE-REYES, F. Regímines de crecimiento, cambio structural y coeficientes de insumo.
El Trimestre Económico, v. LXXIII (4), n. 292, p. 881-902, 2006.
ASSA, J. The Financialization of GDP and its Implications for Macroeconomic Debates. Working Paper 10/2016 Department of Economics, The New School for Social Research, p. 1-27. 2016. BERNI, D. A. Industrialização e duplo deflacionamento: Uma reavaliação do crescimento dos anos 70. Revista Nova Economia, v. 9, n. 1, p. 9-28, 1999.
CARTER, A. Structural Change in the American Economy. Cambridge: Harvard University Press, 1970.
CARVALHO, L. Valsa brasileira: do boom ao caos econômico. São Paulo: Todavia, 2018.
CHENERY, H.; WATANABE, T. International Comparisons of the Structure of Production.
Econometrica, v. 26, n. 4, p. 487-521, 1958.
CRAVEN, J. Input-Output Analysis and Technical Change. Econometrica, v. 51, n. 3, p. 585-598, 1983.
FORSELL, O. Explaining Changes in Input-Output Coefficients in Finland. In: CARTER, A.; BRODY, A. (ed.). Input-Output Techniques. North Holland, 1972.
FORSELL, O. The Input-Output Framework for Analyzing Transmission of Technical Progress between Industries. Economic Systems Research, v. l, n. 4, p. 429-446, 1989.
GUILHOTO, J. J. M.; SESSO, U. A. Estimação da Matriz Insumo-Produto a Partir de Dados Preliminares das Contas Nacionais. Economia Aplicada, v. 9, p. 1-23, 2005.
INSTITUTO BRASILEIRO DE GEOGRAFIA E ESTATÍSTICA (IBGE). Tabela de Recursos e
Usos. Disponível em:
https://www.ibge.gov.br/estatisticas/economicas/contas-nacionais/9052-sis-tema-de-contas-nacionais-brasil.html?=&t=resultados/. Acesso em: 8 mar. 2019.
LEONTIEF, W. Studies in the Structure of the American Economy. New York: Oxford University Press, 1953.
MARQUETTI, A.; HOFF, C.; MIEBACH, A. Profitability and distribution: the origin of the Bra-zilian political crisis. New Left Review. (Forthcoming). 2017.
MAZZUCATO, M. The value of everything: making and taking in the global economy. New York: Hachette Book group, 2018.
MILLER, R. E.; BLAIR, P. D. Input-output Analysis: Foundations and Extensions. New York: Cambridge University Press, 2009.
MORRONE, H. Assessing the impact of distributive policies on the Brazilian economy using an SCGE model. Economic Systems Research (Print), v. 27, p. 1-18, 2015.
OSTBLOM, G. Parametric and non-parametric tests on technical change for Sweeden. Economic
Systems Research, v. 4, n. 3, p. 235-243, 1992.
RASMUSSEN, P. N. Studies in Intersectoral Relations. Amsterdam: North-Holland, 1956. SHAIKH, A. M.; TONAK, E. A. Measuring the wealth of nations: the political economy of natio-nal accounts. UK: Cambridge University Press, 1994.
SCHUMANN, J. On some basic issues of Input-output economics: Technical structure, pri-ces, imputations, structural decomposition, applied general equilibrium. Economic Systems
Research, v. 2, n. 3, p. 229-239, 1990.
SKOLKA, J. Input-Output Structural Decomposition Analysis for Austria. Journal of Policy
Modelling, v. 11, n. 1, p. 45-66, 1989.
UNITED NATIONS. World Economic Situation and Prospects 2010. New York: UN, 2010. URATA, S. Economic Growth and Structural Change in the Soviet Economy, 1959-72. In: CIAS-CHINI, M. (ed.). Input-Output Analysis. Current Developments. New York: Chapman and Hall, 1988.
Appendix: Statistical Analysis for the difference
matrices
D1=A2013-A2003 D2=A2008-A2003 D3=A2013-A2008 D4=A2010-A2006Figure 1 – Histogram and descriptive statistics for Brazil
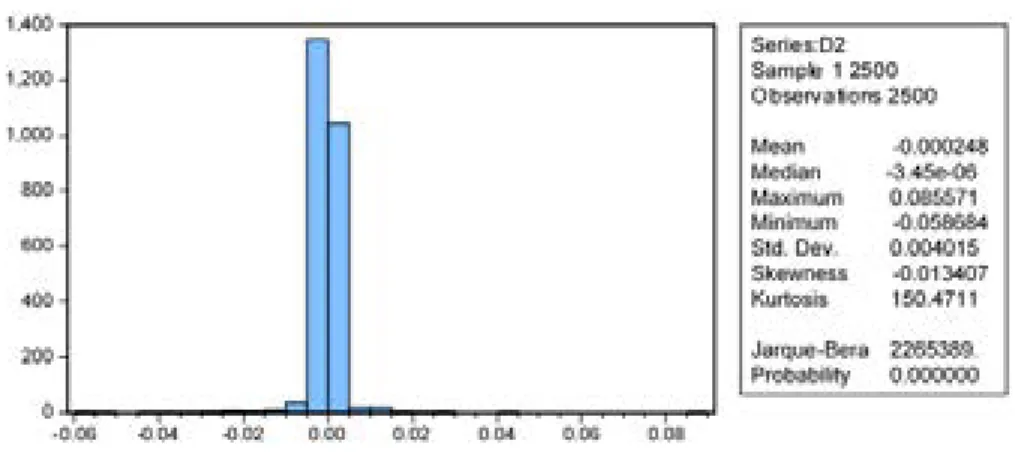
Figure 2 – Histogram and descriptive statistics for Brazil
Source: author’s elaboration. Estimations from Eviews version 7.0.
Figure 3 – Histogram and descriptive statistics for Brazil
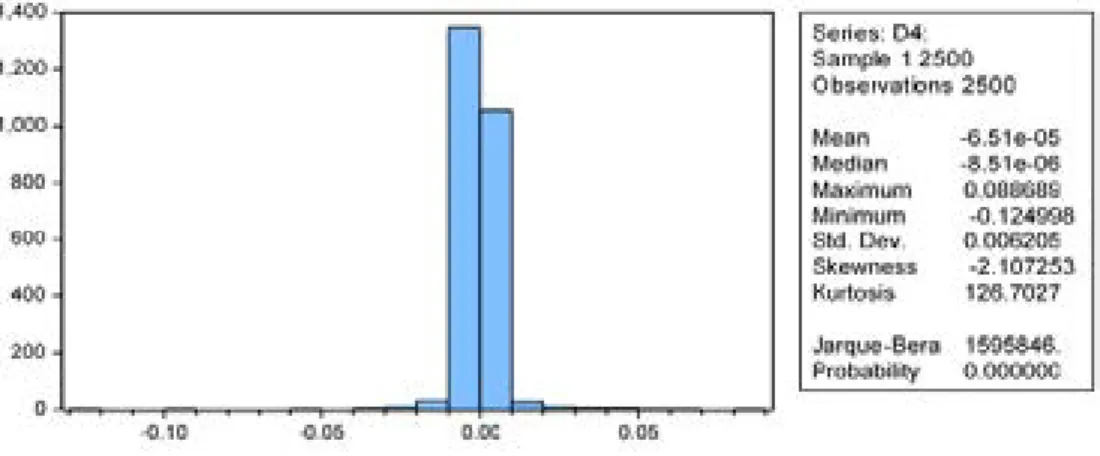
Figure 4 – Histogram and descriptive statistics for Brazil (Var. D4)
Source: author’s elaboration. Estimations from Eviews version 7.0.
Statistical Analysis for the difference matrices (without the main diagonal):
Δ1=A2013-A2003 Δ2=A2008-A2003 Δ3=A2013-A2008 Δ4=A2010-A2006
Figure 5 – Histogram and descriptive statistics for Brazil (Var.
Δ
1)Source: author’s elaboration. Estimations from Eviews version 7.0.
Figure 6 – Histogram and descriptive statistics for Brazil (Variable
Δ
2)Figure 7 – Histogram and descriptive statistics for Brazil (Variable
Δ
3)Source: author’s elaboration. Estimations from Eviews version 7.0.
Figure 8 – Histogram and descriptive statistics for Brazil (Variable