1
M
ASTERF
INANCEM
ASTER´
SF
INALW
ORKDISSERTATION
P
RESIDENTIAL ELECTION AND THE INITIAL PUBLIC OFFERINGPERFORMANCE
:
THE TRUMP CASESARA LUISA MIRANDA DE MENDONÇA E SILVA
2
M
ASTERFINANCE
M
ASTER´
SF
INALW
ORKDISSERTATION
P
RESIDENTIAL ELECTION AND THE INITIAL PUBLIC OFFERINGPERFORMANCE
:
THE TRUMP CASESARA LUISA MIRANDA DE MENDONÇA E SILVA
S
UPERVISION:
MARIA TERESA MEDEIROS GARCIA
3 Acknowledgements
All the effort employed in finishing my Masters Final Work would never be possible without the support and strength given by my close ones.
In the first place, I would like to thank my mother and father, Maria Luisa Miranda and José António Silva, for always trying to give me the best opportunities in life, even when they couldn’t do so, and for teaching me to be resilient and perseverant. Thanks to them i am never allowed to quit, even when I think I could never do something they push me up and help me move on, and I am grateful. I will always try my best to make them as proud of me as I am of them.
To my grandparents, Guiomar e Ramiro, who raised me with so much love and comprehension, I will always look up to you and hope you know, that with all my heart, I feel the most blessed to have you.
To my supervisor, Profª Maria Teresa Garcia, that guided and helped me through it all, always with kind and supporting words, during all the process.
I would like to thank my boyfriend Diogo, for having the patient needed and kindness. Thank you for all the love and motivation from the beginning until the very end.
I thank my closest friends for the advices, patience and reassurance you provided me, when I needed the most.
This dissertation represents the beginning of a new chapter in my life, and, at the same time, a closure. The master in Finance is a representation of the coin a kid puts in a toy machine: it is a life opportunity to chase my dreams and fulfil my life doing what I love, here or in any other part of the world.
I feel happy to say that the product of one of my biggest efforts in life, is represented here. And I never thought I could ever do it.
Thank you to all the people who had an impact on this moment of my life, no matter how small it was, you mattered.
4 Abstract ... 7 Resumo ... 9 1. Introduction ... 11 2. Literature Review ... 12 2.1 Pricing ... 13 2.2 Timing ... 14 2.3 Performance ... 15
2.4 Political and Economic factors ... 16
3. Methodology ... 18 4. Data ... 19 5. Empirical Results ... 23 6. Conclusions ... 28 Appendix ... 31 References... 51
5
Figure 1- CBOE VIX price movements ... 21
Figure 2- S&P500 performance ... 23
Figure 3- Excess return (with and without outliers) ... 24
Figure 4- % Return on Pre-Event ... 25
Figure 5- % Return on Event Widow ... 26
Figure 6- % Return on Post-Event ... 26
Figure 7- % Standard Deviation of IPO stocks VS S&P500 ... 27
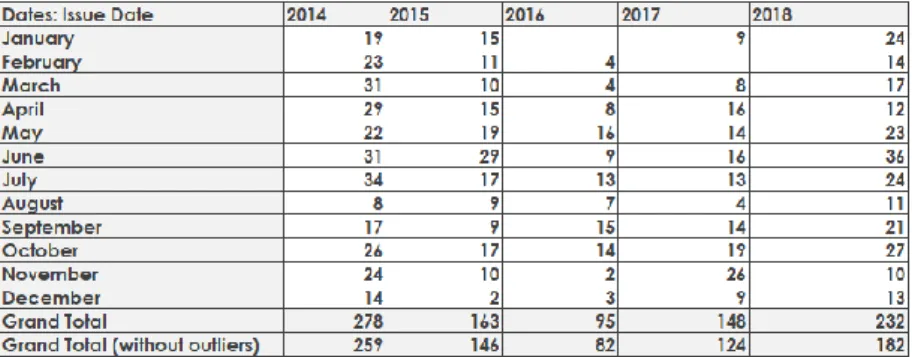
Table 1- Nº IPOs per month (2014-2019) ... 20
Table 2- CBOE VIX historical annual data (Retrieved from: https://www.macrotrends.net/2603/vix-volatility-index-historical-chart ... 22
Table 3- Literature review for theoretical papers ... 31
6 List of Abbreviations
Barack Hussein Obama II – Obama Bureau of Labour Statistics – BLS Buy-and-Hold Abnormal Return BHAR Capital Asset Pricing Model – CAPM Chief Executive Officer – CEO Consumer Price Index – CPI
Cumulative Abnormal Return -CAR Direct Listing Process - DLP Donald J. Trump - Trump
Efficient Market Hypothesis - EMH Initial Public Offering - IPO
Market Capitalization- Market Cap
National Association of Securities Dealers Automated Quotations - NASDAQ New York Stock Exchange - NYSE
Standard & Poors 500- S&P500 United States – U.S.
United States of America - U.S.A. Venture Capitalists – VC
7 Abstract
This study represents my final master's work, specifically my dissertation, which will focus on the Initial Public Offering (IPO). This is an analysis of the impact that certain moments of political and / or economic change may have on the performance of IPOs, specifically examining the election of Donald J. Trump, hereafter referred to as Trump, as President of the United States of America. Since Trump has been the subject of much controversy around the world, largely because of his propensity to create a large-scale impact on society with his methods and ideologies, it will therefore be of tremendous interest and value to my master's degree the study of the influence this will have on the financial market.
My goal is to make a positive contribution to the scientific community by bringing together two distinct realities: the stock market and the political environment. Through the study of the IPOs launched before and after Trump's election, their performance will be the object of study and the main tool to analyze the impact that this moment of economic and political instability, as well as the policies related to the stock market had in it. In order to reach certain conclusions, descriptive statistics were used, as well as a statistical analysis based on the number of IPOs and the average yield of the shares. This analysis is based on definitions inherent in the Event Study, widely used by several renowned authors, namely the concept of event windows, which was very useful in separating the 3 study moments (pre-event, during and post-event).
To determine the relationship between the two realities inherent in the study, a comparison was also made with the best US financial market representative, the S&P500. The results showed that we can reject the hypothesis that there is no difference between the average abnormal return in the period before Trump and after Trump, which indicates the extreme inefficiency of the market for adapting public information.
The years 2015 and 2017 were the most critical in terms of results, showing a peak of the standard deviation of the calculated returns, as well as the volatility index (VIX) and the abnormal return. The analysis shows how impactful Trump's election was in the markets, causing uncertainty and panic moments before taking office in the Senate. This has led to several companies acting out of fear of future uncertainty by anticipating the launch of IPOs in 2014 and 2015 while the effect of abnormal returns explained by the anomaly of
8
the presidential elections was still present, and in that particular period was running the second half of the Obama presidency.
At the beginning of 2017, investors were able to foresee the moments of stress and uncertainty and were afraid to invest, because despite being the year with the largest number of IPOs to be launched, it was also the year when around 20% of IPOs failed, so their price 4 weeks after the IPO was launched was $ 0, thus failing to enter the stock market.
9 Resumo
Este estudo representa o meu trabalho final de mestrado, mais especificamente a minha dissertação, que terá como foco a Oferta pública inicial de ações (IPO). Este consiste na análise do impacto que certos momentos de mudanças políticas e/ou económicas poderão ter na performance dos IPO’s, examinando em concreto a eleição de Donald J. Trump, doravante denominado como Trump, para Presidente dos Estados Unidos da América (EUA). Sendo que Trump tem sido alvo de grande polémica por todo o mundo, muito devido à sua propensão para criar um impacto em grande escala na sociedade com os seus métodos e ideologias, será, portanto, de enorme interesse e valor para o meu mestrado, o estudo da influência que este terá no mercado financeiro.
O meu objetivo é providenciar uma contribuição positiva à comunidade científica ao juntar duas realidades distintas: o Mercado acionista e o Ambiente político. Através do estudo dos IPO’s lançados no momento anterior e no momento posterior à eleição de Trump, a sua performance será o objeto de estudo e a principal ferramenta para analisar o impacto que este momento de instabilidade económica e política, bem como as politicas relacionadas com o mercado acionário tiveram no mesmo.
De modo a chegar a determinadas conclusões, foi utilizada estatística descritiva, bem como foi desenvolvida uma análise estatística, baseada no número de IPO’s e na taxa de rendimento médio das ações. Esta análise assenta em definições inerentes ao Estudo de Evento, largamente utilizado por vários autores de renome, nomeadamente o conceito de janelas de evento, que teve grande utilidade na separação dos 3 momentos de estudo (pré-evento, durante e pós-evento).
Para determinar a interligação entre as duas realidades inerentes ao estudo, foi realizada adicionalmente uma comparação com o melhor representante dos EUA em termos de mercados financeiros, o S&P500. Os resultados mostraram que podemos rejeitar a hipótese de que não há diferença entre o retorno anormal médio no período antes de Trump e depois de Trump, o que indica a extrema ineficiência do mercado à adaptação de informação pública. Os anos de 2015 e 2017 foram os mais críticos em termos de resultados, demonstrando um pico do desvio padrão dos retornos calculados, bem como no índice de volatilidade (VIX) e no retorno anormal.
10
A análise efetuada demonstra o quão impactante foi a eleição de Trump nos mercados, causando incerteza e pânico momentos antes de assumir o cargo no senado.
Este facto fez com que várias empresas tenham agido por medo da incerteza futura, ao antecipar o lançamento de IPO’s nos anos de 2014 e 2015 enquanto ainda estava presente o efeito dos retornos anormais explicados pela anomalia das eleições presidenciais, sendo que nesse período em particular estava a decorrer a segunda metade da presidência de Obama.
No inicio do ano de 2017, os investidores conseguiam antever os momentos de stress e incerteza e demonstravam receio em investir, pois apesar de ter sido o ano com o maior número de IPO’s a serem lançados foi, também, o ano em que à volta de 20% dos IPO’s falharam, pois, o seu preço 4 semanas após o lançamento do IPO atingiu o preço de 0$, falhando assim na sua entrada no mercado de ações.
11 1. Introduction
There has been a lot of research done on Initial Public Offerings (IPO’s). The studies on this type of equity issuance analyses many issues, as follows: the pricing of equity (Nielsson & Wójcik, 2016), the market timing (Blum, 2011), the performance of the IPO (Coakley et al., 2004), and the impact of the political and economic factors (Jensen, 2005), among many other works of reference.
Following the idea that “economic factors such as business cycles, are drivers of IPO volumes” (Subadar Agathee et al., 2012), this work has the objective of studying the performance of the IPOs, specifically the ones launched the moment before a certain change in the economic and political conditions of a country and, the performance of IPOs released after the uncertainty surrounding it it’s over, so that it can be easily understood the impact that the event has on the number of equity issuances and, also, on its return.
The analysis of the performance is made using a 2-year time frame for both samples (pre and post event companies), as it has been the type of methodology used in the literature reviewed when studying this characteristic of the IPO and, of course, due to the proximity of the present (there is no availability of data after the year of 2019).
The methodology used is the statistical analysis, much known in the field of finance for measuring the impact on a firm of the occurrence of a macroeconomic event in its value, the value of its security prices, among many other variables’ worthy of study. (Teixeira et al., 2012)
As a moment of separation between the two samples, it is going to be used the winning of the elections by Donald Trump in 2016, being this such a deep and important mark in the United States (US) and the world history.
The case study will focus on this specific event, and on the influence that the elected has on the IPO price, and its performance. Therefore, this work is an exploration of a political event and of the correspondent financial market adjustment. In the next section (section II) will be presented a basic theoretical guideline, which, along with the literature reviewed, provides the basis for the study that follows. In section III, it is introduced the
12
methodology used to measure the movements of the relevant variables. Section IV explains the data applied to infer the validity of the assumptions assumed, its relevance and impact. Section V shows the outcome of the analysis employed as well as its development. Finally, Section VI provides the conclusion and, Section VII the limitations found throughout the work and suggestions for future research.
2. Literature Review
The subject of IPO tends to have various topics of concern surrounding it. However, many companies and investors still rely on this issuance of equity to ensure their positions and influence in the market. Often, it is suggested that it happens because IPOs come with a lot of benefits such as raising large amounts of money compared to other financing options, the increase of the exposure to the industry and the market, in general, which can be an enhancer of the company’s profits, and additionally gives the company a lower cost of capital.
On the other hand, there are disadvantages of this offering, that are addressed in several papers, namely in Demers (2005), that analyse the IPO failure risk. The most relevant fact shown in this paper, in particular, is the analysis of the IPO failure prediction model that includes firm-specific characteristics that can be associated with the failure of the firm, because it is observed that there are little or no study of this relationship in previous studies.
It was noticed by several researchers that besides the intrinsic factors that can lead to a failure - which is the worst case scenario - there are also many drawbacks of doing an IPO: the high legal, accounting and marketing costs, the propagation of information related to the company to the public and the loss of control. This leads to stronger agency issues and, likewise, the ascending risk of legal and regulatory issues.
Additionally, as the economy is growing without precedents, it rises, also, the availability of new opportunities and substitutes of raising money by this channel, such as:
- Increase of capital achievable to private companies, being this through Venture Capitalists (VC), Angel Investors or Private Equity (Investment banks), depending on the stage of the company.
13
- Mechanisms to enter the market and sell shares to the public without the need of an underwriter, called Direct Listing Process (DLP). DLP is a mechanism in which no new shares are created and only existing, outstanding shares are sold with no intermediaries involved. It is used mainly by companies that cannot afford the fees imposed by underwriters, do not want to issue new shares or are avoiding the obligation of maintaining a lockup period, which is a mandatory condition in IPO’s.
- Private Debt, often requiring the selling of part of the equity stake of the company.
- Revolving Credit Line, if the total capital that the company needs can be acquired, without solvency issues, in smaller parts and periodically.
Amongst many other solutions, like the sell-out of the company, a strategic acquisition or merger, government funding, etc.
Gathering the articles on the topic of IPO, which are described in detail in Tables 4 and 5, it is feasible to reach some main topics that are subject of research and demand highlight:
2.1 Pricing
The main objective of launching an IPO stands on selling equity at the best possible price, using various types of mechanisms, being the Underpricing (Shiller, 1990) one of the most mentioned issues. This deep studied phenomenon happens when the offering price of a stock is lower than its market value, which happens very frequently. This can be either because the market does not have enough information about its peers and it is constrained on providing the correct pricing of the company’s equity (Banerjee, et al., 2016), or on purpose, by signalling the IPO price.
The mechanism mentioned above, usually called “Signaling by Underpricing”, is employed when a company or the underwriter is manipulating the market by leading to a higher demand than it would have happen if the stock were at its fair value. In most cases, in the long term, this drives the value of the IPO to fall drastically, as it is adjusting its price to the demand, sequentially being the reason for a lot of IPO’s to fail.
14
The rationale behind the Underpricing theory changes with time and the circumstances, bringing all types of interesting topics to the surface, such as: the winners curse problem, the dynamic information acquisition, the existence of side payments to the Chief Executive Officer (CEO), amongst others (Loughran & Ritter, 2004).
2.2 Timing
First of all, when planning to issue new equity a company must guarantee that it reconciles all the legal requirements and is fully prepared to embrace it: has a strong management team, good capital structure (Fischer & Pollock, 2004) and chooses an efficient external IPO team. Considering that all the initial requirements are fulfilled and the company structure is ready, it is then favourable to draw the business plan.
Considering that trading is a method that is directly dependent of time, it can be settled, with some certainty, that the imperfect timing of IPO’s is in most cases the reason why they fail, get low valuations and subsequent poor trading volume. As it shall be presumed by the quoted sentence below, timing is almost like playing Russian roulette, as it is never a certain science.
“The lesson from the past 20 years is that trying to time the IPO market can be a risky proposition. Certain indicators can help companies gauge the overall market, but there is no one foolproof measure on which to bet the outcome of the IPO event”
In (Deloitte, 2016)
It is, besides the uncertainty, important to prepare and analyse the market carefully: take into consideration the business cycle, search for any signs of overvaluation to maximize the companies proceeds and take actions when low volatility is encountered to minimize the possible losses (Blum, 2011).
Combined with the thoroughly studied piece of this great engine called the IPO, there are a phenomenon called hot and cold issue markets, mentioned in several renowned works, as of the case of Helwege & Liang (2004) and Yung et al., (2008), encompassed by many others, that are essential on the understanding of the issuance trends the market presents. This circumstance presents the name of hot/cold markets because of the periods of significantly greater/lower numbers of new issues, linked then to higher/smaller average
15
initial returns. To conceive a hot IPO it must be build hype around the IPO, leading investors to the belief that in a short time period there will exist high demand of this equity offering. By the means of behavioural finance, even the most experienced investor can be tempted to bet on the instrument at stake and align with the trend created. This speculation is achieved either during the roadshow, which is an integrant phase of the launch of an IPO, or in some other chosen moment in time.
2.3 Performance
The market presents plenty of metrics used to measure the performance of the IPO, being crucial the understanding of the period to study, in order to choose the adequate methodology.
Assuming that an individual is looking for a long term analysis, the path would be to calculate Buy-and-Hold Abnormal Return (BHAR) and comparing its values to a proxy (See Harjeet S. Bhabra, & Pettway, (2000) and Subadar Agathee et al., (2012)). On the other hand, choosing the short-term window, it is usually recommended to calculate the Cumulative Abnormal Return (CAR), measure defended by FAMA (1998) as the optimal one, either for long or short-term periods. Indeed, it is suggested, that BHAR causes some inaccuracies due to its compounding effect (such effect is not present in CAR as it is merely an arithmetic measure, calculated as the sum of the difference between the logarithms of actual return and expected return).
In some recognized studies the operating performance is the key fact to reach conclusions, as in the paper of Bharat A. Jain & Omesh Kini, (2008), on the grounds that the process of launching new equity to the market involves many changes in the internal structure of the company and a subsequent reformulation of its activities. It occurs that the moments of greater volatility (for example, during the bubble years) point to the influence of both market timing and investor sentiment on long run operating performance (see Coakley et al., 2004).
The primary goal of a well-diversified portfolio is most often to surpass the performance of the main composite indexes: NASDAQ, Dow Jones, and S&P 500. Acknowledging this, the comparison of the stock returns in 4 weeks after the IPO to an index representative of the US market impersonates the performance measure selected to this
16
work, as it is the main function of an index to conduct investment analysis, measure economic trends, and forecast market activity.
2.4 Political and Economic factors
Since political and economic uncertainty generates stock price volatility, its effects on stock prices and output is a good explanation of why stock volatility is highly correlated with output declines. But this is not always the case: situations of crisis and change can lead to an incontestable positive shock on security prices (Ljungqvist & Wilhelm, 2003) and on investment (Atanassov, Julio, & Leng, n.d.), or to a detrimental impact on the market.
As the prices of financial products adjusts according to their exposure to the returns, the impact of state and economic variables is of great interest to analyse (Chen et al., 1986). In a global view, investors are most of the times excited for the election of a new political candidate, overreacting to unexpected news (Bondt & Thaler, 1985). So, contrarilly to what is mentioned in the Efficient Market Hypothesis, investors are affected by cognitive and emotional biases and do not price all publicly known information instantly.
This present study, as mentioned before, focuses on a recent case, the case of Trump elections in the USA that did not present a negative impact on the stock market in the short term, possibly due to its embrace of the corporate tax reform. However, what is good in the short term may not be the best fit in the long run, as shown in Wagner et al., (2017).
In addition, a characteristic worthy of analysis is the political position of this individual, as this has been, in recent studies, correlated with the performance of the stock market (Pierdzioch, 2006). Trump claims himself to be a republican or, by other words, conservative, as he follows mainly the ideas of the right wing: limited government power and, therefore, empowerment of the individual; inexistence of welfare programs; strong military forces; traditional American values - against gay marriage, abortion, communism, and so on.
The former president Barack Obama, on the other hand, represents the democrat party, praising of a modern liberalism, which has as a foundation on social and economic equality, support of minority rights, along with welfare state. One of many policies that
17
support this ideology is the program Patient Protection and Affordable Care Act, mostly known as ObamaCare, which was cancelled by Trump that clearly stated its opposition to this measure.
During the period of study, which is between 2014 and 2019, it is passive of observation two different political parties defended by the elected president at time. Obama with a great impact until 2016 and Trump since 2017, where he took its position in the senate of the USA. This differential is notorious and shown thoroughly in the present work The anomaly representative of the changes that the 4 years of presidency of a new elected has on stock market returns is labelled as the Presidential Election Cycle, concept designed by Yale Hirsch. This trend is often referred in notable works concerning this area of studies and persists in holding its contribute, stating that U.S. stock markets returns are lower in the first year of presidency, also called inaugural year, following the election of a new U.S. president.
“More broadly, these findings seem to fit into a well-known phenomenon called the presidential election cycle, referring to the four years following a new president taking the oath of office. Going back to at least the 1960s, the second half of a president’s term, especially the third year, has almost always outperformed the first half. For the last 14 election cycles, returns in the third year of a term have averaged about 16 percent, double the average during every other year. That means for this year’s election, 2019 should be a good one for investors regardless of how markets react in the coming few days.” – Sturm, R. (2016) In conjunction with what is stated above, when engaging in the subject of political party the repercussions also differ: whether the elected is a Republican as Trump, or a Democrat like Obama. Certifying this discrepancy is Reuters Plus:
“In the first year of a president’s term, the market is up an average of only 2.6% when the new president is a Republican versus a whopping 22.1% when he or she is a Democrat.”
Source: Global Financial Data as of 1/12/2018. S&P 500 Total Return Index from 12/31/1925 — 12/31/2017
A fair generalization of the stock market is that it doesn’t like uncertainty, being this the issue to analyse in my dissertation: Have the elections on the US, that were by far the
18
most controversial ones, caused an impact in the stock market and then on the performance of the IPO’s? Was it a positive or negative impact?
3. Methodology
The theoretical background behind the stock market provides us with three versions of the Efficient Market Hypothesis: the weak; the semi-strong; and the strong form. They all differ by their assumptions of what is implied by the total availability of information. Reflected in the Semi-Strong form hypothesis, which is the focus in this work, is the conception that all information available to the public regarding the prospects of a specific firm shall always be incorporated in the stock price of the security.
In order to analyse the impact of the elections of 2016 in the USA, which represents the event to study, on the pricing and performance of IPO’s, the statistical analysis is crucial and of great importance. This approach is almost always employed in the pursuance of the possible presence of abnormal returns caused by some specific event, within a certain period, which can corroborate or oppose to the Semi-strong of the EMH. If financial markets are efficient, in the sense that information about the future payoffs of the assets are factored in their prices, an event that affect these future payoffs should translate into an immediate repricing, as the semi strong form of the EMH states. The impact of an event can thus be measured by examining security prices surrounding the event.
It is consequently performed descriptive statistics calculations as well as the abnormal return, using S&P500 monthly return mean as the gauge of return on the market portfolio. On the choice of methodology and, according to Pinto (2003), various models can be used in order to calculate the excess return: the mean adjusted return model, the capital asset pricing model – CAPM- or the market adjusted return, being the last one the guideline of this study.
The method of calculation of the abnormal return is through adjusted market returns, given by the simple difference between the return on the stock, called the real return, and the return on the market portfolio, given the same period in time. To model the normal return, this is one of the two most used measures, according to MacKinlay (1997), being assumed a linear stable relationship between the return on the market and the return on the stock with this mensuration criteria.
19
Moreover, and as mentioned before, the descriptive statistics were calculated, specifically the mean monthly and annual return, standard deviation and the variation. The measure for volatility is provided by the standard deviation of returns, as it is a measure of how much values deviates from its average. Lower standard deviations mean the values showed a consistent behaviour, and higher ones exhibit the increase in the variability of the results, in the period at study.
4. Data
The variables used to employ the study of the IPO’s performance were retrieved from Thomson Reuters and include the period from January of 2014 until January of 2019. The timeline is chosen considering the limitation of period after the event took place, since it must end in 2019, as it is the current year.
The event window is from January of 2016 to January 2017, with the 8th of November of 2016 as the event date. It is assumed the election winning as the moment of greater volatility and, accordingly, considered as the key event.
It was considered an event window of a year, in concordance with the vision of several researchers in the same area of studies, as Brown and Warner (1985), Mackinlay (1997) or Pinto (2003), that used longer observation windows – bigger than 1 week, for example - as, for the purpose of the study, there were no intersection of events, thereby no repetition in a short time frame.
As the elections only happen in a 4 year time range (ruling out some exceptions), the event window is assumed to consist in 1 year, as the campaign starts in 2016, Trump won the elections in November of 2016 and, postliminary, assumed the job in the senate of U.S.A. in January of 2017.
The period of study, before the event, is from January 2014 to January 2016 (441 observations) and the post-event window from January 2017 to January 2019 (380 observations).
In this sample are included stocks from New York Stock Exchange (NYSE) and National Association of Securities Dealers Automated Quotations (NASDAQ), as the region of study is the US.
20
It presents a total of 916 IPO’s, and it has reference of its issue date, stock exchange name, security type, business sector,
company name, shares outstanding after IPO, ticker, offer price, stock price 4 weeks after offer and the percentual change offer price to price 4 weeks after offer.
Conclusions of Pastor and Veronesi (2005) include the fact that one of the most important factors in the decision to undergo in an IPO release is the environmental conditions, also affirming that IPO volume declines in bad market situations, since companies prefer to wait for more favourable circumstances. Explanation for the low value of IPOs in 2016 can be largely explained by this theory.
From the IPOs that happened during these 5 years, some of them happened to be unsuccessful, as mentioned by Demers in its popular work “IPO Failure Risk: Determinants and Pricing Consequences” wrote in 2005, so it was made an exclusion of these outliers as they deviated the values of the returns negatively.
That being said, IPOs that after 4 weeks of being launched to the market presented a price of zero dollars were ruled out. Stocks that fall to an offer price of 0$ will most probably be delisted by their stock exchange, in a short notice, as they are becoming worthless to investors.
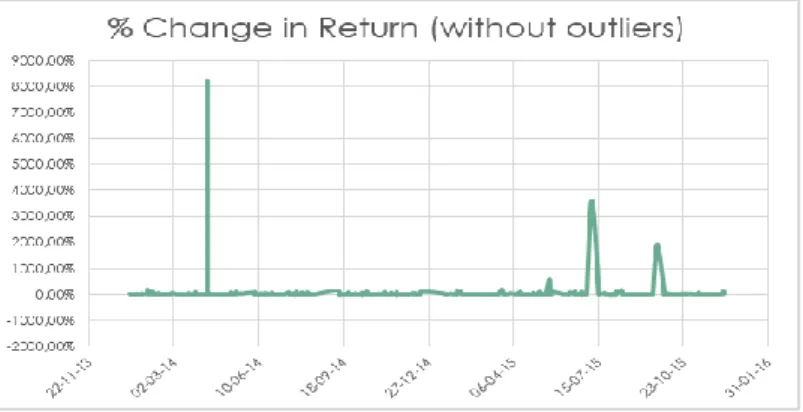
Also, the values that represented exceptional returns (bigger than 10.000% return) were excluded for the sake of the results, because the extremely big values made the results biased. In this study, these values were only represented by 3 observations in the year of 2014 but had a great impact on the results, as it can be observed in the Figure 5.
As a consequence of this exclusion the total number of IPOs to analyse in the study period dropped from 916 observations to 793.
21
In the observations regarding the period before the event and, grouping the year of 2014, with a failure of 16 IPOs, and 2015, where there were 17 observations considered “failure”, we get a number of 33 IPOs that were unsuccessfully conceived.
This cycle went to a drop to 13 in 2016 and, then, an exponential growth to 24 in 2017 up to the total of 50 in 2018, more than doubling its number in the Post-event period. The reason behind these failures is, in most cases, caused by investor sentiment and can have as basis one of many scenarios:
i. Implications from changes in US Trade Policies; ii. Geopolitical tensions;
iii. Stronger regulatory requirements; iv. Monetary policy surprises;
Amongst other possibilities, that create indeed an impact but on a smaller scale.
It can be seen a clear rise in the failure of IPOs throughout the period of study, indicating generally the presence of investor sentiment related to political and economic cycles and because of changes induced by those events.
A measurement of investor sentiment is the Volatility Index (VIX) that is defined as a benchmark index to measure the market’s expectation of volatility in the future.
It is constructed based on options, more specifically on the ones included in S&P500 index, as it is the leadig indicator of the U.S. stock market.
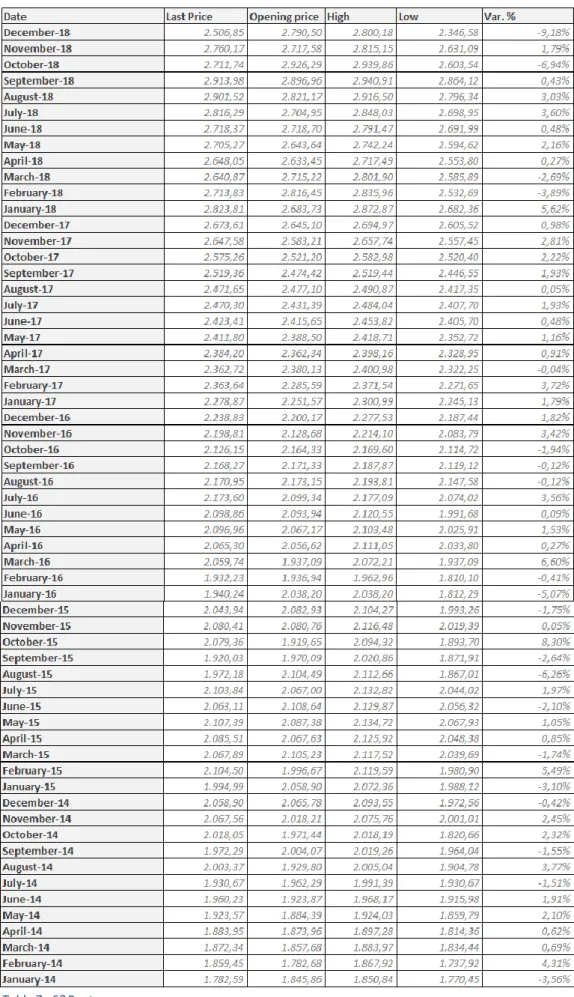
CBOE VIX
22
The main characteristic is that VIX and S&P500 tend to move in opposite directions – VIX rises when equity declines and vice versa. Accordingly, the correlation of VIX and S&P500 is, then, highly negative.
This index is nothing more than the representation of the market’s expectation of 30-day forward-looking volatility.
A study of Baker and Wurgler (2007) considered a clear relationship between investor sentiment and the number of IPOs, concluding that when market sentiment is high, the number of IPOs tend to increase.
Observing the values of VIX under the 3 separate periods of analysis, it can be observed an increase in the index in the year of 2015 – coincident with the announcement of Trump stating its run to presidency – the Pre-event.
In the year of 2016, as it is the event window, until the middle of 2017 the values were the lowest in the period presented, reaching an extreme positive peak in 2017 and 2018 – the Post-event.
To ease the understanding of the peaks mentioned, it is presented Table 2, containing the yearly historical observations of VIX:
The Average Closing Price of the VIX, also referred to as “investor fear gauge”, shows a clear rise during times of financial stress, in this case marked by 2015 and 2018. During these specific periods of market turbulence, the VIX spikes higher, reflecting the investors panic.
This Volatility Index presents its fit to this study for being the sequel of the S&P500 return analysis, as it bases itself on this market index to reach its valuation.
Table 2- CBOE VIX historical annual data (Retrieved from:
23
The values of the S&P 500 index, included in Figure 2, are seized in order to carry out the analysis of the performance, using a proxy of the market portfolio, comparing its values to the studied data of the IPO’s. For guidance, a market proxy is a broad representation of the overall stock market and, specifically, S&P 500, that is constructed based on the market capitalization (referred as Market Cap) of the 500 largest companies traded on the NYSE and NASDAQ stock market exchange, representing the leading industries of the US economy.
Following this structure of data, the companies retrieved for the research launched their IPO’s only in one of these two stock markets. This index is the best-known market proxy for the U.S. stock market, and is preferred as a proxy in this statistical study as many academics and analysts use it for the sake of performing statistical research on stock market behavioural patterns. (See Wong, W., & McAleer, M., 2009)
5. Empirical Results
For the sake of simplicity, are defined four main components that contribute for the conclusions reached: Abnormal Return, Volatility, Level of VIX and Nº of IPOs, the pair of launched IPOs and the “failed” ones.
1. The Abnormal Return, also known as "alpha" or "excess return," is the component of a portfolio return that it can’t be explained by the rate of return of the market. By analysing Figure 3, it is observed a low result value for the period that is ahead of the election winning, which is represented by the event window, and the first two years of
24
presidency what may be assumed as an underperformance of the stock, such results that are consistent with the presidential election anomaly. This anomaly explains also the big values of excess return in the years of 2014 and 2015, correspondent to the second half of the Obama Presidency.
This tool is of great interest as it can be used as a valuation tool and for the matters of comparing returns to market performance.
Using the adjusted market return in this analysis, distinct conclusions can be developed:
i. The underpricing theorem prevails in the year of 2014 and 2015, in a big scale, as it can be observed a % rise in the stock market prices in 4 weeks of an average of 50%. Underpricing, as mentioned in the literature review for being a core topic to discuss, is the practice of listing an IPO at a reduced price, less expensive than what its valuation reveals, on the stock market. At the time the stock closes the day at a price bigger than its offer price, the stock is considered to be underpriced, as can be seen in Figure 4.
ii. In the year of 2016, the event window period, the stocks had positive return comparing with the index S&P500 – as presented Figure 5 - but on a lower level, rising to the theory that the investors became more cautious as the markets were sensing the uncertainty beginning to rise.
25
iii. On the years of 2017 and 208, the IPOs performed in a constant level, with better values than the index used as proxy, but also indicating the negative impact the political event had on the stock market returns.
An important note to take is that the negative variation on returns of the S&P500, as U.S. main index demonstrates bad market conditions.
The % change in return is one of the most useful resources on stocks analysis, as we can clearly see the effects of underpricing, the presence of volatility, amongst many other factors causing a stock not to move linearly.
In the figures below are represented the 3 periods of the statistical study: the Pre-event, Event window and Post-Event, and its subsequent performance, as measured in the terms of the percentual change in returns in 4 weeks time.
Before the elections of Donald Trump, and still under the presidential election anomaly effects of Obama mandate, the excess return of the stocks are on average 50% which indicates that the market was experiencing a great moment.
Allied to that anomaly, may be the announcement on June of 2015 of Trumps Presidential Campaign. This event might make companies to rush into an IPO, taking advantage of the excess returns given by the market and avoiding a launch on 2016, when the scenery might bring up more uncertainty.
This perception is a result of the observation of the returns given by the IPO stocks, besides the conception that it was a riskier time to invest, due to the fact that volatility is, indeed, very high.
26
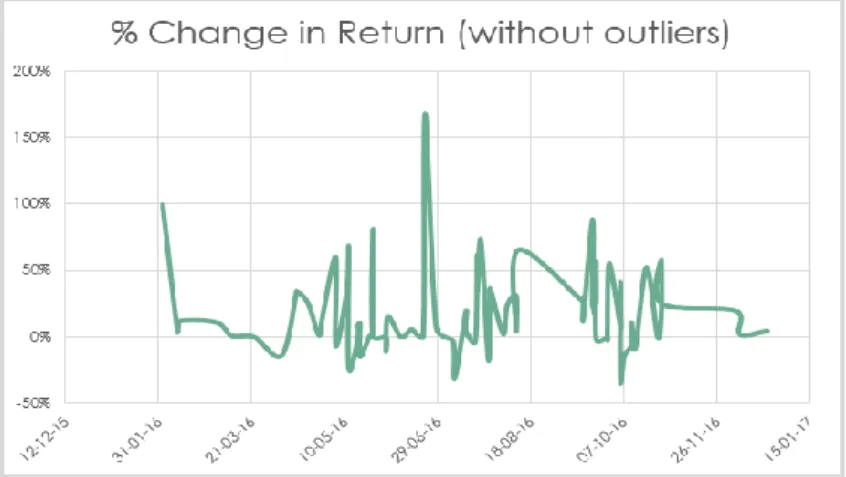
At the Event window moment, which is when the campaign is in course (until November) allied to the moment when Trump won the elections, the stocks move in an unsteady way.
It can be detected a smaller discrepancy in stock prices, as they have a monthly percent price range much different from the ones observed before the event took place. The Abnormal return in this period drops on a big scale, pointing to the uncertainty of the markets.
In the two years following the winning of the elections by President Donald Trump, the monthly return of the IPOs launched is much smaller than the pre-event period, performing in a more steady and stable way.
On Figure 6 it can be observed a smaller price range, as IPOs price dropped and the returns remain on the level of 20%, more or less.
Figure 5- % Return on Event Widow
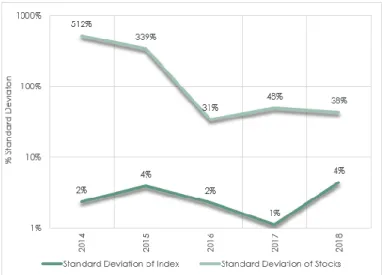
27 2. Volatility and Level of VIX
This two indicators help to build the analysis present in the Risk assessment, being a component of great importance in many sectors of the finance industry, but especially in the investment sector, should it be analysed thoroughly before reaching any conclusions. This area of knowledge relates volatility and relative risk of potential investments that, in this study, helps to corroborate the conclusions made before as the year of 2014 represented higher standard deviation, resulting in high volatility stocks and therefore, investments at that period will be risky.
The greater the standard deviation of the stocks return, the greater the variance between the real price and the mean of prices, leading to a larger price range. In Figure 6, the year of 2015 demonstrated a tremendous drop in the volatility of the stock market in general and, in the year of 2017, in smaller absolute values, leaving, until 2019, the values stable and relatively calm.
The VIX, as shown in Figure 1 had two major peaks in its values, in 2015 and 2018, showing the effect the announcement for the presidentials had in 2015, and in 2018 where the cumulative uncertainty raised by the beginning of the president mandate is incorporated.
In Table 2 is clear the % rise in this fear index of 130,25% , a tremendous indicator of how much market sentiment has risen.
28 3. Nº of IPOs
Last, but not least, the largest number of IPOs in the time period of analysis is in 2014 and 2018, as observable in Table 1. A possible reason for the values of 2014, as talked about before, may be the fact that investors are trying to take advantage of the presidential election anomaly while, at the same time, avoid the uncertainty to come with the arising elections. About the Post-Event period, it reached a high number of IPOs but also had mainly 19% of them failing, a value that was not seen before, for the given time range.
6. Conclusions
The IPO market is somewhat the driver of economic and social growth. For the company as well as for the country where the company employs its activities, the IPO displays the cycle of transformation of value that occurs daily, between companies, the government and individuals.
Donald Trump, besides the fact that is surround with controversy, is a great influencer of the world as he represents the US government after assuming the place of 45º President of the United States of America. The focus on their actions and politic measures led the market to react, and that reaction is the great centre of attention of my study.
Using two samples of companies, it can be seen the pattern between both of the groups of IPOs (Pre-Trump and Post-Trump), and their discrepancies, concluding that the stock market returns under conservative governments, in the US, are lower than under liberal governments – opposed to what happens in Germany, for example, to be examined in (Pierdzioch, 2006). This conclusion is in line with the enlarged volatility of the conservative governments in contrast to the liberal ones (Santa-Clara & Valkanov, 2003), suggesting that IPO’s will perform worst under conservative governments.
In fact, under the presidency of Obama, the return on stocks were bigger, but also its volatility, presuming the markets were experiencing the second half of the presidency anomaly effect. As for the conservative governance of Trump, the volatility was low under the 2 years of analysis - years of 2017 and 2018 - as well as the returns were linear and stable, results coherent with the study mentioned above which states that the
29
performance would be worst under conservative governments than the performance of liberal ones.
The number of IPOs release was the lowest in 2016, defined as the event window, which may be explained by the fear felt by companies of the market conditions, and of the uncertainty to come with the new elections. Investor sentiment tells companies considering going public that it is possible that their valuations will be cut dramatically, given the environment, and they react accordingly.
In 2017/2018 occurs an increase in the IPOs but, also, a large percent of them failing and probably suffering an involuntary delisting – a number of 74 failures in 380 observations, representing a 19% of IPOs who underperformed and, consequently, failed to capture the liquidity expected.
Thus, the portfolio of IPOs analysed showed otherwise, experiencing a peak followed by a dramatic drop in volatility during the year of 2015, and the periods after that remaining in the level of 40% (both 3 years), all in line with the yielded average initial excess return of 20%. The investor sentiment, as demonstrated by VIX, established itself the higher in 2015 and mid of 2017 and 2018, declaring the market panic in these moments of economic and political change.
With this, it may be asserted that Trump indeed had an effect in the stock markets, breaking economic cycles and increasing the uncertainty associated with investments.
7. Limitations and Suggestions for future work
It would be of great interest to confirm the results with diarized data to see a more detailed evolution of the returns.
In addition, it would be alluring, also, to perform an analysis of a longer period, to infer if the long-term performance is coherent with the short-term analysis performed in this work. The anomaly of the presidential elections could serve as a groundwork and be analysed, in favour of the specific case of the president Donald Trump if, in the present, it were 2021. This individual analysis would contribute with an authentication or disapproval of the anomaly provided by market historian Yale Hirsch.
30
Reuniting the data of the year of 2019 and 2020, to infer if the two last years of its presidency, would follow the path that the theory of the presidential election anomaly predicts - subsequent greater performance of the stock market returns on the second half of the mandate.
Doing an IPO analysis per industry would give suggestions about intrinsic characteristics of each industry and its fragility to a political or economic matter. As each policy has its particular return (being it positive or negative), there is always disparity in the reaction of each sector of activity.
As happened in several research papers mentioned in Tables 4 and 5, in (Wong, W., & McAleer, M., 2009), given the period chosen to carry out the study, of over 50 years, it makes perfect sense to adjust the prices of the index of S&P500 to inflation, using the Consumer Price Index (CPI) adjustment.
In future studies, it would add value to the researching society, the enlargement of the period of the study and to do as well a Consumer Price Index (CPI) adjustment of the prices of the financial instruments taken into account, so that the results would be more realistic and accurate.
This economic indicator relates all the consumer goods and services and calculates a weighted average of all the predetermined basket of good that an individual consumer regularly would consume. The values must be taken of the U.S. Bureau of Labor Statistics (BLS), in the case of U.S. prices, as this institution reports the CPI on a monthly basis, since 1913.
It was thought of being of unsubstantial importance, in this research paper, the type of adjustment illustrated, because of the reduced years of analysis.
Finally, to ensure the conclusions took here are only connected to the event, and act as consequences of it, a statistical model with control variables would be necessary, in order to isolate the variables that could act as developers of the market movements observed, as well as the usage of the correct periods of analysis for it to fit in the characterization of an Event Study.
31 Appendix
32
Variable Variable Conclusions Hot and cold IPO
markets: The case of the Stock Exchange of Mauritius (Subadar Agathee et al., 2012) Mauritia 1989-2010 Regression; Multivariate logit; Dummy “HOT”; BHAR; Long-run performance Short run underpricing; Market performance prior to the issue; Industry
clustering dummy; Aftermarket risk
level of the IPO; Annual turnover of
the firm; Long run performance of IPOs; Cross section
variance of IPO returns; Aftermarket risk level of the IPO; Ex-ante financial strength; Stockbrokers reputation; Auditor’s reputation; Dummy variable for
The hot issuance phenomenon is not a key driver in explaining the short run underpricing or the long run performance of IPOs. This
conclusion can be accepted for the specific case of the Stock Exchange of Mauritius.
33
the hot issue periods; Volume of IPO’s; Industry Dummy; Proximity and IPO underpricing (Nielsson & Wójcik, 2016) US 1986-2014 Multivariate regression Cumulative returns across different time periods; Underpricing Geographical characteristics of firms; Firm and IPO
characteristics; IPO characteristics;
Underwriter reputation; No. of bookrunners; Proceeds; venture capital backing; Population; Expert employment; Expert density
The evidence suggests that the proximity gives the investors a stronger incentive to watch more carefully their basket and, also, that companies like this obtain IPO prices closer to their post-IPO values. Leaders and followers in hot IPO markets (Banerjee et al., 2016) US 1975-2012 OLS regression models R (% change between offer price and first trading day closing price);
Dummies: “E”, “Age”, “Tech”, “Bubble”, “VC”, “Penny”, “Spinoff”, “RIBO”, “UW”, “L”, and “Financial”; Market; Early movers experience a higher level of underpricing compared to late
34 Change in Capital expenditures; Change in sales; Change in level of EBITDA; Price-to-value ratios Overhang; Revision; Industry Beta; Price-to-value ratios; ln(Net sales); Long term debt as a % of total assets in year-1; Long term capital expenditures as a % of total assets in year-1; ln(1+Age). movers regardless of whether suitable competitors are already in the market or not (it could have been explained by the difficulty of finding peers). IPO Prospectus Information and Subsequent Performance (Harjeet S. Bhabra, & Pettway 2000) Various 1987-1991 Logistic regressions
BHAR LTD/TA; LOG(ASSETS);
PPE/TA; RD/SALES; OIBD/TA; TA/SALES; FCF; UWRANK-CM; SECDOFF; UNDPRC; RISKFCTR; RELSIZE; The information referent to the offering is, in fact, more useful when one wants to measure subsequent performance than the firm characteristics
35 (information from the prospectus). Post-IPO operating performance, venture capitalists and market timing (Coakley et al., 2004) UK 1985-2000 Cross section Regression Change in operating cash flows deflated by total assets from the fiscal year preceding the IPO.
Dummy variable “VC”, “UNDERWRITER”, “DIR” and “VCREP”; AGE; MARKETCAP; NOVC; VCSTAKE0; VCFUND; FIRST DAY RETURN;
TURNOVER/ASSETS; EBIT/ASSETS;
The idea that poor-quality IPOs taken public during the period of bubbles (example of 1998-2000) lead companies to a sharp fall in operating cash flow over assets, is confirmed in this work where the significant
operating declines are concentrated exactly in this period.
36 Economic Forces
and the Stock Market (Chen et al., 1986) US January 1953- November 1983 Cross- sectional regression analysis Asset returns for the month
Estimates of exposure (betas) As stock returns are exposed to constant news regarding several aspects (economic, political, firm-specific news), doubts could exist about the
accordance between the news and the adjustment of prices to them. It is concluded that these financial instruments are priced in
accordance and, additionally, it was observed that facts like the
37 asset-pricing theories of Merton [1973], Cox et al. [1985], or the APT [Ross 1976], are all in line with the results presented in the current paperwork. Effects of social
capital and power on surviving transformational change: the case of initial
Public offerings (Fischer & Pollock, 2004)
US 1992 Logit models IPO firm
failure
Founder-CEO presence; CEO ownership; VC ownership concentration; Average management team tenure; Deal network embeddedness; Companies that have valuable internal capital enhances the management team effectiveness, the stream of information among its
members and has as a foundation high management
38
team possession. This great factor contributes to management’s ability to lead the company through the period
following its IPO, as it can enhance its inside qualities, leading it to success. Initial Public
Offerings in Hot and Cold Markets (Helwege & Liang, 2004) Various (SDC database) 1975-2000 Multivariate logit analysis Whether the firm experienced “hot” initial returns or “cold” initial returns
IPO characteristics; Firm financial characteristics; Other firm characteristics
Some of the theoretical
conclusions found with the presented analysis is that hot market IPOs have higher valuations and higher institutional
39
ownership than the cold market IPOs. This gives a basis for the conclusion that “hot market” can be redefined as periods when investors are more motivated to purchase IPO stocks, rather than the usual definition IPO Pricing in the Dot-Com Bubble (Ljungqvist & Wilhelm, 2003) Various January 1996- December 2000 OLS; Median regressions; Probit regressions; 2SLS Initial return; Price revision
Dummy variables for high-tech, internet firms and bubble years (1999-2000); Pre-IPO ownership; Insider sales at IPO; Firm and Offer characteristics
The enormous pricing of IPOs in the dot com bubble is possibly explained by several factors: high visibility, changes in the
pre-40
IPO ownership structure and, also, the insider selling behavior. It is concluded that all the facts presented above led to the observed anomalous pricing behavior. IPO Timing Determinants (Blum, 2011) US (SDC database) 1990-2010 Time series Regression; Cross-sectional Regressions IPO volume; Average Proceeds; Amount of proceeds Recession Dummy; GDP growth; VIX; Valuation Confidence; Crash Confidence; Excess Reserves; Interest rate; US population; Revenues; Debt; VC; Assets before offering; Net income
The results exhibited that companies, much more in 2010 than in the past years (given the recent recession), choose to go public only due to the lack of funding. The optimal scenario,
41 in order to maximize the proceeds, should be to organize and time an IPO carefully, watching the business cycle, volatility of the market and its valuation. Politics and the
Stock Market: Evidence from Germany (Pierdzioch, 2006) Germany 1960-2002 Popularity functions; VAR models Nominal returns; Real returns; Excess returns
“Crash” dummy It is suggested that stock market returns are higher under conservative than under liberal governments, unlike what
happens in the US. There is,
42
evidence of election cycles in the returns of the stock market. The Bright Side
of Political Uncertainty: The Case of R&D (Atanassov et al., n.d.)
US 1976-2013 Regression R&D Intensity Election dummy variable Through the examination of the impact that an exogenous increase in political uncertainty can have on R&D investment, it is concluded that firms react to this increase by increasing the level of investment in R&D.
43 Company Stock
Price Reactions to the 2016 Election Shock: Trump, Taxes and Trade (Wagner et al., 2017) Russell 3000 constituents as of the day of the election. September 30, 2015 to September 30, 2016 OLS regression; Cross section of returns Raw returns, CAPM-adjusted and Fama-French-adjusted returns
Market value of equity; Percent revenue growth; Profitability; Cash ETR; GAAP ETR; NOL DTA in percent of MVE; DTL in percent of MVE; Net DTL in percent of MVE; Percent revenue from foreign sources; Percent profits from foreign activities; Foreign operations in percent of assets; Percent foreign assets; IRFE in percent of MVE; Leverage; Interest expense in percent of assets; Capital
expenditures in percent of assets
The analysis of the results given by cross-section of stock returns demonstrated expectations of a corporate tax cut, giving extreme concern of US companies that had employed business in a long time by the usage of a significant level of foreign exposure. It can be concluded that the Trump election and the early days of the
44 affected the relative health of corporations. The U.S. Presidency and the Stock Market: A political relationship study of the market performance (Valadez, 2012) US 1948-2012 Descriptive Statistics S&P500 returns Political Party of Presidents In this study is analysed the presidential cycle anomaly, and it is concluded that, in fact, there is difference in returns between different presidents on the first and second year, unlike in the term years where there are no significant differences in the return of S&P500.
45 Market
Responses to Politics – The rise of Lula and the decline of the Brazilian stock market (Jensen, 2005) Brazil 7th March 2002 - 5th October 2002 ARCH; GARCH The log difference of the daily Morgan. Stanley Capital International Brazil index
Presidential candidates Throughout the analysis of the stock market, it can be observed a clear rise in the uncertainty (shown by the high volatility) concerning the Brazil’s future. This, however, did not signal an exact decline. IPO timing determinants: Empirical evidence on the polish capital market (Meluzin, Zinecker, & Kovandova, 2013) Poland Subsample A: 2007-2009; Subsample B: 2007-2010 Survey analysis; M-V chi-square test; Mann-Whitney U-test
IPO timing Macroeconomic growth; Stock markets expansion due to optimistic mood among investors;
Conditions in the issuer’s business sector; Investors’ interest in this type of business; Interest in IPOs
Stock market conditions, conditions in the business sector and investors interest in the business sector identifies as main
46
by other companies in the same business sector; Interest in IPOs by companies in other business sectors; Current need for capital to finance further company growth.
factors observed in order to determine the perfect timing to execute an IPO.
IPO Failure Risk: Determinants and Pricing Consequences (Demers, 2005) US (SDC New Issues database) January 1985-December 2000 BHAR; CAR; Four Factor time series regression; Simple market-adjusted abnormal returns model Failure; Non- failure mv_ipodt; proceeds; NIdummy; logaccumdeficit; RD_TA; age_ipodt; CM_rank; VCdummy; Big8Natl; FirstDayRet; offer_price; IPOmkt30days; leverage; logSGA; grossmargin; logrd; logsales;
Analyzing the firm characteristics, it can be observed a clear association between them and the IPO failure within the 5 years post-IPO, arising a clear differentiation of the results between non-tech, high-tech and high-tech and
47
internet. The accounting basis on intangible assets was the great
differentiator. Why has IPO
underpricing changed over time? (Loughran & Ritter, 2004) US 1980-2000 Univariate sorts; Regression; First day return;
Tech Dummy, Log Age, Pure Primary Dummy, Share Overhang, Log Market/Sales,
Prestigious Underwriter Dummy, Price Revision, Lagged 15-day Nasdaq Return, Time-Period Dummies
As time passes by, the environment also changes bringing several new explanations towards the use of underpricing in IPO’s. Three theories are discussed and related to the ongoing years: the changing risk composition hypothesis, the
48 realignment of incentives hypothesis, and the changing issuer objective function hypothesis. A conclusion that some other topics had raised in importance, such as analyst
coverage and side payments is reached, as the older theories lack support nowadays.
49 Table 4- Literature review for empirical papers
50
51 References
Atanassov, J., Julio, B., & Leng, T. (2019). The Bright Side of Political Uncertainty : The Case of R & D. Available at SSRN: https://ssrn.com/abstract=2648252
Baker, M., & Wurgler, J. (2002). Market timing and capital structure. Journal of Finance, 57(1), 1–32. https://doi.org/10.1111/1540-6261.00414
Ball and Brown COMPLETAR
Banerjee, S., Güçbilmez, U., & Pawlina, G. (2016). Leaders and followers in hot IPO markets. Journal of Corporate Finance, 37, 309–334. https://doi.org/10.1016/j.jcorpfin.2016.01.004
Binder, R., Steiner, P., & Woetzel, J. (2002). A new way to measure IPO success. McKinsey on Finance, (3).
Blum, R. (2011). IPO Timing Determinants.
Werner F. M. De Bondt, & Thaler, R. (1985). Does the Stock Market Overreact? The Journal of Finance, 40(3), 793-805. doi:10.2307/2327804
Chen, Nai-Fu & R. Roll, Richard & Ross, Stephen. (1986). Economic Forces and the Stock Market. The Journal of Business. 59. 383-403. 10.1086/296344.
Coakley, Jerry & Hadass, Leon & Wood, Andrew. (2004). Post-IPO Operating Performance, Venture Capitalists and Market Timing. SSRN Electronic Journal. 10.2139/ssrn.623227.
Deloitte. (2016). Private company IPOs : Is timing everything ?
Demers, E. & P. Joos. (2005). IPO Failure Risk: Determinants and Pricing Consequences. Working Paper, University of Rochester.
Fischer, H. M., & Pollock, T. G. (2004). Effects of social capital and power on surviving transformational change: The case of initial public offerings. Academy of Management Journal, 47(4), 463–481. https://doi.org/10.2307/20159597
Helwege, J., & Liang, N. (2004). Initial Public Offerings in Hot and Cold Markets. Journal of Financial and Quantitative Analysis, 39(03), 541. https://doi.org/10.1017/S0022109000004026
Jensen, N. M., & Schmith, S. (2005). Market Responses to Politics: The Rise of Lula and the Decline of the Brazilian Stock Market. Comparative Political Studies, 38(10), 1245–1270. https://doi.org/10.1177/0010414005279790
Ljungqvist, A., & Wilhelm, W. J. (2019). American Finance Association IPO Pricing in the Dot-Com Bubble Author ( s ): Alexander Ljungqvist , William J . Wilhelm and Jr
52
. Published by : Wiley for the American Finance Association Stable URL : https://www.jstor.org/stable/3094556 IPO Pricing in the, 58(2), 723–752.
Loughran, T., & Ritter, J. (2004). Why Has IPO Underpricing Changed over Time?
Financial Management, 33(3), 5-37. Retrieved from
http://www.jstor.org/stable/3666262
Meluzin, T., Zinecker, M., & Kovandova, S. (2013). IPO timing determinants: Empirical evidence on the polish capital market. Acta Universitatis Agriculturae et Silviculturae
Mendelianae Brunensis, 61(7), 2499–2506.
https://doi.org/10.11118/actaun201361072499
Nielsson, U., & Wójcik, D. (2016). Proximity and IPO underpricing. Journal of Corporate Finance, 38, 92–105. https://doi.org/10.1016/j.jcorpfin.2016.03.012
Döpke, Jörg & Pierdzioch, Christian. (2006). Politics and the Stock Market : Evidence from Germany. European Journal of Political Economy. 22. 925-943. 10.1016/j.ejpoleco.2005.11.004.
Shiller, R. J. (1990). Speculative Prices and Popular Models. Journal of Economic Perspectives, 4(2), 55–65. https://doi.org/10.1257/jep.4.2.55
Subadar Agathee, U., Brooks, C., & Sannassee, R. V. (2012). Hot and cold IPO markets: The case of the Stock Exchange of Mauritius. Journal of Multinational Financial Management, 22(4), 168–192. https://doi.org/10.1016/j.mulfin.2012.06.004
Wagner, A., Zeckhauser, R. J., & Wagner, A. (2017). Company Stock Reactions To the 2016 Election Shock: Trump, Taxes and Trade. SSRN Electronic Journal. 10.2139/ssrn.2913148.
Yung, C., Çolak, G., & Wei Wang. (2008). Cycles in the IPO market. Journal of Financial Economics, 89(1), 192–208. https://doi.org/10.1016/j.jfineco.2007.06.007
Sturm, R. (2016, November). What we can learn from market’s reaction to a President Trump. The Conversation, Retrieved from http://theconversation.com/what-we-can-learn-from-markets-reaction-to-a-president-trump-68116
There’s no preferred political party for stocks. (2019, June). Reuters Plus. Retrieved from https://www.reuters.com/article/idUSWAOA2EM09A74196D
Wong, W., & McAleer, M. (2009). Mapping the presidential election cycle in US stock markets.Mathematics and Computers in Simulation, 79 (11), 3267-3277. https://doi.org/10.1016/j.matcom.2009.05.007
53
Teixeira, Elisa & Barbosa, Francisco & Souza, Antônio. (2012). Análise do desempenho de longo prazo de Initial Public Offerings no mercado acionário brasileiro. Revista de Ciências da Administração. 14. 10.5007/2175-8077.2012v14n33p79.