SECOND PROOF
RESEARCH ARTICLE OPEN ACCESS
Whole-plant mineral partitioning during the reproductive
development of rice (Oryza sativa L.)
Raul A. Sperotto1, Marta W. Vasconcelos2, Michael A. Grusak3, and Janette P. Fett4,*
1Centro Universitário UNIVATES, Centro de Ciências Biológicas e da Saúde (CCBS), Programa de Pós-Graduação em Biotecnologia (PPGBiotec). Lajeado, RS 95914-014. Brazil 2Universidade Católica Portuguesa, CBQF, Laboratório Associado, Escola Superior de Biotecnologia. Rua Arquiteto
Lobão Vital, Apartado 2511, Porto 4202-401. Portugal 3Baylor College of Medicine, USDA/ARS Children’s Nutrition Research Center, Dept. Pe-diatrics. 1100 Bates Street, Houston, TX 77030. USA 4Universidade Federal do Rio Grande do Sul, Centro de Biotecnologia, Dept. Botânica. Caixa
Postal 15005, Porto Alegre, RS 91501-970. Brazil
Instituto Nacional de Investigación y Tecnología Agraria y Alimentaria, O.A., M.P. (INIA)
Abstract
Minimal information exists on whole-plant dynamics of mineral flow. Understanding these phenomena in a model plant such as rice could help in the development of nutritionally enhanced cultivars. A whole-plant mineral accumulation study was performed in rice (cv. Kitaake), using sequential harvests during reproductive development panicle exertion, grain filling, and full maturity stages in order to characterize mineral accumulation in roots, non-flag leaves, flag leaves, stems/sheaths, and panicles. Partition quotient analysis showed that Fe, Zn, Cu and Ni are preferentially accumulated in roots; Mn and Mg are accumulated in leaves; Mo, Ca, and S in roots and leaves; and K in roots, leaves and stems/sheaths. Correlation analysis indicated that changes in the concentrations of mineral pairs Fe-Mn, K-S, Fe-Ni, Cu-Mg, Mn-Ni, S-Mo, Mn-Ca, and Mn-Mg throughout the reproductive development of rice were positively correlated in all four of the above ground organs evaluated, with Fe-Mn and K-S being positively correlated also in roots, which suggest that root-to-shoot transfer is not driven simply by concentrations in roots. These analyses will serve as a starting point for a more detailed examination of mineral transport and accumulation in rice plants.
Additional keywords: elemental analysis; mineral flow; correlation analysis; panicle exertion; grain filling; full maturity. Abbreviations used: FM (full maturity); GF (grain filling); ICP-OES (inductively coupled plasma optical emission spectroscopy);
PE (panicle exertion); PQ (partition quotient).
Authors’ contributions: Conceived and designed the experiments: RAS, MWV, MAG and JPF. Performed the experiments;
acquisition, analysis, or interpretation of data: RAS and MWV. Wrote the paper: RAS. Supervised the work: MAG and JPF.
Citation: Sperotto, R. A.; Vasconcelos, M. W.; Grusak, M. A.; Fett, J. P. (2017). Whole-plant mineral partitioning during the
reproductive development of rice (Oryza sativa L.). Spanish Journal of Agricultural Research, Volume 15, Issue 2, e0802. https://doi. org/10.5424/sjar/2017152-10332
Supplementary material (Table S1) accompanies the paper on SJAR’s website Received: 14 Aug 2016. Accepted: 09 May 2017
Copyright © 2017 INIA. This is an open access article distributed under the terms of the Creative Commons Attribution (CC-by)
Spain 3.0 License.
Funding: HarvestPlus (Agreement 6005-05); Conselho Nacional de Desenvolvimento Científico e Tecnológico (CNPq) and
Coordenação de Aperfeiçoamento de Pessoal de Nível Superior (CAPES) to JPF; and USDA-ARS (Agreement 58-6250-0-008) to MAG.
Competing interests: The authors have declared that no competing interests exist. The contents of this publication do not
necessarily reflect the views or policies of the US Department of Agriculture, nor does mention of trade names, commercial products, or organizations imply endorsement by the US Government.
Correspondence should be addressed to Raul Antonio Sperotto: [email protected], or Janette Palma Fett: [email protected]. br (shared corresponding authors)
Introduction
Plants are the primary source of nutrients for human nutrition. Staple seed crops such as rice (Oryza sativa L.) supply the majority of daily dietary nutrients for billions of people. However, rice has a low density of mineral nutrients, and for those whose diets are high in staple foods, micronutrient malnutrition is widespread (Kumar et al., 2016). To keep up with population
growth and to improve the nutrition and health of rice consumers, the development of high-quality rice varieties becomes increasingly important (Duan & Sun, 2005). Biofortification, which consists of the use of plant breeding and/or transgenic approaches to develop new cultivars with the potential to increase the nutrient concentration of edible portions of crop plants (Sperotto
et al., 2012a), has emerged as one possible solution to
Despite the increasing number of studies about the physiology and regulation of uptake of several minerals from the rhizosphere, such as potassium (Very & Sentenac, 2003), phosphorus (Raghothama & Karthikeyan, 2005), sulphur (Smith et al., 1997; Takahashi et al., 2000), iron (Curie & Briat, 2003), and zinc (Ghandilyan et al., 2006), the lack of knowledge about how minerals are moved into or out of vascular tissues, translocated to vegetative tissues and loaded into seeds is one of the barriers to seed biofortification (Colangelo & Guerinot, 2006; Sperotto et al., 2012a).
Uncovering mineral ion fluctuation in plants is a critical first step towards understanding the processes that regulate the plant’s ion transport and accumulation. These studies involve the quantitative and simultaneous evaluation of the elemental composition of living organisms and the changes in this composition caused by physiological stimuli or developmental stage. In this way, ionomics has the ability to capture information about the mineral state of an organism under different tested conditions (Huang & Salt, 2016).
In this paper, we assessed growth dynamics of the whole plant (panicles, leaves, stems/sheaths and roots) over the period of reproductive development in rice. Leaf tissues were separated into non-flag and flag leaves, due to the known role of the flag leaf in the synthesis and translocation of photoassimilates to the rice seeds (Abou-khalifa et al., 2008), and due to the poorly understood role of each as a source of nutrients to the developing rice seeds (Sperotto et al., 2013). We also describe the accumulation of ten mineral nutrients (Fe, Zn, Cu, Mn, Mo, Ni, Ca, Mg, K and S) in these organs over time. All of these nutrients are essential to plant growth and participate in crucial metabolic pathways. Understanding mineral accumulation in rice organs is the first step to elucidate the puzzle of plant nutrient partitioning.
Material and methods
Plant material and growth conditions
Rice seeds from Kitaake cultivar were germinated in Petri dishes with filter paper for 8 days before being transferred to hydroponic solution. Plants were grown in a controlled environment chamber with 16-h, 20°C day and 8-h, 15°C night at the USDA-ARS Children’s Nutrition Research Center, Houston, TX, USA. Relative humidity was maintained at 50% and photon flux density during the day was about 350
μmol/m2·s, supplied by a mixture of incandescent
bulbs and fluorescent lamps. The standard solution for
hydroponically grown plants contained 1 mM Ca(NO3)2,
3 mM KNO3, 0.5 mM MgSO4, 0.75 mM K2SO4, 0.5 mM
KH2PO4, 25 μM CaCl2, 25 μM MnSO4, 0.5 μM ZnSO4,
0.5 μM CuSO4, 0.5 μM H2MoO4, 0.1 μM NiSO4, 0.1
mM K2SiO3, and 20 μM
Fe(III)-N-(2-hydroxyethyl)-ethylenediamine triacetic acid. Nutrient solutions were buffered with 2 mM MES (2,4-morpholino-ethane
sulfonic acid), pH 5.5, bubbled with O2 and replaced
every three days. Rice organs (panicles, non-flag leaves, flag leaves, stems/sheaths and roots) were collected at panicle exertion (PE, n = 3), grain filling (GF, n = 4), and full maturity (FM, n = 8) (R3, R5 and R9 stages, respectively, according to Counce et al., 2000).
Elemental analysis by Inductively Coupled Plasma - Optical Emission Spectrometry (ICP-OES)
All tissues were harvested and dried in a 60° C oven for 48 h. Dried tissues were ground and 250 mg were predigested overnight in borosilicate glass tubes with
4 mL of redistilled 98.8 % HNO3. One milliliter of
concentrated trace metal grade HClO4 was added to the
predigested tissues and heated at 100° C for 1 h, 150° C for 1 h, 180° C for 1 h and then at 210° C to dryness (1-2 h). Digestions were performed using a heating block (Model 1016, Tecator, Hoganas, Sweden) with an exhaust-collecting manifold. Digests were resuspended
in 15 mL of redistilled 2 % HNO3. Concentrations
of Fe, Zn, Cu, Mn, Mo, Ni, Ca, Mg, K and S were determined by inductively coupled plasma-optical emission spectroscopy (CIROS ICP Model FCE12; Spectro, Kleve, Germany). Tomato leaves and rice flour standards (SRM 1573A and 1568A, respectively; National Institute of Standards and Technology, Gaithersburg, MD, USA) were digested and analyzed along with the rice samples to ensure digestion efficacy. Mineral content was determined by multiplying each sample’s concentration by dry weight.
Partition quotient calculation
To evaluate the partitioning of minerals within a rice plant during its reproductive development, changes in each tissue’s content were normalized to changes in each tissue’s weight, relative to the whole plant. The dry weight of each organ was calculated as a percentage of total plant weight at each time point, and mineral content of each organ was calculated as a percentage of total plant mineral content at each time point. Using these values, the normalized partitioning of each mineral within the plant was calculated by dividing each organ’s percentage mineral content by its percentage dry weight, and multiplying by 100, which we refer to as the partition quotient (PQ), as described by Waters & Grusak (2008).
Statistical analysis
When appropriate, data were subjected to analysis of variance (ANOVA) and means were compared by the Tukey HSD (Honestly Significant Differences) (p ≤ 0.05). The Levene’s test (for homogeneity of variance) was used prior to ANOVA. Data with unequal variances were subjected to Welch analysis and means were compared by the Dunnett-C test. Pearson’s correlation analyses were carried out using two significance levels (p ≤ 0.05 and 0.01). All the statistical analyses were performed using the SPSS Base 19.0 for Windows (SPSS Inc., USA).
Results
Growth dynamics
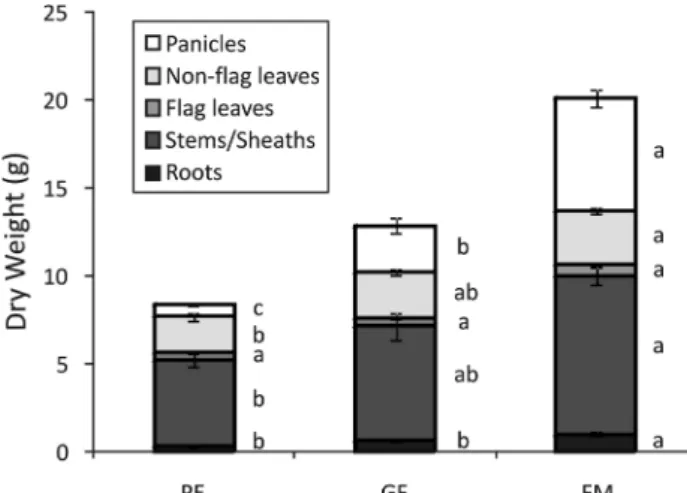
Organ-specific growth dynamics throughout the reproductive development of Kitaake plants are presented in Fig. 1. At all time points, stems/sheaths comprised most of the plant’s mass, with panicles as the second largest organ during GF and FM stages. At the PE stage, a small dry weight of roots and a large dry weight of non-flag leaves and stems/sheaths were observed with a shoot/root ratio of 24.0. Thereafter, the shoot/ root ratios decreased to 18.9 and 18.3 at the GF and FM stage, respectively. At all stages, except PE, flag leaf was the tissue with the lowest mass, with an increase of only 5% from PE to GF and 36% from GF to FM (differences
not statistically significant). Roots and panicles were the tissues with the highest percentage mass increases from PE to GF and from GF to FM stages, with 93 and 61% for roots, and 377 and 240% for panicles.
Mineral accumulation during the reproductive development of rice
Mineral concentrations of certain organs changed substantially during the reproductive development of Kitaake plants. In general, mineral content was closely associated with plant dry weight and accumulated throughout the experiment (Table S1 [suppl.]). Fe concentrations in roots decreased 46% from PE to GF and increased 30% from GF to FM stages. Such decrease in Fe concentration from PE to GF can be explained by an increase in root dry weight (Fig. 1), since Fe content did not change significantly between PE and GF. Both the increases in dry weight (Fig. 1) and Fe concentration are responsible for the increased root Fe content during FM stage (Table S1 [suppl.]). Opposite to roots but similar to each other, panicles, non-flag leaves and stems/sheaths showed a peak in Fe concentrations at GF, then decreased. Fe content mirrored the increase from PE to GF in non-flag leaves and stems/sheaths, then leveled off or increased from GF to FM, but did not decrease as concentrations did. This was particularly notable in panicles where the decrease in Fe concentration from GF to FM was offset by a large increase in dry weight, such that Fe content continued to rise notably throughout the time course. Flag leaf Fe concentration also increased from PE to GF, but then slightly increased again from GF to FM. The increase in Fe concentration combined with little to no increase in dry weight was mirrored with a continuous rise in Fe content over time (Table S1 [suppl.]).
The Zn concentration dynamics showed two different patterns in rice organs. First, in non-flag leaves, stems/ sheaths and roots, an increase in Zn concentrations was detected from PE to GF stages. The decrease in root Zn concentration from GF to FM resulted in no change in root Zn content at the last time point. Non-flag leaves showed similar Zn content dynamics, with increased content only from PE to GF stages (Table S1 [suppl.]). Second, flag leaves and panicles showed no significant increases in Zn concentrations throughout the reproductive development. As a result of slight increases in dry weight and Zn concentration from GF to FM stages (both not statistically significant), flag leaf Zn contents showed a significant increase at the last time point. Due to the high increase in panicle dry weight during the reproductive development of rice (Fig. 1), panicle Zn content increased throughout the experiment (Table S1 [suppl.]).
Figure 1. Dry weight of panicles, non-flag leaves, flag leaves,
stems/sheaths and roots collected during panicle exertion (PE), grain filling (GF) and full maturity (FM) stages of rice plants cultivated with 20 mM Fe(III)-HEDTA. Values are the averages of at least three samples ± SE. Different letters indi-cate that the means (between reproductive stages) are different by the Tukey HSD test (p ≤ 0.05). Error bars may be too small to be visible in the figure.
The Cu concentrations in panicles, non-flag leaves and flag leaves increased from PE to GF then maintained similar values from GF to FM. When combined with consistent increases in dry weight over both time periods, Cu contents in these organs increased throughout the PE to FM stages. Stems/sheaths showed a constant increase in Cu concentration, dry weight, and content throughout the experiment. In contrast, roots showed a 3-fold increase in Cu concentration from PE to GF, followed by a sharp decrease from GF to FM, resulting in no net change in root Cu content (Table S1 [suppl.]).
The Mn concentrations and contents showed a more consistent pattern among the analyzed organs, except for roots. In all organs other than roots, an increase in Mn concentrations from PE to GF was seen, followed by a decrease from GF to FM stages. Roots, in contrast, showed reduced Mn concentrations from PE to GF. In spite of the opposite change in concentrations, due to dry weight increases, Mn contents increased from PE to GF stages in all the five organs (Table S1 [suppl.]).
The Mo concentrations in roots and panicles showed a decrease from PE to GF followed by a slight increase from GF to FM. Stems/sheaths showed a similar increase in Mo concentration from GF to FM; but did not undergo the initial decrease in Mo. In contrast, flag leaves decreased in Mo concentration from PE to GF, while non-flag leaves showed no change in Mo concentration throughout the experiment. In spite of these variable patterns in Mo concentrations between organs, the pattern of Mo content was similar in all the organs analyzed, with an increase from PE to FM stages (Table S1 [suppl.]).
Four out of the five analyzed organs showed the same pattern of Ni concentration and content. Except in flag leaves, all the other organs showed that Ni concentrations and contents increased from PE to GF, then decreased from GF to FM stages. In flag leaves, there was a constant increase in both concentration and content of Ni throughout the experiment (Table S1 [suppl.]).
The macronutrients Ca, Mg, K and S showed similar concentrations and contents dynamics. In non-flag leaves, flag leaves and stems/sheaths, these mineral concentrations and contents tended to increase over the reproductive development. In panicles, only mineral contents increased over the experiment. The same was seen in roots, except for Ca. Roots during GF stage showed extremely low values of Ca concentration and content, with a subsequent increase at the FM stage (Table S1 [suppl.]).
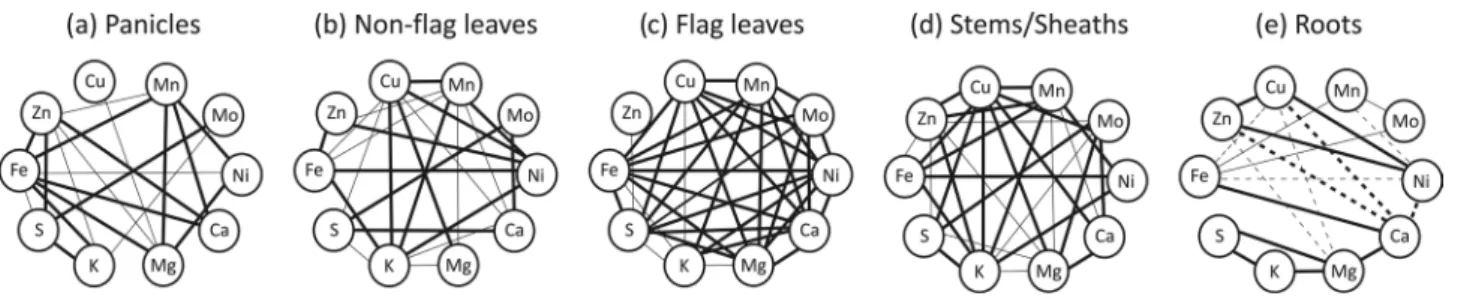
To search for relationships among the ten mineral’s concentrations through the reproductive development of rice plants, Pearson’s correlation analyses were performed for the individual tissues. As seen in Fig. 2c, flag leaf was the organ with the highest number of positive correlations between elements, because most of the minerals showed an increase from PE to GF with little or no increase from GF to FM stages. Zn differed from the other nine elements by showing instead a (non-significant) reduction in flag leaf concentration from PE to GF. Root was the only organ in which negative correlations were found (Fig. 2e). In this organ, Fe was positively correlated with Mn and Mo, and negatively correlated with Cu and Ni. Zn and Cu (positively correlated to each other) were both negatively correlated to Mg and Ca. While several minerals were significantly correlated within each of the five organs, only two pairs of minerals were positively correlated in every organ analyzed: Fe-Mn and K-S, although Fe-Ni, Cu-Mg and Mn-Ni were positively correlated in four of the five organs, but showed a negative correlation in roots (Fig. 2), while S-Mo, Mn-Ca, and Mn-Mg were also positively correlated in all four above-ground tissues, but were not significantly correlated (neither positive nor negative) in the roots.
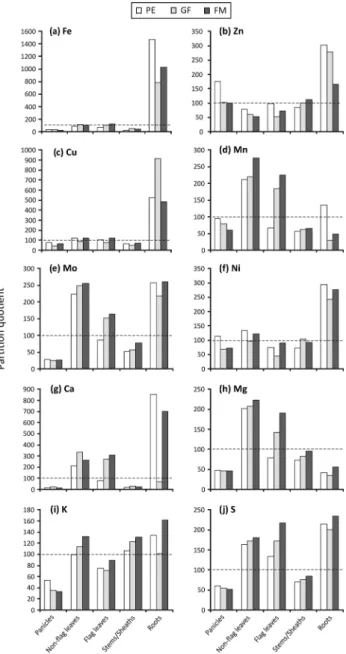
A PQ value, representing the proportional mineral content in an organ relative to the proportional dry weight of that organ, was calculated to allow comparison of the dynamics of partitioning of minerals throughout the reproductive development of rice plants
Figure 2. Pearson’s correlation analysis of ten mineral concentrations in (a) panicles, (b) non-flag leaves, (c) flag leaves,
(d) stems/sheaths and (e) roots through the reproductive development of rice plants cultivated with 20 mM of Fe(III)-HED-TA. Solid lines represent a significant positive correlation and dashed lines represent a significant negative correlation. Thinner lines indicate significance at the 0.05 level and thicker lines indicate significance at the 0.01 level.
regardless of differences in plant size, and to check if the contents of minerals are relatively higher in one specific organ. When the percentage contribution of the organ to the plant’s dry weight is the same as the percentage contribution to the plant’s total content of the mineral being evaluated, the PQ value is equal to 100. As seen in Fig. 3, roots were the organs with the highest PQ values, except for Mn (Fig. 3d) and Mg (Fig. 3h); panicles showed the lowest values, reaching over 100 only for Zn (Fig. 3b) and Ni (Fig. 3f) during the first time point (panicle exertion). PQ for Fe (Fig. 3a) and Cu (Fig. 3c) were similar, with root PQ consistently 5-fold, and as much as 10-fold larger than PQ for all
other organs. For Mn (Fig. 3d), Mo (Fig. 3e), Ca (Fig. 3g), Mg (Fig. 3h) and S (Fig. 3j), PQ values increased during the time periods in non-flag and flag leaves, reaching values > 200, and up to 300 for Ca. Stems/ sheaths PQ values tended to increase throughout reproductive development for almost all the minerals, however, only K had PQ values above 100 at all three time points (Fig. 3i).
Discussion
In this study, we characterized organ-specific changes in dry matter and essential mineral (Fe, Zn, Cu, Mn, Mo, Ni, Ca, Mg, K and S) contents and concentrations to monitor the net flow of minerals into and through the rice plant over reproductive development. Each of these nutrients has a critical function in plants and is required in varying amounts among different plant tissues.
Growth and mineral dynamics - single element
According to our analysis, three different patterns of mineral accumulation could be detected during the rice plant’s reproductive development (Table S1 [suppl.] and Fig. 3). First, Fe, Zn, Cu and Ni were preferentially accumulated in roots. Silveira et al. (2007) also detected higher Fe levels in roots than in shoots of different rice cultivars. Fe is mainly required for photosynthesis, respiration, sulphate assimilation, hormone synthesis, nitrogen fixation, as well as DNA synthesis and repair (Puig et al., 2007; Sperotto et al., 2010). A large portion of the Fe in plants is in the apoplast, particularly in the roots. Most of this apoplastic pool is in the basal roots and older parts of the root system (Römheld & Nikolic, 2007). We found Fe PQ values of about 100 in non-flag and non-flag leaves (Fig. 3a). It is already known that a significant proportion of Fe is also localized within the chloroplast of rapidly growing leaves (Marschner, 1995), mainly as ferritin, which also occurs in seeds, where it can serve as an Fe source that is degraded during germination, as shown in pea (Lobréaux & Briat, 1991). However, in general, concentration of Fe in seeds is lower than in the vegetative organs (Römheld & Nikolic, 2007), corroborating our extremely low Fe PQ values in panicles (Fig. 3a). Under different external Fe supplies, Sperotto et al. (2012b) showed that Fe remobilization from vegetative tissues to the rice seeds can occur, but is greatly dependent on Fe supply. In Fe-sufficient conditions, the seed Fe seems to be largely fulfilled by continuous root uptake and direct xylem transport (Sperotto, 2013), which corroborates the decrease in Fe PQ levels detected in roots from PE to the following stages (Fig. 3).
Figure 3. Partition quotients (PQ) in panicles, non-flag
leaves, flag leaves, stems/sheaths and roots during panicle exertion (PE), grain filling (GF) and full maturity (FM) stages of rice plants cultivated with 20 mM Fe(III)-HED-TA. The dashed horizontal line represents a PQ of 100.
Zn PQ values decreased in roots throughout the reproductive development of rice, along with Zn PQ values from non-flag leaves (Fig. 3b). Under sufficient Zn supply, most of the seed Zn comes from root uptake and direct xylem transport, and is also transported via phloem from leaves and stems/sheaths (Impa et al., 2013). Surprisingly, Zn PQ values increased in stems/ sheaths. There are numerous reports of the temporary accumulation of Zn in stems (Ruano et al., 1987; Simmons et al., 2003). In panicles, Zn PQ values were higher in PE than in GF and FM stages. The highest seed Zn concentration following foliar Zn applications in wheat was reported at the beginning of seed development (around 10 days after anthesis or around the early milky stage), suggesting that applying foliar Zn during early stages of wheat reproductive development could be an effective way of increasing seed Zn concentration through efficient flag leaf export to the grain (Ozturk
et al., 2006). Indeed, it has been shown that high Zn
accumulation during early seed development is possibly related to protein synthesis (Martre et al., 2003). Zinc is a key structural component of a large number of proteins, and the most critical micronutrient affecting protein synthesis in plants (Obata et al., 1999). It has important functions in enzymatic activity, in transcription factors, and is a cofactor in more than 300 proteins (Palmgren
et al., 2008; Ricachenevsky et al., 2015). It is important
to highlight that Zn was the only element with PQ values around 100 in panicles during FM stage. Wu
et al. (2010) showed that large amounts of the Zn in
rice seeds at maturity had been translocated from other plant parts, and not directly acquired by the roots. In addition, Zn from upper leaves can be remobilized to the seeds (Sperotto, 2013), which could explain, at least in part, the decrease in Zn PQ values in roots and non-flag leaves during the reproductive stage (Fig. 3b).
Copper is involved in crucial processes including ethylene perception, cell wall metabolism and oxidative stress protection (Puig et al., 2007). Also, a role for Cu in molybdenum cofactor biosynthesis has been reported (Kuper et al., 2004). Cu has limited transport in plants; therefore, the highest concentration is often in root tissue (Chaignon et al., 2002a,b). Analysis of 16 different forage species revealed that root tissues accumulated the highest Cu concentrations (28.8 mg/ kg), followed by leaves (15.5 mg/kg) and stems (8.4 mg/kg) (Pederson et al., 2002). A similar pattern was found in our work, with concentrations ranging from 40 to 149 mg/kg in roots, 8 to 15 mg/kg in leaves, and 5 to 9 mg/kg in stems/sheaths.
Nickel is very important for certain enzyme activities, maintaining proper cellular redox state and various other biochemical, physiological and growth responses (Yusuf et al., 2011). Also, Ni is part of the active site of
the enzyme urease, which catalyzes the hydrolysis of urea to ammonia and bicarbonate (Polacco et al., 2013). Ni distribution in plants depends on their developmental stage. In accordance with our results in rice, the highest Ni concentrations in roots of Avena sativa were registered at the tillering and booting stages (Andreeva
et al., 2000). Also similar to our results, Dwivedi et al.
(2007) found that most of the Ni was confined to roots in all the three tested rice cultivars, despite the known high mobility of Ni through xylem tissues of shoots and its high transport capacity from root to shoot (Krämer
et al., 1996).
The second pattern of mineral accumulation during the reproductive development of rice was seen for Mn and Mg, which are mostly accumulated in leaves (Table S1 [suppl.] and Fig. 3). Manganese is an essential plant micronutrient with an indispensable function as a catalyst in the oxygen-evolving complex of photosystem II (Schmidt et al., 2016). Mn also serves as a cofactor in essential processes such as photosynthesis, lipid biosynthesis and oxidative stress (Socha & Guerinot, 2014). Mn passively moves from the root to the shoot in the xylem-sap transpirational stream (Ramani & Kannan, 1987). In contrast, re-translocation within the phloem is complex, with leaf Mn being immobile, but root and stem Mn being able to be re-mobilized (Loneragan, 1988), which could explain high Mn PQ values in leaves and low Mn PQ values in roots and stems/sheaths. The net effect of the variable phloem mobility gives rise to a redistribution of Mn in plant parts typical of a nutrient with low phloem mobility (Humpries et al., 2007). Yet, according to Pearson & Rengel (1994), the Mn content of wheat leaves increases throughout grain development, corroborating our data.
Over 300 enzymes are known to be Mg-dependent, and changes in the Mg concentration significantly affects the membrane potential (Kobayashi & Tanoi, 2015), which can disrupt absorption and transport of nutrients. Also, Mg plays a central role in plant chlorophyll biosynthesis and carbon fixation as a cofactor of a series of enzymes involved in carbon metabolism (Guo
et al., 2015). The amount of Mg accumulated differs
among various plant organs, with a tendency towards greater allocation of Mg to transpiring organs such as leaves, rather than to roots (Drossopoulos et al., 1996). In cucumber, Mg concentration was seven times higher in shoots (70 µmol/g fresh weight) than in roots (10 µmol/g fresh weight) (Bengtsson & Jensen, 1983). Yet, Mg accumulation in the younger leaves of cucumber is higher after flowering and fruiting (Bengtsson & Jensen, 1983), which is in accordance to the flag leaf Mg PQ values obtained in our work (Fig. 3h).
The third pattern of mineral accumulation during reproductive development in rice was accumulation in
multiple tissues, as seen for Mo, Ca, and S, which were accumulated in roots and leaves; and K, which was accumulated in roots, leaves and stems/sheaths (Table S1 [suppl.] and Fig. 3). The transition metal Mo is essential for plants as it is required by a number of enzymes that catalyze key reactions in nitrogen assimilation, purine degradation, phytohormone synthesis, and sulfite detoxification. Moreover, a tight connection between Mo and Fe metabolisms is presumed (Bittner, 2014). The allocation of Mo to the various plant organs varies considerably among plant species, but generally the concentration of Mo is highest in seeds (Gupta &
Lipsett, 1981) and in the root nodules of N2-fixing
plants (Marschner, 1995). On the other hand, in crop species such as tomato (Solanum lycopersicum L.), alfafa (Medicago sativa L.), and soybeans (Glycine
max Merr.), Mo concentration in leaves has been found
to exceed the concentration in stems (Gupta & Lipsett, 1981). According to our results (Table S1 [suppl.] and Fig. 3e), one more crop species (rice) can be added to this list.
Calcium is required for structural roles in the cell wall and membranes, as counter-cation for inorganic and organic anions in the vacuole and plays an essential role as intracellular messenger in the cytosol (Marschner, 1995). The concentration of cytoplasmic Ca in plant cells increases in response to various developmental conditions and environmental factors (Hochmal et
al., 2015). Ca concentration, content and PQ values
decreased in roots during grain filling stage (Table S1 [suppl.] and Fig. 3g). Most of this Ca content was probably transported to leaves, which accumulated more Ca during grain filling than during the panicle exertion stage (Fig. 3g). Ca moves readily into transpiring organs such as mature leaves (Clarkson, 1984). On the other hand, Ca xylem transport into organs that do not have a high transpiration rate is low (Kirkby & Pilbeam, 1984).
Sulphur is involved in different functions and aspects of plant metabolism (Briat et al., 2015). Sulphur is a vital component of proteins, due to its presence in the amino acids cysteine and methionine, as well as an active constituent of numerous coenzymes and prosthetic groups, Fe-S centers, coenzyme-A, thiamine, lipoic acid, S-adenosylmethionine, glutathione, and many more (Kopriva et al., 2015). Plant families and species show large variations in S concentration. In general, graminaceous species have lower S levels than dicotyledonous crops. Within each genus, however, species producing S-containing secondary metabolites accumulate more S than those without this capacity. We found higher S concentration in rice roots, although in general, photosynthetically active
leaves show the highest S concentration of all plant organs (Haneklaus et al., 2007).
Potassium is indispensable to plant growth and contributes to the maintenance of membrane potential, ion homeostasis, and osmoregulation (Shin, 2014). It is also involved in enzyme activation, protein synthesis, photosynthesis, and stomatal movements (Luan et al., 2016). It is already known that K is taken up from the soil solution at high rates and is quickly distributed in plant tissues and cell organelles, owing to low- and high-affinity K channels (Glass, 1983). Potassium ions cycle via xylem from roots to upper plant parts and via phloem from leaves to roots. The direction of K movement depends on the physiological demand. However, for optimum grain filling, a high K concentration in leaves is required for the translocation of assimilates to the grains and for protein synthesis in these grains (Mengel et al., 1981).
Most of the mineral concentrations and PQ values decreased in panicles during the reproductive development (Table S1 [suppl.] and Fig. 3). This pattern is seen to varying degrees and is probably related to starch accumulation, which enhances panicle dry weight and dilutes mineral concentrations. It is important to highlight that the mobility of each mineral can certainly affect the remobilization level to developing seeds (Marschner, 1995). However, other factors such as ligation to chelators, number of seeds (sink strength), continued uptake by the roots, and different efficiencies in the use of nutrients (Sperotto, 2013) can influence seed mineral accumulation.
Growth and mineral dynamics - element interactions
It is important to note that several mineral concentrations are influenced by Fe supply in rice plants. Sperotto et al. (2012b) showed that low Fe supply (5 mM) lead to higher accumulation of Zn, Cu and Ni in roots, Mn, Ca, Mg and K in leaves and Zn in stems/ sheaths and a smaller accumulation of Fe, Mn and Ca in roots and Zn and Ni in leaves. On the other hand, high Fe supply (200 mM) promoted higher accumulation of Fe in roots and Zn in leaves, and a smaller accumulation of Fe in leaves and stems/sheaths, and Zn, Cu and K in roots.
Significant correlations were found among the concentrations of ten mineral elements through the reproductive development of rice. In particular, concentrations of Fe-Mn and K-S were positively correlated in every analyzed organ. Fe-Ni, Cu-Mg and Mn-Ni were positively correlated in four of the five organs, showing a negative correlation in roots (Fig. 2). Most of the correlation studies were made in brown or polished grains, instead of vegetative organs. Zeng
et al. (2005) showed a significant positive correlation
between Fe and Mn content in brown rice and Distelfeld
et al. (2007) showed a clear association between Fe
and Mn concentrations in wheat grains. Parida et al. (2003) observed that Fe contents in plants of Trigonella increased with the increase in the Ni concentration applied and Yang et al. (1996) reported a significant negative correlation between Ni concentration in roots and Fe and Mn influx in roots of cabbage (Brassica
oleracea L.) and Mn influx in roots of maize (Zea mays
L.). Zeng et al. (2005) showed a significant positive correlation between Cu and Mg in brown rice. In a study using young spinach (Spinacia oleracea L.), where Cu concentration in nutrient solutions was increased from zero to 10 mg/L, Cu toxicity symptoms did occur, and there was a significant suppression in Mg accumulation in the roots from 372 mg/kg to 203 mg/kg (Ouzounidou
et al., 1998). Sperotto et al. (2012b) reported that Cu
and Mg were positively correlated in four of the five rice organs tested under different Fe supplies. Positive correlation between Fe and Zn concentrations, found in three of the five analyzed tissues (Fig. 2), was previously reported in rice grains by our group (Sperotto et al., 2009).
As previously stated by Baxter et al. (2012), the physiological and molecular drivers of mineral responses and the rules governing the relationship between many elements are far from clear. One method to search for a better understanding of these rules is to look at plant mineral dynamics not only at a whole plant level but also at the individual organ level. This, coupled with studies looking at the expression of genes encoding transporters, channels, chelators and transcription factors, will ultimately reveal the rules that govern nutrient uptake, distribution and storage. Our findings indicate when and where minerals are accumulated in this specific rice cultivar under artificial aerated hydroponic growth conditions during the entire reproductive stage. Correlation analyses are also important to future studies, since they provide information about which minerals show the same concentration pattern during the reproductive stage, which can be useful for future biofortification strategies aiming for simultaneous mineral increases in rice plants.
References
Abou-khalifa AAB, Misra AN, Salem AEAKM, 2008. Effect of leaf cutting on physiological traits and yield of two rice cultivars. Afr J Plant Sci 2: 147-150.
Andreeva IV, Govorina VV, Yagodin BA, Dosimova OT, 2000. Dynamics of nickel accumulation and distribution in oat plants. Agrokhimiya 4: 68-71.
Baxter I, Hermans C, Lahner B, Yakubova E, Tikhonova M, Verbruggen N, Chao DY, Salt DE, 2012. Biodiversity of mineral nutrient and trace element accumulation in Arabidopsis thaliana. PLoS ONE 7: e35121. https://doi. org/10.1371/journal.pone.0035121
Bengtsson B, Jensen P, 1983. Uptake and distribution of calcium, magnesium and potassium in cucumber of different age. Physiol Plant 57: 428-434. https://doi. org/10.1111/j.1399-3054.1983.tb02764.x
Bittner F, 2014. Molybdenum metabolism in plants and crosstalk to iron. Front Plant Sci 5: 28. https://doi. org/10.3389/fpls.2014.00028
Briat JF, Rouached H, Tissot N, Gaymard F, Dubos C, 2015. Integration of P, S, Fe, and Zn nutrition signals in Arabidopsis thaliana: potential involvement of PHOSPHATE STARVATION RESPONSE 1 (PHR1). Front Plant Sci 6: 290. https://doi.org/10.3389/ fpls.2015.00290
Chaignon V, Bedin F, Hinsinger P, 2002a. Copper bioavailability and rhizosphere pH changes as affected by nitrogen supply for tomato and oilseed rape cropped on an acidic and calcareous soil. Plant Soil 243: 219-228. https:// doi.org/10.1023/A:1019942924985
Chaignon V, DiMalta D, Hinsinger P, 2002b. Fe-deficiency increases Cu acquisition by wheat cropped in a Cu-contaminated vineyard soil. New Phytol 154: 121-130.
https://doi.org/10.1046/j.1469-8137.2002.00349.x
Clarkson DT, 1984. Calcium transport between tissues and its distribution in the plant. Plant Cell Environ 7: 449-456.
https://doi.org/10.1111/j.1365-3040.1984.tb01435.x
Colangelo EP, Guerinot ML, 2006. Put the metal to the petal: metal uptake and transport throughout plants. Curr Opin Plant Biol 9: 322-330. https://doi.org/10.1016/j. pbi.2006.03.015
Counce PA, Keisling TC, Mitchell AJ, 2000. A uniform, objective and adaptative system for expressing rice development. Crop Sci 40: 436-443. https://doi. org/10.2135/cropsci2000.402436x
Curie C, Briat JF, 2003. Iron transport and signaling in plants. Annu Rev Plant Biol 54: 183-206. https://doi.org/10.1146/ annurev.arplant.54.031902.135018
Distelfeld A, Cakmak I, Peleg Z, Ozturk L, Yazici AM, Budak H, Saranga Y, Fahima T, 2007. Multiple QTL-effects of wheat Gpc-B1 locus on grain protein and micronutrient concentrations. Physiol Plant 129: 635-643. https://doi.org/10.1111/j.1399-3054.2006.00841.x
Drossopoulos B, Kouchaji GG, Bouranis DL, 1996. Seasonal dynamics of mineral nutrients and carbohydrates by walnut tree leaves. J Plant Nutr 19: 493-516. https://doi. org/10.1080/01904169609365138
Duan M, Sun SSM, 2005. Profiling the expression of genes controlling rice grain quality. Plant Mol Biol 59: 165-178.
Dwivedi S, Tripathi RD, Srivastava S, Mishra S, Shukla MK, Tiwari KK, Singh R, Rai UN, 2007. Growth performance and biochemical responses of three rice (Oryza sativa L.) cultivars grown in fly-ash amended soil. Chemosphere 67: 140-151. https://doi.org/10.1016/j. chemosphere.2006.09.012
Ghandilyan A, Vreugdenhil D, Aarts MGM, 2006. Progress in the genetic understanding of plant iron and zinc nutrition. Physiol Plant 126: 407-417. https://doi.org/10.1111/ j.1399-3054.2006.00646.x
Glass ADM, 1983. Regulation of ion transport. Annu Rev Plant Physiol 34: 311-326. https://doi.org/10.1146/ annurev.pp.34.060183.001523
Guo W, Chen S, Hussain N, Cong Y, Liang Z, Chen K, 2015. Magnesium stress signaling in plant: just a beginning. Plant Signal Behav 10 (3): e992287. https://doi.org/10.416 1/15592324.2014.992287
Gupta UC, Lipsett J, 1981. Molybdenum in soils, plants, and animals. Adv Agron 34: 73-115. https://doi.org/10.1016/ S0065-2113(08)60885-8
Haneklaus S, Bloem E, Schung E, de Kok LJ, Stulen I, 2007. Sulfur. In: Handbook of plant nutrition; Barker AV, Pilbeam DJ (eds.). pp. 183-238. CRC Press, Taylor & Francis Group, Boca Raton, FL, USA.
Hochmal AK, Schulze S, Trompelt K, Hippler M, 2015. Calcium-dependent regulation of photosynthesis. Biochim Biophys Acta 1847: 993-1003. https://doi.org/10.1016/j. bbabio.2015.02.010
Huang XY, Salt DE, 2016. Plant ionomics: from elemental profiling to environmental adaptation. Mol Plant 9: 787-797. https://doi.org/10.1016/j.molp.2016.05.003
Humpries JM, Stangoulis JCR, Graham RD, 2007. Manganese. In: Handbook of plant nutrition; Barker AV, Pilbeam DJ (eds.). pp. 351-374. CRC Press, Taylor & Francis Group, Boca Raton, FL, USA.
Impa SM, Morete MJ, Ismail AM, Schulin R, Johnson-Beebout SE, 2013. Zn uptake, translocation, and grain Zn loading in rice (Oryza sativa L.) genotypes selected for Zn deficiency tolerance and high grain Zn. J Exp Bot 64: 2739-2751. https://doi.org/10.1093/jxb/ert118
Kirkby EA, Pilbeam DJ, 1984. Calcium as a plant nutrient. Plant Cell Environ 7: 397-405. https://doi. org/10.1111/j.1365-3040.1984.tb01429.x
Kobayashi NI, Tanoi K, 2015. Critical issues in the study of magnesium transport systems and magnesium deficiency symptoms in plants. Int J Mol Sci 16: 23076-23093.
https://doi.org/10.3390/ijms160923076
Kopriva S, Calderwood A, Weckopp SC, Koprivova A, 2015. Plant sulfur and Big Data. Plant Sci 241: 1-10. https://doi. org/10.1016/j.plantsci.2015.09.014
Krämer U, Cotter-Howells JD, Charnock JM, Baker AJM, Smith AC, 1996. Free histidine as a metal chelator in plants that accumulate nickel. Nature 379: 635-638. https://doi. org/10.1038/379635a0
Kumar J, Sen Gupta D, Kumar S, Gupta S, Singh NP, 2016. Current knowledge on genetic biofortification in lentil. J Agric Food Chem 64: 6383-6396. https://doi.org/10.1021/ acs.jafc.6b02171
Kuper J, Llamas A, Hecht HJ, Mendel RR, Schwarz G, 2004. Structure of the molybdopterin-bound Cnx1G domain links molybdenum and copper metabolism. Nature 430: 803-806. https://doi.org/10.1038/nature02681
Lobréaux S, Briat JF, 1991. Ferritin accumulation and degradation in different organs of pea (Pisum sativum) during development. Biochem J 274: 601-606. https://doi. org/10.1042/bj2740601
Loneragan JF, 1988. Distribution and movement of manganese in plants. In: Manganese in soils and plants; Graham RD, Hannam RJ, Uren NC (eds.). pp. 113-121. Kluwer Acad Publ, Dordrecht. https://doi.org/10.1007/978-94-009-2817-6_9
Luan M, Tang RJ, Tang Y, Tian W, Hou C, Zhao F, Lan W, Luan S, 2016. Transport and homeostasis of potassium and phosphate: limiting factors for sustainable crop production. J Exp Bot: erw444. https://doi.org/10.1093/jxb/erw444.
Marschner H, 1995. Mineral nutrition of higher plants, 2nd edn. Academic Press, London.
Martre P, Porter JR, Jamieson PD, Triböi E, 2003. Modeling grain nitrogen accumulation and protein composition to understand the sink/source regulation of nitrogen remobilization for wheat. Plant Physiol 133: 1959-1967.
https://doi.org/10.1104/pp.103.030585
Mengel K, Secer M, Koch K, 1981. Potassium effect on protein formation and amino acid turnover in developing wheat grain. Agron J 73: 74-78. https://doi.org/10.2134/ agronj1981.00021962007300010018x
Obata H, Kawamura S, Senoo K, Tanaka A, 1999. Changes in the level of protein and activity of Cu/Zn-superoxide dismutase in zinc deficient rice plant, Oryza sativa L. Soil Sci Plant Nutr 45: 891-896. https://doi.org/10.1080/00380 768.1999.10414338
Ouzounidou G, Ilias I, Tranopoulou H, Karatglis S, 1998. Amelioration of copper toxicity by iron on spinach physiology. J Plant Nutr 21: 2089-2101. https://doi. org/10.1080/01904169809365546
Ozturk L, Yazici MA, Yucel C, Torun A, Cekic C, Bagci A, Ozkan H, Braun HJ, Sayers Z, Cakmak I, 2006. Concentration and localization of zinc during seed development and germination in wheat. Physiol Plant 128: 144-152. https://doi.org/10.1111/j.1399-3054.2006.00737.x
Palmgren MG, Clemens D, Williams LE, Krämer U, Borg S, Schjørring JK, Sanders D, 2008. Zinc biofortification of cereals: problems and solutions. Trends Plant Sci 13: 464-473. https://doi.org/10.1016/j.tplants.2008.06.005
Parida BK, Chhibba IM, Nayyar VK, 2003. Influence of nickel-contaminated soils on fenugreek (Trigonella corniculata L.) growth and mineral composition. Sci
Hort 98: 113-119. https://doi.org/10.1016/S0304-4238(02)00208-X
Pearson JN, Rengel Z, 1994. Distribution and remobilization of Zn and Mn during grain development in wheat. J Exp Bot 45: 1829-1835. https://doi.org/10.1093/jxb/45.12.1829
Pederson GA, Brink GE, Fairbrother TE, 2002. Nutrient uptake in plant parts of sixteen forages fertilized with poultry litter: Nitrogen, phosphorus, potassium, copper, and zinc. Agron J 94: 895-904. https://doi.org/10.2134/ agronj2002.8950
Polacco JC, Mazzafera P, Tezotto T, 2013. Opinion - Nickel and urease in plants: still many knowledge gaps. Plant Sci 199-200: 79-90. https://doi.org/10.1016/j.plantsci.2012.10.010
Puig S, Andrés-Colás N, García-Molina A, Peñarrubia L, 2007. Copper and iron homeostasis in Arabidopsis: responses to metal deficiencies, interactions and biotechnological applications. Plant Cell Environ 30: 271-290. https://doi. org/10.1111/j.1365-3040.2007.01642.x
Raghothama KG, Karthikeyan AS, 2005. Phosphate acquisition. Plant Soil 274: 37-49. https://doi.org/10.1007/ s11104-004-2005-6
Ramani S, Kannan S, 1987. Manganese absorption and transport in rice. Physiol Plant 33: 133-137. https://doi. org/10.1111/j.1399-3054.1975.tb03780.x
Ricachenevsky FK, Menguer PK, Sperotto RA, Fett JP, 2015. Got to hide your Zn away: molecular control of Zn accumulation and biotechnological applications. Plant Sci 236: 1-17. https://doi.org/10.1016/j.plantsci.2015.03.009
Römheld V, Nikolic M, 2007. Iron. In: Handbook of plant nutrition; Barker AV, Pilbeam DJ (eds.). pp. 329-350. CRC Press, Taylor & Francis Group, Boca Raton, FL, USA. Ruano A, Barcelo J, Poshcenrieder C, 1987. Zinc
toxicity-induced variation of mineral element composition in hydroponically grown bush bean plants. J Plant Nutr 10: 373-384. https://doi.org/10.1080/01904168709363579
Schmidt SB, Jensen PE, Husted S, 2016. Manganese deficiency in plants: the impact on Photosystem II. Trends Plant Sci 21: 622-632. https://doi.org/10.1016/j.tplants.2016.03.001
Shin R, 2014. Strategies for improving potassium use efficiency in plants. Mol Cells 37: 575-584. https://doi. org/10.14348/molcells.2014.0141
Silveira VC, Oliveira AP, Sperotto RA, Espindola LS, Amaral L, Dias JF, Cunha JB, Fett JP, 2007. Influence of iron on mineral status of two rice (Oryza sativa L.) cultivars. Braz J Plant Physiol 19: 127-139. https://doi.org/10.1590/ S1677-04202007000200005
Simmons RW, Pongsakul P, Chaney RL, Saiyasitpanich D, Klinphoklap S, Nobuntou W, 2003. The relative exclusion of zinc and iron from rice grain in relation to rice grain cadmium as compared to soybean: Implications for human health. Plant Soil 257: 163-170. https://doi. org/10.1023/A:1026242811667
Smith FW, Hawkesford MJ, Ealing PM, Clarkson DT, VandenBerg PJ, Belcher AR, Warrilow GS, 1997.
Regulation of expression of a cDNA from barley roots encoding a high affinity sulphate transporter. Plant J 12: 875-884. https://doi.org/10.1046/j.1365-313X.1997.12040875.x
Socha AL, Guerinot ML, 2014. Mn-euvering manganese: the role of transporter gene family members in manganese uptake and mobilization in plants. Front Plant Sci 5: 106.
https://doi.org/10.3389/fpls.2014.00106
Sperotto RA, 2013. Zn/Fe remobilization from vegetative tissues to rice seeds: should I stay or should I go? Ask Zn/ Fe supply! Front Plant Sci 4: 464. https://doi.org/10.3389/ fpls.2013.00464
Sperotto RA, Ricachenevsky FK, Duarte GL, Boff T, Lopes KL, Sperb ER, Grusak MA, Fett JP, 2009. Identification of up-regulated genes in flag leaves during rice grain filling and characterization of OsNAC5, a new ABA-dependent transcription factor. Planta 230: 985-1002. https://doi. org/10.1007/s00425-009-1000-9
Sperotto RA, Ricachenevsky FK, Stein RJ, Waldow VA, Fett JP, 2010. Iron stress in plants: dealing with deprivation and overload. Plant Stress 4: 57-69.
Sperotto RA, Ricachenevsky FK, Waldow VA, Fett JP, 2012a. Iron biofortification in rice: it’s a long way to the top. Plant Sci 190: 24-39. https://doi.org/10.1016/j. plantsci.2012.03.004
Sperotto RA, Vasconcelos MW, Grusak MA, Fett JP, 2012b. Effects of different Fe supplies on mineral partitioning and remobilization during the reproductive development of rice (Oryza sativa L.). Rice 5: 27. https://doi.org/10.1186/1939-8433-5-27
Sperotto RA, Ricachenevsky FK, Waldow VA, Müller ALH, Dressler VL, Fett JP, 2013. Rice grain Fe, Mn and Zn accumulation: how important are flag leaves and seed number? Plant Soil Environ 59: 262-266.
Takahashi H, Watanabe-Takahashi A, Smith FW, Blake-Kalff M, Hawkesford MJ, Saito K, 2000. The roles of three functional sulphate transporters involved in uptake and translocation of sulphate in Arabidopsis thaliana. Plant J 23: 171-182. https://doi.org/10.1046/j.1365-313x.2000.00768.x
Very AA, Sentenac H, 2003. Molecular mechanisms and regulation of K+ transport in higher plants. Annu Rev Plant Biol 54: 575-603. https://doi.org/10.1146/annurev. arplant.54.031902.134831
Waters BM, Grusak MA, 2008. Whole-plant mineral partitioning throughout the life cycle in Arabidopsis thaliana ecotypes Columbia, Landsberg erecta, Cape Verde Islands, and the mutant line ysl1ysl3. New Phytol 177: 389-405.
Wu C, Lu L, Yang X, Feng Y, Wei Y, Hao HL, et al., 2010. Uptake, translocation, and remobilization of zinc absorbed at different growth stages by rice genotypes of different Zn densities. J Agric Food Chem 58: 6767-6773. https://doi. org/10.1021/jf100017e
Yang X, Baligar VC, Martens DC, Clark R, 1996. Plant tolerance to nickel toxicity: II. Nickel effects on influx and transport of mineral nutrients in four plant species. J Plant Nutr 19: 265-279. https://doi.org/10.1080/01904169609365121
Yusuf M, Fariduddin Q, Hayat S, Ahmad A, 2011. Nickel: an overview of uptake, essentiality and toxicity in plants. Bull
Environ Contam Toxicol 86: 1-17. https://doi.org/10.1007/ s00128-010-0171-1
Zeng YW, Shen SQ, Wang LX, Liu JF, Pu XY, Du J, Qiu M, 2005. Correlation of plant morphological and grain quality traits with mineral element contents in Yunnan rice. Rice Sci 12: 101-106.