Genomic Prediction of Biological Shape:
Elliptic Fourier Analysis and Kernel Partial
Least Squares (PLS) Regression Applied to
Grain Shape Prediction in Rice (
Oryza sativa
L.)
Hiroyoshi Iwata1*, Kaworu Ebana2, Yusaku Uga3, Takeshi Hayashi4
1Department of Agricultural and Environmental Biology, Graduate School of Agricultural and Life Sciences, University of Tokyo, Bunkyo, Tokyo, Japan,2Genetic Resources Center, National Institute of Agrobiological Sciences, Tsukuba, Ibaraki, Japan,3Agronomics Research Center, National Institute of Agrobiological Sciences, Tsukuba, Ibaraki, Japan,4Agroinformatics Division, National Agricultural Research Center, National Agriculture and Food Research Organization, Tsukuba, Ibaraki, Japan
Abstract
Shape is an important morphological characteristic both in animals and plants. In the pres-ent study, we examined a method for predicting biological contour shapes based on ge-nome-wide marker polymorphisms. The method is expected to contribute to the
acceleration of genetic improvement of biological shape via genomic selection. Grain shape variation observed in rice (Oryza sativaL.) germplasms was delineated using elliptic Fourier descriptors (EFDs), and was predicted based on genome-wide single nucleotide polymor-phism (SNP) genotypes. We applied four methods including kernel PLS (KPLS) regression for building a prediction model of grain shape, and compared the accuracy of the methods via cross-validation. We analyzed multiple datasets that differed in marker density and sam-ple size. Datasets with larger samsam-ple size and higher marker density showed higher accura-cy. Among the four methods, KPLS showed the highest accuraaccura-cy. Although KPLS and ridge regression (RR) had equivalent accuracy in a single dataset, the result suggested the potential of KPLS for the prediction of high-dimensional EFDs. Ordinary PLS, however, was less accurate than RR in all datasets, suggesting that the use of a non-linear kernel was necessary for accurate prediction using the PLS method. Rice grain shape can be predicted accurately based on genome-wide SNP genotypes. The proposed method is expected to be useful for genomic selection in biological shape.
Introduction
Shape is an important morphological characteristic in animals and plants [1]. Shapes of plant organs such as leaves, flowers, and seeds, are key taxonomic characteristics used to classify plant species. In dietary plants, the organ shape is an important characteristic related to the
OPEN ACCESS
Citation:Iwata H, Ebana K, Uga Y, Hayashi T (2015) Genomic Prediction of Biological Shape: Elliptic Fourier Analysis and Kernel Partial Least Squares (PLS) Regression Applied to Grain Shape Prediction in Rice (Oryza sativaL.). PLoS ONE 10(3): e0120610. doi:10.1371/journal.pone.0120610
Academic Editor:Kentaro Yano, Meiji University, JAPAN
Received:August 26, 2014
Accepted:January 29, 2015
Published:March 31, 2015
Copyright:© 2015 Iwata et al. This is an open access article distributed under the terms of the Creative Commons Attribution License, which permits unrestricted use, distribution, and reproduction in any medium, provided the original author and source are credited.
Data Availability Statement:The authors confirm that all data underlying the findings are fully available without restriction. All relevant data are within the paper and its Supporting Information files.
quality and quantity of agricultural products. Therefore, it has remained an important target in plant breeding [2]. For example, in cereal crop plants, grain shape is an important trait that is related to the intended end-usage, consumer’s preference [3], and processing properties such as milling quality [4,5], [6]. Actually, rice grain shape shows wide variation across countries, stemming in part from differences among traditional varieties in numerous local regions [7,8]. Shape varies to such a degree that it affects consumer preferences, influencing the market shares of the respective varieties [9,10]. Because of its importance, the genetic variation in grain shape has been elucidated using bi-parental quantitative trait locus (QTL) mapping [10–
12] and association mapping [13]. Detected QTLs have not been used efficiently in practical breeding, with few exceptions [14], mainly because the grain shape is a quantitative trait con-trolled by several genes that often have complex pleiotropic effects [10]. Tracking a small num-ber of these through DNA markers will only explain a small fraction of the genetic variance [15].
A new breeding method for improving quantitative traits, designated as genomic selection (GS) [16], has increasingly attracted attention in animal [15,17] and plant [18–20] breeding. Most importantly, GS is a technology for selecting individuals and lines without measuring phenotypic data. Instead the genomic potential of individuals and lines is predicted based on genome-wide marker polymorphisms. Then selection is performed on the predicted genetic potential (i.e., genomic prediction). Genome-wide marker polymorphisms can be examined in the early growth stage. Therefore, combined use of GS and rapid generation advancement is ex-pected to boost genetic improvement of domesticated animals [15] and crop plants [18,21]. Because GS uses numerous markers distributed over the whole genome, it is known to be suit-able for the improvement of quantitative traits controlled by numerous QTL. Consequently, GS is expected to be an efficient method for the genetic improvement of quantitative traits.
Motivated by a sense of expectation to the potential of GS in plant and animal breeding, ge-nomic prediction has been applied to various quantitative traits by way of trials and evaluations of its accuracy [22–24]. Genomic prediction, however, has been applied mainly to low-dimen-sional traits. Few attempts have been made to apply genomic prediction to a trait measured as high-dimensional data, such as biological contour shape. Even for simple contour shapes, as those of rice grains, its variation is represented by displacement in thexandycoordinates of grain contours, and show continuous differences among varieties and lines because of the influ-ence of multiple genes that are responsible for grain shape variation and environmental factors that affect the grain shape. Elliptic Fourier (EF) analysis [25], an efficient method for measur-ing contour shape variations, has been applied to various biological shape analyses in plants and animals [1,26]. In the EF analysis, a biological contour shape is described mathematically by Fourier series expansions. Then the coefficients of the Fourier expansions are used as shape descriptors: elliptic Fourier descriptors (EFDs). An important benefit of this method is the ease of interpretation of the analysis results via the visualization of shape variations. For example, the morphological influence of QTL can be represented visually [13]. The visualization ability can be an extremely useful feature in the application of the EF analysis to the genomic predic-tion of a biological contour shape.
In this study, we predict the biological contour shape based on genome-wide single nucleo-tide polymorphisms (SNPs). As a proof-of-concept study, we applied the method to the predic-tion of rice (Oryza sativaL.) grain shape variations. A contour shape of brown rice grain was delineated by EFDs. Then the EFDs were predicted based on genome-wide marker polymor-phisms. We built prediction models using four methods: linear or nonlinear and single-dimen-sional or multi-dimensingle-dimen-sional regression methods. We compared the accuracy of the methods using multiple datasets of rice germplasm collections, which had different characteristics of marker density and sample size. The objectives of this study were (1) to propose a method for
predicting rice grain shape delineated by EFDs based on genome-wide marker polymorphisms, (2) to assess the accuracy of the genomic prediction of rice grain shape, and (3) to ascertain an appropriate method for building a model for predicting rice grain shape. We then discussed the potential of the proposed method for genomic selection of the biological contour shape.
Materials and Methods
Rice germplasm collections and their marker genotypes and grain
images
We used two independent datasets to assess the potential of genomic prediction of rice grain shape. The first one, dataset A, included 179 of the 332 rice accessions that had been selected as representatives of the rice germplasm at the National Institute of Agrobiological Sciences (NIAS) Genebank [27]. The second one, dataset B, contained 386 of the 395 rice accessions that had been used in a study by Zhao et al. [28] to assess genome-wide patterns of polymor-phism, population structure, and the introgression history ofO.sativa. We also analyzed the third one, dataset C, which was a subset of dataset B, used by Zhao et al. [29] to conduct a ge-nome-wide association study using diverse accession ofO.sativa. We used genome-wide SNP marker data and grain image data of the 386 accessions that were available to the public at
http://ricediversity.org/. Information related to the accessions included in datasets A, B and C is presented inS1–S2Tables.
Genome-wide SNP marker data for datasets A, B, and C were collected as described below. For dataset A, the 179 accessions were genotyped with 3,254 SNPs as described by Yamamoto et al. [30], although subsets of the accessions were not typed with all markers: 90 accessions were typed with a set of 3,194 SNPs, 17 with a set of 768 SNPs, and 96 with a set of 765 SNPs. Missing and untyped SNP genotypes were imputed using fastPHASE ver. 1.3 [31] by following the procedures described by Iwata and Jannink [32]. The imputation step was repeated 100 times. The mean imputation scores were obtained by averaging imputed genotypes over the 100 replications, as proposed by Iwata and Jannink [32]. For datasets B and C, we used ge-nome-wide SNP data that were available athttp://ricediversity.org/data/, as described above. For dataset B, we analyzed the genotype data of the 1,311 SNPs that had been genotyped and analyzed by Zhao et al. [28]. For dataset C, we analyzed the genotype data of the 36,901 SNPs that had been genotyped and analyzed by Zhao et al. [29]. For both datasets, we imputed miss-ing genotypes usmiss-ing fastPHASE in the same way as dataset A. The proportions of imputed ge-notypic data were 47.3%, 3.1%, and 4.3%, respectively, for datasets A, B, and C.
Brown rice grain images of the 179 and 386 accessions were collected, respectively, for data-sets A and B. For dataset A, we used the EFD data of the 179 accessions, which had been ana-lyzed an earlier study [13]. The EFDs of six grains were measured and recorded for each accession. For dataset B, we analyzed the digital images of brown rice grains, which were down-loaded fromhttp://ricediversity.org/photolibrary/. The images of four grains were available for each accession. We measured the EFDs of the rice grains using the procedure described in the following section. As described above, dataset C was a subset of dataset B. Therefore, the phe-notypic data collected for dataset B were used also for dataset C.
The datasets used in this study are annexed inS1 Dataset.
Quantitative description of rice grain shape via EFDs
as a sequence ofxandycoordinates of boundary pixels on the contour. Assuming thexandy
coordinates of the pixel at the length of the contourtfrom the arbitrary starting pixel, i.e.,x(t) andy(t), as the coordinates of a particle travelling around the contour at a constant speed 1, the variations ofxandycoordinates became periodic functions oftand were approximated with Fourier series as
xðtÞ ¼a0þ
XN
n¼1
ancos
2npt
T þbnsin
2npt
T
ð1Þ
and
yðtÞ ¼c0þ
XN
n¼1
cncos
2npt
T þdnsin
2npt
T
ð2Þ
wherean,bn,cn, anddn, are Fourier coefficients of thenth harmonic.a0andc0merely depend on the position of the contour and is unrelated to the shape of the contour. Therefore, we ig-nored both coefficients in the following analysis (i.e., replacing both coefficients with 0). In this study, we approximated the contour coordinates of boundary pixels on the contour of a rice grain by the Fourier series with thefirst 20 harmonics (i.e.,N= 20). Error in the Fourier series approximation with thefirstNharmonics was calculated as the proportion of squared displace-ments between observed and approximated contour coordinates to the total sum of squares of the variations of observed contour coordinates.
E2
N ¼ XP
p¼1
ðxp xNpÞ
2
þ ðyp yNpÞ
2
ðxp xÞ
2
þ ðyp yÞ
2
Therein,xpandypare the observed contour coordinates (p= 1, 2,. . .,P),x¼ XP
p¼1
xpand
y¼X
P
p¼1
ypare the coordinates of the centroid of each contour, andxNpandyNpare the
approx-imated coordinates, respectively corresponding toxpandyp. The numbers of pixels (P) differed between grains, depending on the size of grains and the scale of grain images. For this study, we evaluated displacements between the observed and approximated coordinates equally over the entire contour. If one were interested in local shape variation, then one could assign a larger weight to squared displacements for the region of interest than to the remainder.
Because the Fourier coefficients,an,bn,cn, anddn, calculated as described above were not invari-ant to size, rotation, and the position of a starting point of the contour trace, they were standard-ized to be invariant to these factors according to the size and direction of the long axis of the first harmonic ellipse [25,34]. The standardization can be performed mathematically (i.e., in an objec-tive manner). It has been used in quantitaobjec-tive genetics analysis of the biological shape [13,35–38]. After this standardization, three Fourier coefficients became constant (a1= 1,b1= 0,c1= 0). The remaining 4N–3 coefficients were used as“descriptors”of shape. Hereinafter, we use vector nota-tionf ¼ ðaT
1;b
T
1;c
T
1;d
TÞT
¼ ða2;. . .;aN;b2;. . .;bN;c2;. . .;cN;d1;. . .;dNÞ
T
to represent the standardized EFDs, where subscript“–1”denotes the exclusion of the first harmonic coefficients
a1,b1, andc1because they became constant through the standardization procedure [25]. We setN as 20 in the present study. Therefore the dimensionality of the vectorfwas 77. Let the vectorf
l ¼ ða
2l;. . .;aNl;
b2l;. . .;
bNl;c2l;. . .;cNl;
d1l;. . .;
dNlÞ
T
average values of EFDs, the average contour coordinates for thel-th accession can be calculated as
xlðtÞ ¼
XN
n¼1
anlcos
2npt
T þ
bnlsin
2npt
T
and
ylðtÞ ¼
XN
n¼1
c
nlcos
2npt
T þ
dnlsin
2npt
T
:
To visualize the grain shape variation observed in datasets A and B, we overlaid the average contour coordinates of all accessions variation in each dataset. The significance of among-ac-cession variation against within-acamong-ac-cession variation (i.e., variation among grains in each acces-sion) was tested with the multivariate analysis of variance (MANOVA) using the‘manova’
function in R [39].
Genomic prediction of rice grain shape
We applied multiple methods to build a model that predicted EFDs based on genome-wide SNP marker genotypes. The first and second are methods that predict each coefficient of EFDs separately: we built a prediction model
fkl ¼gðxÞ;
wherefklis thek-th entry of the vectorfl(i.e., the vector of EFDs of thel-th accession).xis a
vector representing a genome-wide SNP marker genotype of thel-th accession. Each element ofxhad a value of 1 or -1 depending on the genotype of each marker. To build the prediction modelg(x), we used ridge regression (RR) and non-linear kernel ridge regression (KRR). In the model building process, we used the function‘kin.blup’in the‘rrBLUP’package [40] in R. We calculated the realized additive relation matrix using the function‘A.mat’in the same package and used it as a kinship matrix used in the RR. In the KRR, we defined the kernel as
kðx; x
nÞ ¼expð hðx xnÞ
2
Þ;
wherehis the bandwidth parameter. For this study, we choseh¼2=d2
m, wheredmis the
medi-an of the Euclidemedi-an distmedi-ances ofxamong all pairs of accessions, as chosen by Crossa et al. [41]. The third and fourth are methods that predict all the coefficients of EFDs simultaneously: we built a prediction model,
f
l¼gðxÞ;
whereflis the vector of EFDs oflth accession. For building the prediction modelg(x), we used
Reconstruction of grain contours based on predicted EFDs
We drew the predicted grain shape based on the EFDs predicted from genome-wide SNP marker genotypes. Using Eqs.1and2and ignoring offsets of the centroid from the origin, i.e.,
a0andc0, the prediction ofxandycoordinates of the point at the length of the contourtfrom the starting point can be conducted based on the predicted EFDs as
^
xlðtÞ ¼X N
n¼1
^
alncos2npt
T þ
^
blnsin2npt
T
and
^ ylðtÞ ¼
XN
n¼1
^ clncos
2npt
T þ
^ dlnsin
2npt
T
wherea^
ln,
^
bln,^clnand
^
dlnare the predicted EFDs of thel-th accession. SettingTas 1.0 andtas 0,
0.01,. . ., 0.99, we calculated the coordinates of 100 points on a contour and drew the shape of
the contour based on the calculated coordinate values.
Evaluation of prediction accuracy
To evaluate the accuracy of the genomic prediction of grain shape, we performed cross-valida-tion for which we calculated the squared prediccross-valida-tion error of grain shape of each accession as follows. Integrating the displacement ofxcoordinates on a predicted contour from the corre-spondingxcoordinates on an average contour in thel-th accession of a rice germplasm collec-tion, we obtain the equations shown below.
ZT
0
½x
lðtÞ x^lðtÞ
2 dt ¼ ZT 0 ( XN
n¼1
ða
ln ^alnÞcos
2npt
T þ ð
bln
^ blnÞsin
2npt
T ) 2 dt ¼T 2 XN
n¼1
½ða
ln a^lnÞ
2
þ ðbln
^ blnÞ
2
The integration of displacement inycoordinates of predicted and average contours in the
l-th accession is calculable in l-the same way. Consequently, we can calculate l-the squared predic-tion error of grain shape of thel-th accession as the integration of displacement in both coordinates, as
ZT
0
f½x
lðtÞ ^xlðtÞ
2
þ ½y
lðtÞ ^ylðtÞ
2
gdt
¼T 2
XN
n¼1
½ða
ln a^lnÞ
2
þ ðbln
^ blnÞ
2
þ ðc
ln ^clnÞ
2
þ ðdln
^ dlnÞ
2
:
calculated as
PRESS¼T 2
XL
l¼1
XN
n¼1
½ða
ln ^alnÞ
2
þ ðbln
^ blnÞ
2
þ ðc
ln ^clnÞ
2
þ ðdln
^ dlnÞ
2
:
The accuracy of predicted grain shapes was then measured as
Q2
¼1 PRESS=T 2
XL
l¼1
XN
n¼1
½ða
ln anÞ
2
þ ðbln
bnÞ
2
þ ðc
ln cnÞ
2
þ ðdln
dnÞ
2
; ð3Þ
wherea
k,
bk,ck, and
dkrespectively denote the means ofalk,
blk,clk, and
dlkover all accessions.
TheQ2represents the proportion of the variations explained by the prediction to the total vari-ations in contour coordinates (i.e., shape varivari-ations). As described in the previous subsection, we set the value ofTas 1.0 for calculating the squared prediction error of grain shape of each accession, PRESS andQ2.
To evaluate the prediction accuracy based on the squared prediction error of grain shape of each accession and theQ2statistic, we conducted cross-validation of two types: leave-one-out cross-validation and ten-fold cross-validation. To evaluate the variation attributable to random splits of samples in the ten-fold cross-validation, we repeated ten-fold cross-validation 10 times on different splits of samples. In each replication, we used an identical random split of samples for all methods to enable the paired comparison of the prediction accuracy between methods. In ten-fold cross-validation, we can test the significance of difference between methods based on the prediction accuracy estimated in 10 replications. The significance of difference between methods was tested between RR and the other methods (i.e., KRR, PLS, and KPLS) with the Wilcoxon signed rank test that compared the matched pairs of a replication in the ten-fold cross-validation using the function‘wilcox.exact’in the R package‘exactRankTests’. In the test, we regarded RR as a reference because it is the most common method used for genomic predic-tion and genomic selecpredic-tion.
Results
Rice grain shape variation delineated by EFDs
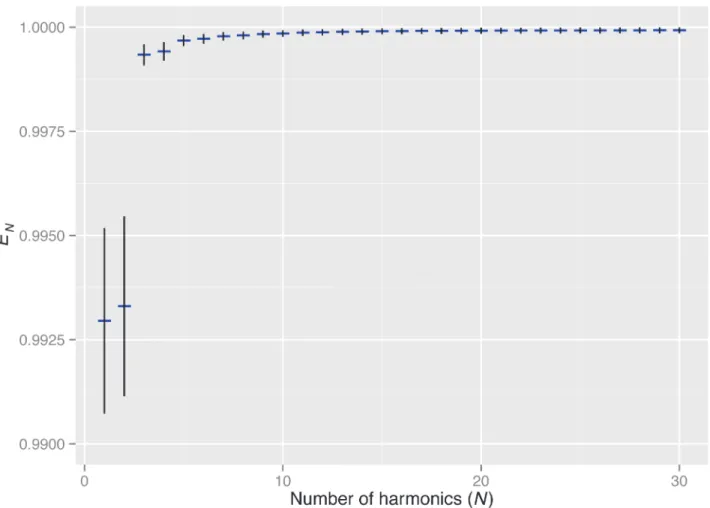
In this study, the contour coordinates of rice grains were extracted from digital images and then approximated with EFDs. We measured the contour shape of 2,605 grains. When the number of harmonics of EFDs was greater than 15, the error in the approximation with EFDs,
E2
N, was on average less than 0.01% of the total shape variation (Fig 1). For the following
analy-ses, we used the first 20 harmonics of EFDs. Therefore, the variations in contour coordinates (i.e., shape variations) were almost exhaustively captured as the variation of EFDs.
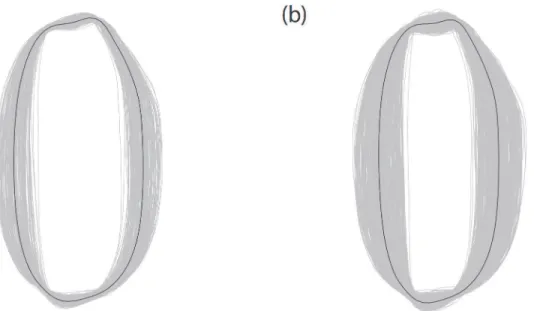
InFig 2, the average grain shape of each accession was overlaid to visualize a grain shape variation among accessions. The among-accession variation was large in both datasets, and the length-to-width ratio of the grain was the major variation. A wider range of the variation was observed in dataset B than in dataset A (Fig 2). Especially, accessions having slender grain shape were included more frequently in dataset B than in dataset A. The MANOVA of EFDs revealed that the among-cultivar variation was significantly larger than the within-cultivar var-iation in both datasets (F= 1.52,p<2.2 × 10⁻¹⁶for dataset A andF= 2.05,p<2.2 × 10⁻¹⁶for
Prediction accuracy of rice grain shape
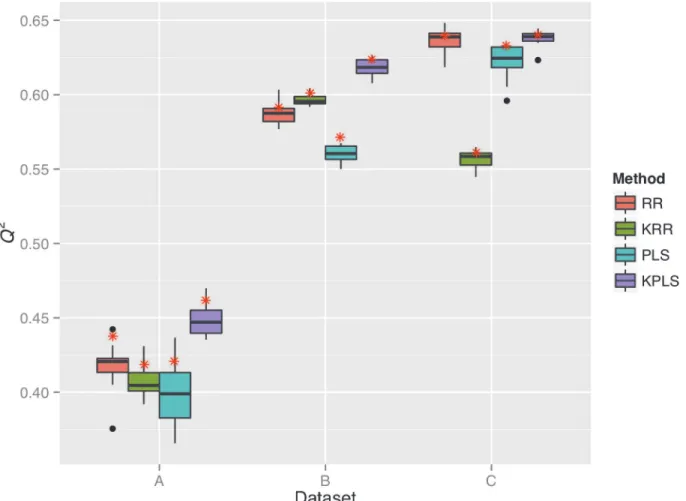
For each of datasets A, B and C, we built a prediction model for rice grain shape using one of four different methods (i.e., RR, KRR, PLS, and KPLS), and evaluated the prediction accuracy of the models based on theQ2statistic (Fig 3). Based on the cross-validation of both types (i.e., ten-fold and leave-one-out cross-validation), theQ2showed the lowest values in dataset A among the datasets in all four methods. In datasets B and C,Q2showed similar values. In meth-od-wise comparison,Q2was larger in dataset C than in dataset B, except for KRR. TheQ2 cal-culated via leave-one-out cross-validation was larger than the median ofQ2in the 10
replications of ten-fold cross-validation, but it fell within a range of a variation observed in the 10 replications. The underestimation ofQ2in the ten-fold cross-validation (or the overestima-tion ofQ2in the leave-one-out cross-validation) was more pronounced in dataset A than in dataset B or C.
In dataset A, theQ2statistic was significantly different between RR on one hand and PLS (p<0.05) and KPLS (p<0.01) on the other in the ten-fold cross-validation. In fact, PLS was less accurate than RR, although KPLS was more accurate than RR (Fig 3). In leave-one-out cross-validation, KPLS showed the largestQ2among the four methods. In dataset B, theQ2 sta-tistics of RR and the other methods were significantly different (KRR,p<0.01; PLS,p<0.01; KPLS,p<0.01). Results show that PLS was less accurate than RR, but KRR and KPLS were
Fig 1. Accuracy of grain shape approximation using EFDs.Thexandyaxes show the number of harmonics of EFDs and the proportion of approximation error to the total grain shape variation,E2N(see text for details). Blue horizontal bars and black vertical bars show the mean and standard deviation of theE2N
more accurate than RR. In leave-one-out cross-validation, KPLS showed the largestQ2among the four methods. In dataset C, theQ2statistic was significantly different between RR on one hand and KRR (p<0.01) and PLS (p<0.01) on the other. KRR and PLS were less accurate than RR. In the leave-one-out cross-validation, KPLS showed the largestQ2among the four methods. In the ten-fold cross-validation, however, the difference between RR and KPLS was not significant as described above. Next, we specifically assessed the prediction accuracy of KPLS evaluated via leave-one-out cross-validation.
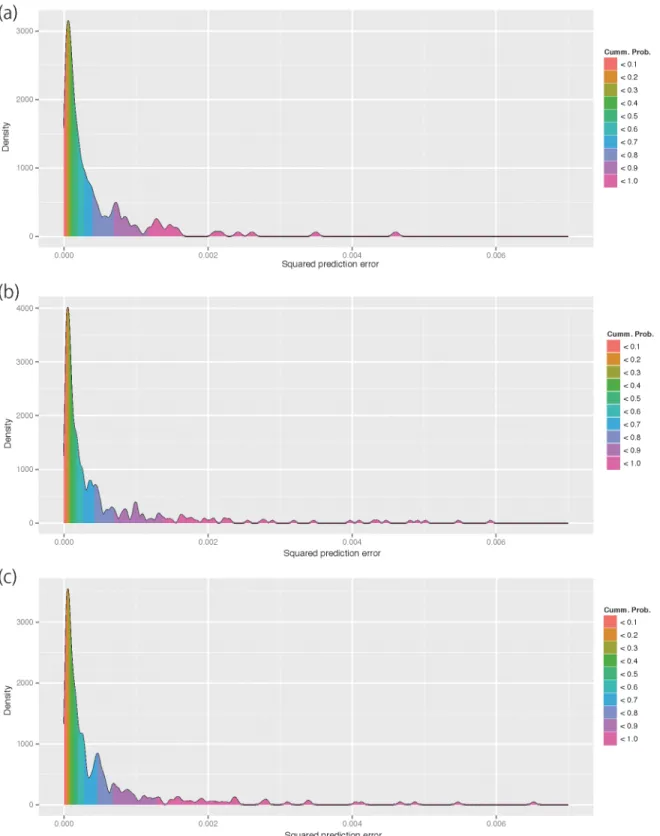
Fig 4depicts the frequency distribution in the squared prediction error of each accession. In all datasets, the distribution has a long right tail, but was strongly biased toward zero. In all datasets, the 70th percentile was in the head of the distribution, indicating that the prediction error was small in most (70%) accessions.Fig 5depicts the predicted grain shape overlaid on the average grain shape of accessions that correspond to the 0th, 5th, 10th,. . ., 100th
percen-tiles of the prediction errors. Accessions with prediction errors smaller than the median (i.e., 50th percentile) showed only slight difference between the predicted and average grain shapes. As portrayed inFig 4, the difference between predicted and average grain shapes became readi-ly apparent in the accessions with prediction errors larger than the 70th percentile. This trend was also observed in the grain shape prediction of other accessions (S1–S3Figs.): in most (>50%) accessions, the rice grain shape prediction based on genome-wide SNP marker geno-types was accurate at a practical level, whereas the prediction is difficult in some accessions. In accessions with larger prediction errors, thin and round types of rice grains were predicted as intermediate grains between thin and round types.
Discussion
In this study, we assessed a method for the genomic prediction of the biological contour shape delineated by EFDs. Using this method, we can predict EFDs based on genome-wide marker genotype data. Predicted EFDs of each accession can be visualized as a predicted contour shape via inverse Fourier transformation. The visualization enables us to grasp shape variation
Fig 2. Grain shape variation observed in datasets A (a) and B (b).Average grain shapes of all accessions were overlaid. Thick contour lines represent the grain shape averaged over all accessions.
intuitively, and makes the genomic prediction useful for select favorable shape based on ge-nome-wide marker polymorphisms.
We delineated the rice grain shape with EFDs. Then we averaged EFDs over all grains mea-sured for each accession. Based on the averaged EFDs, we built a model for predicting the grain shape of each accession. Then we evaluated the accuracy of the prediction model comparing the predicted EFDs with the averaged EFDs. Most (>99.9%) of the variation in the rice grain shape was delineated by EFDs. Therefore, EFDs are good mediators for associating contour co-ordinate data to genome-wide marker data. In fact, EFDs can be standardized to size, rotation and the position of a starting point of the contour trace. Therefore, they are unaffected by these factors. Moreover, EFDs are independent of the number of sampling points (i.e., pixels) on the traced contour and represent the shape variation in uniform dimensions (77 dimensions in this study). These features make EFDs manageable mediators between contour coordinate data and genome-wide marker data. In this study, we performed MANOVA of EFDs. Results show that the among-accession variation of grain shape was highly significant. This result justifies that averaged EFDs are used in the construction of a prediction model and in the evaluation of prediction accuracy of the model.
The accuracy was lower in dataset A than in dataset B or C. The lower accuracy in dataset A has several possible causes. First, dataset A had smaller sample size (i.e., fewer accessions) than
Fig 3. Prediction accuracy,Q2, of rice grain shape in datasets A (a), B (b), and C (c).Each boxplot corresponds to a single method applied to a single dataset, and represents the range ofQ2values obtained in the 10 replications of the ten-fold cross-validation. Red asterisks denote theQ2values obtained in the leave-one-out cross-validation.
Fig 4. Empirical frequency distribution of squared prediction errors of all accessions in datasets A (a), B (b), and C (c).The empirical distribution was obtained using the algorithm of kernel density estimation. The distribution was filled with colors corresponding to the empirical cumulative probability of the squared prediction errors.
dataset B or dataset C. Small sample sizes for model buildings are well known to reduce the ac-curacy of the prediction model. The small sample size of dataset A might also cause the differ-ence in the prediction accuracy estimated via the ten-fold cross-validation and leave-one-out cross-validation because the former cross-validation wastes 10% of the available data, whereas the latter wastes less than 1% (1 / 179) of the data. Second, the range of grain shape variation in dataset A was smaller than that in dataset B or dataset C. TheQ2statistic is calculated as shown inEq. 3. Therefore, it becomes smaller when the grain shape variation (the among-accession sum of squares of EFDs, i.e., the denominator of the second term) is smaller. In fact, the distri-bution of the squared prediction error of grain shape for each accession did not differ greatly between dataset A and dataset B or C (Fig 4). Third, the proportion of imputed genotypes was larger in dataset A (47.3%) than in dataset B or dataset C (3.1% and 4.3%). Wrongly imputed genotypes might cause inaccuracy in the prediction. A comparison between dataset B and data-set C showed that datadata-set C exhibited higher accuracy than datadata-set B did. The major difference between datasets B and C was the number of markers used for prediction. Linkage disequilibri-um in cultivated rice was high especially injaponicarice [43]. The number of markers of data-set B, however, is regarded as insufficient for the accurate prediction of grain shape variation.
Among the four methods used for model building, KPLS showed the highest accuracy in all datasets. With KPLS, all EFDs were predicted simultaneously. EFDs have strong correlations among them. Therefore, the correlation structure in EFDs favors KPLS that models multiple
Fig 5. Rice grain shape predicted based on genome-wide SNP marker genotypes.A green contour line represents the predicted grain shape of each accession. An orange contour line represents the average grain shape of the accession. The grain shape prediction accuracy was evaluated via leave-one-out cross-validation.
independent variables (i.e., all EFDs) simultaneously. Ordinary PLS also models multiple de-pendent variables, but showed lower accuracy than RR which models a single dede-pendent vari-able individually. The result suggests that nonlinear relations exist between multiple
independent variables (i.e., EFDs) and dependent variables (i.e., marker genotypes), and that a nonlinear kernel approach is necessary for modeling the nonlinear relations. However, the rela-tion between RR and KRR is opposite to the relarela-tion between KPLS and PLS: non-linear KRR showed lower accuracy than linear RR except in dataset B. The result suggests that the nonline-ar relations between EFDs and mnonline-arker genotypes become readily appnonline-arent when all EFDs nonline-are modeled simultaneously. The advantage of KPLS over RR was not significant in dataset C, which suggests that nonlinear relations between EFDs and marker genotypes are attributable to the insufficient sample size and marker density. Relations between prediction methods and prediction accuracy are so complex that the prediction accuracy of methods depends largely on the mode of inheritance of a target trait (i.e., degree of heritability, number of QTL, proportion of non-additive genetic variation), the size of a training population, and the linkage disequilib-rium structure [44]. Additional studies must be conducted to investigate factors causing the nonlinear relations, including nonlinear genetic effect such as epistasis.
The genomic prediction of plant organ shape enables us to select plants with favorable shape based on genome-wide marker polymorphisms (i.e., genomic selection) without observ-ing their actual shape via field experiments. Many benefits of the genomic selection relative to conventional phenotypic selection have been suggested [18,19]. As viewed from the perspec-tive of genetic improvement of plant organ shape, some of the great benefits of genomic selec-tion are the following. (1) The shape of agriculturally important organs such as fruits and seeds is expressed after the reproductive phase. Using genomic prediction, plants with favorable shapes can be selected in the early vegetative phase (i.e., seedling development). This benefit is of great importance particularly for species that have long vegetative phase, such as fruit trees [24]. (2) In the genetic improvement of crop organ shape, a required selection scheme is usual-ly not simple directional selection because the optimum shape is based on well balanced multi-ple factors in general. In such a trait, ordinary MAS might not be an appropriate selection method because of its simplicity. Using selection based on the genomic prediction of crop organ shape, it is possible to confirm the predicted shapes of selection candidates visually and to select genotypes having favorable shapes. Consequently, the method proposed in this study presents great advantages over ordinary MAS. Using the method proposed by Iwata et al. [45], it is possible to predict the segregation pattern of a target trait in a progeny population based on a genomic selection prediction model. The method will facilitate the selection of good pa-rental combinations that have high potential to produce progenies with optimum shape.
Quantitative shape measurement based on EFDs has been applied to the quantitative genet-ic analyses of biologgenet-ical shape. Based on EFDs of biologgenet-ical contours, QTLs controlling biologi-cal shape variation have been detected via bi-parental QTL mapping [35–38,46,47] and genome-wide association studies [13,48]. Successful application of EFDs to the quantitative ge-netic analyses of biological shape demonstrates that EFDs can delineate the continuous shape variation accurately and that they can capture genetic variation underlying the phenotypic vari-ation of biological shape. The achievements also suggest that the genomic prediction of biologi-cal shape proposed in this paper is applicable to other species as well. Currently,
high-throughput genotyping technologies are available for a range of organisms [49]. They might fa-cilitate the genomic prediction of biological shapes in various species. Further studies are war-ranted to evaluate the efficiency of the proposed method in the genomic prediction of more complex biological shape variation observed in other species.
dataset, however, was there environmental replication. When the influence of environment fac-tors is strong, the prediction accuracy of a model built in one environment (e.g., location, year) might become worse in another environment [50]. This is an issue in genomic selection, but it has not been addressed well in the literature [51]. Few studies have examined multi-environ-mental evaluation of plant shape variation [52–55]. Therefore, more studies must be done to investigate the influence of environmental factors on the accuracy of genomic prediction of plant shape.
This study revealed kernel PLS regression as the most efficient method to build a model for predicting genetic values in a high-dimensional trait, rice grain shape, based on genome-wide SNP marker genotypes. The result suggests the potential of kernel PLS regression for the geno-mic prediction of other high-dimensional traits. Recently, high-throughput phenotyping sys-tems have been developed to facilitate the measurement of phenotypic variation and to relieve a severe obstacle to‘omics’studies, i.e., so-called‘phenotyping bottleneck’[56]. In the high-throughput phenotyping systems, various novel technologies, including image analysis, are used. They generate large amounts of high-dimensional phenotypic data. As suggested in this study, the kernel PLS regression seems useful for modeling the relation between a high-dimen-sional quantitative trait and genome-wide marker polymorphisms. No report in the literature has described a study in which kernel PLS regression was applied to model building in genomic selection. Additional studies must be conducted to evaluate the potential of the kernel PLS re-gression for the genomic selection of high-dimensional traits.
Conclusions
As described herein, we proposed a method for predicting the biological contour shape based on genome-wide SNP markers. Results obtained from an empirical study using rice germplasm accessions suggested the potential of the proposed method in rice grain shape prediction. The method enables application of genomic selection to rice grain shape improvement. EFDs have been applied to genetic analyses of biological shape. This method is expected to be useful for other species as well. As described herein, we proposed the use of kernel PLS regression to dict high-dimensional EFDs, with an approach that might be useful also for the genomic pre-diction of a high-dimensional trait obtained using high-throughput phenotyping technology.
Supporting Information
S1 Dataset. Genome-wide SNP marker data and elliptic Fourier descriptor data in datasets A, B, and C are provided in the zip file.The zip file includes two directories: Directory“ Geno-typeScore”contains SNP genotype scores after imputation of missing genotypes, and directory
“FourierDescriptor”contains varietal averages of elliptic Fourier descriptors. (ZIP)
S1 Fig. Predicted and average grain shapes of rice germplasm accessions in dataset A.A green contour line represents the predicted grain shape of each accession. An orange contour line represents the average grain shape of the accession. The grain shape prediction accuracy was evaluated via leave-one-out cross-validation.
(TIF)
S2 Fig. Predicted and average grain shapes of rice germplasm accessions in dataset B.A green contour line represents the predicted grain shape of each accession. An orange contour line represents the average grain shape of the accession. The grain shape prediction accuracy was evaluated via leave-one-out cross-validation.
S3 Fig. Predicted and average grain shapes of rice germplasm accessions in dataset C.A green contour line represents the predicted grain shape of each accession. An orange contour line represents the average grain shape of the accession. The grain shape prediction accuracy was evaluated via leave-one-out cross-validation.
(TIF)
S1 Table. Accessions in rice germplasm at the National Institute of Agrobiological Sciences (NIAS) Genebank, which were involved in dataset A.
(PDF)
S2 Table. Accessions in Genetic Stocks—Oryza (GSOR) involved in datasets B and C.
(PDF)
Acknowledgments
The authors thank Yosuke Yoshioka and Akifumi Imada for assistance in digital photography and image processing.
Author Contributions
Conceived and designed the experiments: HI TH. Performed the experiments: HI KE YU. Ana-lyzed the data: HI. Contributed reagents/materials/analysis tools: YU. Wrote the paper: HI KE YU TH.
References
1. Lestrel PE. Biological shape analysis: Proceedings of the First International Symposium. Singapore: World Scientific Publishing; 2011.
2. Iwata H. Quantitative genetic analysis of crop organ shape based on principal components of elliptic Fourier descriptors. In: Lestrel PE editor. Biological shape analysis: Proceedings of the First Interna-tional Symposium, Tsukuba, Japan, 3–6 June 2009. Singapore: World Scientific Publishing;
2011. pp. 50–66.
3. RedonãED, Mackill DJ. Quantitative trait locus analysis for rice panicle and grain characteristics. Theor Appl Genet. 1998; 96: 957–963.
4. Tan YF, Sun M, Xing YZ, Hua JP, Sun XL, Zhang QF, et al. Mapping quantitative trait loci for milling quality, protein content and color characteristics of rice using a recombinant inbred line population de-rived from an elite rice hybrid. Theor Appl Genet. 2001; 103: 1037–1045.
5. Jongkaewwattana S, Geng S. Inter-relationships amongst grain characteristics, grain-filling parameters and rice (Oryza sativaL.) milling quality. J Agron Crop Sci. 2001; 187: 223–229.
6. Zheng TQ, Xu JL, Li ZK, Zhai HQ, Wan JM. Genomic regions associated with milling quality and grain shape identified in a set of random introgression lines of rice (Oryza sativa L.). Plant Breed. 2007; 126: 158–163.
7. Unnevehr LJ, Duff B, Juliano BO. Consumer demand for rice grain quality: Terminal report of IDRC proj-ects national grain quality (Asia) and international grain quality economics (Asia). Ottawa: IDRC; 1992.
8. Bai X, Luo L, Yan W, Kovi MR, Zhan W, Xing Y. Genetic dissection of rice grain shape using a recombi-nant inbred line population derived from two contrasting parents and fine mapping a pleiotropic quanti-tative trait locusqGL7. BMC Genet. 2010; 11: 16. doi:10.1186/1471-2156-11-16PMID:20184774
9. Mellissa AF, McCouch SR, Hall RD. Not just a grain of rice: the quest for quality. Trends Plant Sci. 2009; 14: 133–139. doi:10.1016/j.tplants.2008.12.004PMID:19230745
10. Huang R, Jiang L, Zheng J, Wang T, Wang H, Huang Y, et al. Genetic bases of rice grain shape: so many genes, so little known. Trends Plant Sci. 2013; 18: 1360–1385.
11. Fan C, Xing Y, Mao H, Lu T, Han B, Xu C, et al.GS3, a major QTL for grain length and weight and minor QTL for grain width and thickness in rice, encodes a putative transmembrane protein. Theor Appl Genet. 2006; 112: 1164–1171. PMID:16453132
13. Iwata H, Ebana K, Uga Y, Hayashi T, Jannink JL. Genome-wide association study of grain shape varia-tion amongOryza sativaL. germplasms based on elliptic Fourier analysis. Mol Breeding. 2010; 25: 203–215.
14. Wang C, Chen S, Yu S. Functional markers developed from multiple loci inGS3for fine marker-assis-ted selection of grain length in rice. Theor Appl Genet. 2010; 122: 905–913. doi:
10.1007/s00122-010-1497-0PMID:21107518
15. Goddard ME, Hayes BJ. Genomic selection. J Anim Breed Genet. 2007; 124: 323–330. PMID:
18076469
16. Meuwissen THE, Hayes BJ, Goddard ME. Prediction of total genetic value using genome-wide dense marker maps. Genetics. 2001; 157: 1819–1829. PMID:11290733
17. Hayes BJ, Bowman PJ, Chamberlain AJ, Goddard ME. Genomic selection in dairy cattle: progress and challenges. J Dairy Sci. 2009; 92: 433–443. doi:10.3168/jds.2008-1646PMID:19164653
18. Heffner EL, Sorrells ME, Jannink JL. Genomic selection for crop improvement. Crop Sci. 200; 49: 1–
12.
19. Jannink JL, Lorenz AJ, Iwata H. Genomic selection in plant breeding: from theory to practice. Brief Funct Genome. 2010; 9: 166–177. doi:10.1093/bfgp/elq001PMID:20156985
20. Grattapaglia D, Resende MDV. Genomic selection in forest tree breeding. Tree Genet Genomes. 2011; 7: 241–255
21. Tester M, Langridge P. Breeding technologies to increase crop production in a changing world. Sci-ence. 2010; 327: 818–822. doi:10.1126/science.1183700PMID:20150489
22. Iwata H, Jannink JL. Accuracy of genomic selection prediction in barley breeding programs: a simula-tion study based on the real SNP data of barley breeding lines. Crop Sci. 2011; 51: 1915–1927. 23. Heslot N, Yang HP, Sorrells ME, Jannink JL. Genomic selection in plant breeding: a comparison of
models. Crop Sci. 2012; 52: 146–160.
24. Iwata H, Hayashi T, Terakami S, Takada N, Sawamura Y, Yamamoto T. Potential assessment of ge-nome-wide association study and genomic selection in Japanese pearPyrus pyrifolia. Breed Sci. 2013; 63: 125–140. doi:10.1270/jsbbs.63.125PMID:23641189
25. Kuhl FP, Giardina CR. Elliptic Fourier analysis of a closed contour. Comput Graph Image Process. 1982; 18: 259–278.
26. Lestrel PE. Biological shape analysis: Proceedings of the Second International Symposium. Singapore: World Scientific Publishing; 2013.
27. Kojima Y, Ebana K, Fukuoka S, Nagamine T, Kawase M. Development of an RFLP-based rice diversity research set of germplasm. Breed Sci. 2005; 55: 431–440.
28. Zhao K, Wright M, Kimball J, Eizenga G, McClung A, Kovach M, et al. Genomic diversity and introgres-sion inO.sativareveal the impact of domestication and breeding on the rice genome. PLoS One, 2010; 5: e10780. doi:10.1371/journal.pone.0010780PMID:20520727
29. Zhao K, Tung CW, Eizenga GC, Wright MH, Ali ML, Price AH, et al. Genome-wide association mapping reveals a rich genetic architecture of complex traits inOryza sativa. Nat Commun, 2011; 2: 467. doi:10. 1038/ncomms1467PMID:21915109
30. Yamamoto T, Nagasaki H, Yonemaru J, Ebana K, Nakajima M, Shibaya T. Fine definition of the pedi-gree haplotypes of closely related rice cultivars by means of genome-wide discovery of single-nucleo-tide polymorphisms. BMC Genomics, 2010; 11:267. doi:10.1186/1471-2164-11-267PMID:20423466
31. Scheet P, Stephens M. A fast and flexible statistical model for large-scale population genotype data: Applications to inferring missing genotypes and haplotypic phase. Am J Hum Genet. 2006; 78: 629–
644. PMID:16532393
32. Iwata H, Jannink JL. Marker genotype imputation in a low-marker-density panel with a high-marker-density reference panel: Accuracy evaluation in barley breeding lines. Crop Sci. 2010; 50: 1269–1278. 33. Iwata H, Ukai Y. SHAPE: a computer program package for quantitative evaluation of biological shapes
based on elliptic Fourier descriptors. J Hered, 2002; 93: 384–385. PMID:12547931
34. Furuta N, Ninomiya S, Takahashi N, Ohmori H, Ukai Y. Quantitative evaluation of soybean (Glycine maxL. Merr.) leaflet shape by principal component scores based on elliptic Fourier descriptor. Breed Sci. 1995; 45: 315–320.
35. Yamanaka N, Ninomiya S, Hoshi M, Tsubokura Y, Yano M, Nagamura Y, et al. An informative linkage map of soybean reveals QTLs for flowering time, leaflet morphology and regions of segregation distor-tion. DNA Res, 2001; 8: 61–72. PMID:11347903
37. Oka A, Aoto T, Totsuka Y, Takahashi R, Ueda M, Mita A, et al. Disruption of genetic interaction between two autosomal regions and the x chromosome causes reproductive isolation between mouse strains derived from different subspecies. Genetics, 2007; 175: 185–197. PMID:17057240
38. Williams K, Sorrells ME. Three-dimensional seed size and shape QTL in hexaploid wheat (Triticum aestivumL.) populations. Crop Sci, 2013; 54: 98–110.
39. R Core Team. R: A language and environment for statistical computing. R Foundation for Statistical Computing, Vienna, Austria. 2014; ISBN 3-900051-07-0, URLhttp://www.R-project.org/.
40. Endelman JB. Ridge regression and other kernels for genomic selection with R package rrBLUP. Plant Genome, 2011; 4: 250–255.
41. Crossa J, de los Campos G, Pérez P, Gianola D, Burgueño J, et al. Prediction of genetic values of
quantitative traits in plant breeding using pedigree and molecular markers. Genetics, 2010; 186: 713–
724. doi:10.1534/genetics.110.118521PMID:20813882
42. Rosipal R, Trejo LJ Kernel partial least squares regression in reproducing kernel Hilbert space. J Mach Learn Res. 2001; 2: 97–123.
43. Xu X, Liu X, Ge S, Jensen JD, Hu F, Li X, et al. Resequencing 50 accessions of cultivated and wild rice yields marker for identifying agronomically important genes. Nat Biotech. 2012; 30: 105–111.
44. Onogi A, Ideta O, Inoshita Y, Ebana K, Yoshioka T, Yamasaki M, et al. Exploring the areas of applicabil-ity of whole-genome prediction methods for Asian rice (Oryza sativa L.). Theor Appl Genet. 2015; 128: 41–53. doi:10.1007/s00122-014-2411-yPMID:25341369
45. Iwata H, Hayashi T, Terakami S, Takada N, Saito T, Yamamoto T. Genomic prediction of trait segrega-tion in a progeny populasegrega-tion: a case study of Japanese pear (Pyrus pyrifolia). BMC Genetics. 2013; 14: 81. doi:10.1186/1471-2156-14-81PMID:24028660
46. Liu J, Mercer JM, Stam LF, Gibson GC, Zeng ZB, Laurie CC. Genetic analysis of a morphological shape difference in the male genitalia ofDrosophila simulansandD.mauritiana. Genetics. 1996; 142: 1129–1145. PMID:8846893
47. Zeng ZB, Liu J, Stam LF, Kao CH, Mercer JM, Laurie CC. Genetic architecture of a morphological shape difference between twoDrosophilaspecies. Genetics. 2000; 154: 299–310. PMID:10628989 48. Chitwood DH, Ranjan A, Martinez CC, Headland LR, Thiem T, Kumar R, et al. A modern ampelogra-phy: A genetic basis for leaf shape and venation patterning in grape. Plant Physiol. 2013; 164: 259–
272. doi:10.1104/pp.113.229708PMID:24285849
49. Davey JW, Hohenlohe PA, Etter PD, Boone JQ, Catchen JM, Blaxter ML. Genome-wide marker discov-ery and genotyping using next-generation sequencing. Nat Rev Genet. 2011; 12: 499–510. doi:10.
1038/nrg3012PMID:21681211
50. Resende MFR Jr, Muñoz P, Acosta JJ, Peter GF, Davis JM, Grattapaglia D, et al. Accelerating the do-mestication of trees using genomic selection: accuracy of prediction models across ages and environ-ments. New Phytol. 2012; 193: 617–624. doi:10.1111/j.1469-8137.2011.03895.xPMID:21973055 51. Heslot N, Akdemir D, Sorrells ME, Jannink JL. Integrating environmental covariates and crop modeling
into genomic selection framework to predict genotype by environment interactions. Theor Appl Genet. 2014; 127: 463–480. doi:10.1007/s00122-013-2231-5PMID:24264761
52. Iwata H, Nesumi H, Ninomiya S, Takano Y, Ukai Y. The evaluation of genotype x environment interac-tions of citrus leaf morphology using image analysis and elliptic Fourier descriptors. Breed Sci. 2002; 52: 243–251.
53. Lootens P, Van Waes J, Carlier L. Description of the morphology of roots ofChicorium intybusL. partim by means of image analysis: Comparison of elliptic Fourier descriptors and classical parameters. Compt Electron Agr. 2007; 58: 164–173.
54. Viscosi V, Fortini P. Leaf shape variation and differentiation in three sympatric white oak species re-vealed by elliptic Fourier analysis. Nord J Bot. 2011; 29: 632–640.
55. Mebatsion HK, Paliwal J, Jayas DS. Evaluation of variations in the shape of grain types using principal component analysis of the elliptic Fourier descriptors. Compt Electron Agr. 2012; 80: 63–70. 56. Furbank RT, Tester M. Phenomics—technologies to relieve the phenotyping bottleneck. Trends Plant