Repositório ISCTE-IUL
Deposited in Repositório ISCTE-IUL: 2019-04-16
Deposited version: Post-print
Peer-review status of attached file: Peer-reviewed
Citation for published item:
Rosa, A., Reis, E. & Vicente, P. (2016). Quality assurance in the Portuguese census: the contribution of the balanced scorecard. The Quality Management Journal. 23 (4), 37-49
Further information on publisher's website: 10.1080/10686967.2016.11918488
Publisher's copyright statement:
This is the peer reviewed version of the following article: Rosa, A., Reis, E. & Vicente, P. (2016). Quality assurance in the Portuguese census: the contribution of the balanced scorecard. The Quality Management Journal. 23 (4), 37-49, which has been published in final form at
https://dx.doi.org/10.1080/10686967.2016.11918488. This article may be used for non-commercial purposes in accordance with the Publisher's Terms and Conditions for self-archiving.
Use policy
Creative Commons CC BY 4.0
The full-text may be used and/or reproduced, and given to third parties in any format or medium, without prior permission or charge, for personal research or study, educational, or not-for-profit purposes provided that:
• a full bibliographic reference is made to the original source • a link is made to the metadata record in the Repository • the full-text is not changed in any way
Quality Assurance in the 2011 Portuguese Census: The Contribution of the Balanced Scorecard
Álvaro Rosa, Elizabeth Reis, Paula Vicente, Instituto Universitário de Lisboa (ISCTE-IUL), Business Research Unit (BRU-IUL), Lisbon, Portugal
This article describes how the balanced scorecard methodology and associated procedures were
developed and implemented as the framework for the quality assurance strategy of the fieldwork in
the 2011 Portuguese Population and Housing Census. The main goal of a census operation is to
provide high-quality statistical information on population, buildings, and dwellings that meet users’
needs. The most critical activity of a census is the fieldwork operation where the distribution,
completion, and recollection of census questionnaires are handled. Due to the dimension,
complexity, and need to guarantee the final product quality of the census 2011 operation, the
balanced scorecard methodology was elected as the framework for the quality assurance strategy
implementation. This was the first time such a management system was used in a census operation.
In terms of academic research on census quality control, the quality focus has been on the net
undercount based on post enumeration survey. On the contrary, the authors’ concern is about how
to ensure quality enumeration work during the census operation. The balanced scorecard
methodology allowed integrating the operational execution of goals and its control into a single
census management tableaux du bord, which allowed the provision of updated information on the
ongoing processes and, thus, the ability to make timely corrections for those targets that suffered
deviations.
INTRODUCTION
The Portuguese Census 2011 has provided a green field for testing the use of balanced scorecard (BSC) as a quality control framework in a large-scale project such as this population counting activity. In this paper, the authors discuss how the BSC, which is conceptually a strategic management framework designed for enterprise performance assessment (Beer and Eisenstat 2000; Kaplan and Norton 2001; Olve, Petri, and Roy 2003; Pforsich 2005; Speckbacher, Bischof, and Pfeiffer 2003; Thompson and Strickland 2001), provided an effective monitoring and objective evaluation process of the census operation. In fact, the comprehensive thinking of the BSC four dimensions – financial, customers, suppliers, and learning and innovation (Kaplan and Norton 1992; 2000; Kaplan and Klein 1996; Richardson 2004) – has led to a comprehensive way to look at the puzzle of objectives and operations of the census activity.
The mission of the Portuguese census is to produce and disseminate high-quality official statistical information concerning population and housing in an effective, efficient, and independent manner (Statistics Portugal 2007). The Portuguese population and housing census takes place every 10 years. Every household is legally obliged to record various details of the dwelling and of
members living there on the reference day, and return the completed forms to Statistics Portugal in due time. The last Portuguese population and housing census took place in March/April 2011, and the Census Office of Statistics Portugal was the official body in charge of the operation. The census involved more than 50,000 collaborators – including coordinating members, enumerators, trainers, logistics partners, training companies, computer hardware and software companies, and the like – and the design of a complex system of questionnaire distribution, collection, and processing. Due to the dimension, complexity, and need to guarantee the final product quality of the census 2011 operation, the BSC methodology was selected as the framework for the quality assurance strategy implementation. This was the first time such a management system was used in a census operation. Traditionally, the control process is based on sectorial objectives and indicators, and provides no
This paper describes how the BSC methodology could be innovatively used as a quality assurance system for a large-scale project such as the fieldwork operation of the 2011 Portuguese population and housing census.
Statistics Portugal has a long-standing tradition of high standards of quality for its census activities and for the data collected. To maintain these standards, quality assurance (QA) and quality control (QC) systems were implemented to ensure enumeration, address listing, and map-updating operations followed established procedures. Prior to the 2011 census, the process of designing those QA/QC operations was done in a somewhat ad hoc fashion. That is, once the census operations were duly planned, the QA/QC operations were then designed by areas of activity and scheduled to inspect the quality of the census work. This procedure restricted the opportunity to integrate the QA/QC into the production process and directly affected the effectiveness of the QA/QC (Statistics Portugal 2001). One such situation is the lack of predicting capacity of the performance of certain groups of enumerators, as there were no linkages between the training objectives and the
performance of the same. The largest handicap manifested was the inability to get real-time
information and provide feedback to the production sector for facilitating corrective actions and on-time improvements. In the 2011 census, there was an effort to integrate QA procedures into the census production plan, so the QA operations were conceived at the same time as the production operation. This enabled the QA design to anticipate the vulnerabilities within the census operation and address them appropriately. For a QA system to be truly effective, it must be capable of addressing all aspects of the operation that could be exposed to error or failure.
QC in statistical surveys has been addressed at a macro level by Lyberg et al. (1997), Collins and Sykes (1999), and Biemer and Lyberg (2003). Biemer and Caspar (1994) showed how to implement continuous quality improvement (CQI) in a survey process. These authors have successfully demonstrated how survey quality control could be organized under the four-step Kaizen model (Imai 1986) of quality management, thus replacing the older method of sample inspection. In the BSC model, all activities are measured and controlled (Kaplan and Norton 1992).
In the census literature, the quality focus is on the net undercount, as studied by Isaki et al. (1988) or, more recently, by Biemer et al. (2001), who used statistical techniques to address the problem, and Redfern (2003) who tackled specific undercount issues in census such as migration. However, they all are based on post-enumeration surveys. In this paper, the authors’ main concern is the handling of quality assurance in census fieldwork or, in other words, the quality issues concerning the data collection of a very large scale survey. Their contribution is to demonstrate the adequacy of deploying a control system based on a strategic performance management framework, such as the BSC.
The BSC was introduced in the early 1990s by Robert Kaplan and David Norton (Kaplan and Norton 1992; 1993). It is a strategic planning and management system for aligning business
activities with company strategy by monitoring organizational performance vis-à-vis strategic goals. A metaphorical description suggested by Kaplan and Norton is “the scorecard is an airplane cockpit providing the pilot with detailed information about several aspects of the flight” (Kaplan and Norton 1992, 71). Anthony and Govindarajan (2001, 72) describe the BSC as a performance measurement system that “fosters a balance among different strategic measures in an effort to achieve goal congruence.” Therefore, the concept is not of a control tool, but rather a strategic tool to help managers look ahead. In addition, the BSC not only shows what is achieved, but also how the results are attained.
Kaplan and Norton created a whole landscape of services around the new tool by allying academic credibility to proximity to the “real world,” thus convincing potential adopters (Roberts, Albright, and Hibbets 2004). Evidence suggests, for example, that by 2001 between 30 and 60 percent of large U.S. firms and 44 percent of organizations worldwide had adopted the BSC (57 percent in the United Kingdom, 46 percent in the United States, and 26 percent in Germany and Austria). By the end of 2004, 85 percent of organizations had performance measurement system initiatives underway (Rigby 2001; 2005, Silk 1998; Speckbacher, Bischof, and Pfeiffer 2003).
the BSC model (Zavodna 2013). It has been used extensively in business and industry, government, and profit and nonprofit organizations (Marr 2009) to align business activities to organizational strategy.
Despite this impressive take up, the BSC model has also been criticized and questioned. Speckbacher, Bischof, and Pfeiffer (2003) point out that 8 percent of 174 companies from German-speaking countries decided not to implement a performance measurement system (and a balanced scorecard in particular) because they could not see the advantages or positive impact, especially given the implementation effort required. Nørreklit (2000; 2003) and Nørreklit, Jacobsen, and Mitchell (2008) argue that the BSC belongs to a category called management guru texts, more built upon rhetoric than convincing evidence, characterized by talking to the emotions of the readers, where authors often lean back on their own authority to back up their statements. Nørreklit states that Kaplan and Norton take for granted several cause-effect relationships (for example, increased customer satisfaction leads to increased customer loyalty and automatically leads to improved financial performance), that the dominance of a short-term financial perspective can create a gap between strategy development and implementation, and that an overdose of measures in the scorecard can make follow-up complicated.
Nevertheless, the BSC has also been used for measuring performance other than the
mainstream role of strategy management. Recent literature has shown BSC was used to measure the level of innovation in the metallurgy industry (Blacha and Brzóska 2016), measure and optimize nursing performance (Jeffs et al. 2011), propose a suitable framework for assessing hospital performance (Matos and Ramos 2009; Trotta et al. 2012), provide a sustainable performance assessment tool for forensic laboratories (Houck et al. 2012), develop a flexible framework to be applied to waste utilities (Guimarães, Simões, and Marques 2010), and mediate intellectual property rights conflicts (Smandek et al. 2010). Moreover, the BSC was also used as a tool for risk
management (Oliveira 2014). In education, many other examples can be found, such as Hunt et al. (2016), who used the BSC as a tool to enhance the learning process in a business course or as a
framework for curriculum design development, as reported by Hidayat et al. (2015) and
Hladchenko (2015), and as a tool for teachers’ performance evaluation, as recommended by Hughes II and Pate (2013).
This paper is organized as follows. In the next two sections, the authors describe the overall fieldwork operation in the census 2011 and the fieldwork quality assurance strategy. The authors then summarize the main concepts of the BSC methodology together with the requirements for its implementation. Next, they offer a description on the construction and the implementation of the BSC to manage the fieldwork of census 2011. Finally, the authors present and analyze some results of their fieldwork in relation to BSC planning. The final section presents the main conclusions, discusses the practical implications of the adoption of BSC in the Portuguese Census 2011, and highlights some suggestions for future research.
PROCESS OVERVIEW
The fieldwork process of the census 2011 included the sequential distribution, completion, and collection of questionnaires across Portugal, organized administratively in 303 municipalities encompassing 4260 civil parishes. The fieldwork operation process was planned at the parish level, though the enumeration work was organized by statistical sections within each parish. Each
statistical section corresponds to a geographical area averaging about 300 dwellings. In each parish, data were collected on three statistical units – the individuals, the dwellings, and the buildings.
The logistics of the fieldwork operation included: 1) setting up a backup structure; 2) production of questionnaires and instruction manuals for all levels of the study; and 3) delivery of materials to the parishes. There were also training programs for the involved personnel, from the top coordinating units to parish-level enumerators.
The Fieldwork Organization and Control System (FOCS) is an information system that was specifically developed for monitoring the progress of the fieldwork operation. This system, whose
during the study. The parish coordinators could only see their own data. Higher-level coordinators – municipal, regional, and national – inspected the progress status concerning their own level.
In addition to the housing and population enumeration, Statistics Portugal used the decennial census to update its master address list and mapping system. The enumerators carried out several operations to complete the updating activities of the master address file and mapping system. In general, the activities in these operations were mostly the same: listing new housing units and updating the existing address/map information. The enumerators canvassed geographic areas (usually blocks) to update the address lists and maps by making corrections, adding new housing units or map features, or deleting housing units or map features that no longer existed. This was an important task, since it contributed to better coverage of the statistical sections for the deployment of the census operation.
A particular point worth mentioning is that for the first time Portuguese citizens were able to respond to the census questionnaires via the Internet – e-census – as an alternative to the traditional self-administered paper questionnaire, which required the in-person distribution and collection of the questionnaires by enumerators.
FIELDWORK AND ERROR CONTROL
Detecting and correcting errors while running the census operation is internationally recommended (United Nation 2008), and the fieldwork process is the central and decisive task of the census operation. Thus, it is of great importance to ensure the quality of the census data. The focus on the fieldwork supervision is to monitor and evaluate the proper implementation of procedures carried out by the enumerators so as to assure a quality data collection.
Three testing and training operations were conducted annually beginning in 2009 to
investigate the organizational details, to ensure the quality of training materials and programs, and to collect the necessary information for planning the QA system. In those testing operations, many different kinds of errors were studied, remedial cures were rehearsed, and errors were catalogued
for fast detection and correction during the real operation. The faulty situations were classified into two groups: coverage error and content error. Coverage error concerns the difference between the actual counting and the expected counting of statistical units. Content error relates to
inconsistencies collected with the questionnaires.
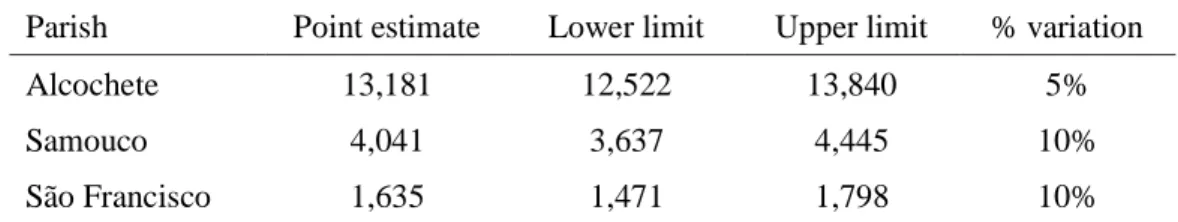
To ease the control of coverage error the authors developed a mechanism to inspect the validity of the enumeration count called the Alert Indicator System (AIS). This is a statistics-based system containing expected counts of individuals and dwellings at the parish level. The AIS comprises a set of interval estimates of the number of individuals and the number of dwellings in each parish on the reference day of the census, calculated through a regression model with 2001 census data and supplemented with administrative data from 2001 to 2010. This tool is reserved for parish coordinating staff to determine whether the counts presented by the enumerators are
trustworthy. The estimation of the control intervals for the counting of individuals was built in the following way: a) taking the value for the population from the last census (the 2001 census) as the first observation; b) taking the estimates for the population in each parish between 2002 and 2008 by considering the annual variation rate of the population at the municipal level in which each parish belongs; and c) calculating the series obtained for 2001 to 2008 and applying a linear regression model to estimate the population at the parish level in 2009, 2010, and 2011 (corrected with inputs from natural balance and migration variation records). For 2011, only 25 percent of the annual variation was considered, since the census reference day (March 21) was near the end of the first trimester of the year. From this point on, an interval of acceptable values was defined, taking into consideration the following rule: 1) in parishes with fewer than 500 estimated inhabitants the interval width was defined as ±20 percent variation from the estimated point; 2) in parishes with fewer than 1000 and more than 500 estimated inhabitants, the interval width is defined as ±15 percent variation regarding the point estimate; 3) in parishes with fewer than 5000 and more than 1000 estimated inhabitants, the interval width was defined as ± 10 percent variation regarding the
point estimate; and 4) in parishes with more than 5000 estimated inhabitants, the interval width was defined as ±5 percent variation around the point estimate.
The tolerances were determined in the resampling process to determine the error of the 2001 census. The reliability analysis was done by using the Census Pilot Test, which was conducted in 2010.
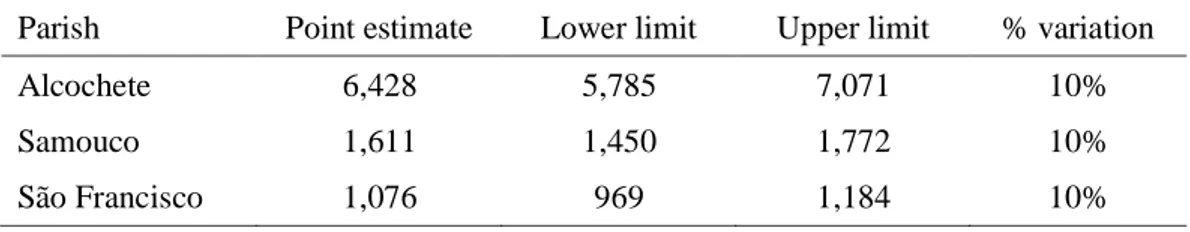
The estimation of the control intervals for counting of dwellings was built based on the construction and house demolition data made available by Statistics Portugal for the period from 2001 to 2010. With these data, a linear trend regression model was made. Subsequently, an interval of acceptable values was defined, taking into consideration the following rule: 1) in parishes with more than 400 estimated dwellings, the interval width was defined as ±10 percent variation around the point estimate; 2) in parishes with no more than 400 estimated dwellings, the interval width was defined as ±15 percent variation around the point estimate (Statistics Portugal 2001).
Table 1 and Table 2 show the AIS intervals for individuals and dwellings, estimated for three selected parishes: Alcochete, Samouco, and São Francisco. These are parishes of the municipality of Alcochete. The point estimates come from the regression models, and the lower and upper limits are obtained by the percentage of variation allowed regarding the point estimate.
In the enumeration work, the counts of individuals and dwellings fell within the estimated intervals provided by AIS; if, by chance, should any count fall outside the interval, the reasons were investigated until an acceptable explanation could be delivered. Every time the enumeration data were uploaded, the AIS validated the data such that the coordinating teams might take corrective action if needed.
QUALITY ASSURANCE FRAMEWORK
The QA framework for the fieldwork operation was conceived using a BSC. In this section, the BSC model is explained with adaptations the authors made to suit their specific purposes.
The BSC is a system focused on information about activities related to the implementation of a strategy, which is purported to provide managers a tool for measuring performance (Kaplan and Norton 1992) in organizations whose intangible assets are essential to their achievement. In simple words, the essential purpose of the BSC is to translate strategy into measures that clearly
communicate the vision to the organization.
Kaplan and Norton’s (1996) model of the BSC is based on setting four perspectives of performance measurement, which are determinants for the organization’s strategy: financial, customer, internal process, and learning and growth. The financial perspective covers the financial objectives of an organization and allows managers to track financial success and shareholder value. The customer perspective covers customer-related objectives and allows managers to track
customer satisfaction, market-share goals, and product and service attributes. The internal process aspect covers internal operational goals and outlines the key processes necessary to meet customer-related objectives. The learning and growth objective covers the intangible drivers of future success such as human capital, organizational culture, and leadership. The overall census strategic
framework was shaped into four perspectives: 1) perception; 2) budget stability; 3) fieldwork excellence; and 4) data handling for accuracy, as illustrated in Table 3.
In this paper, because their objective was to discuss the census fieldwork quality assurance, the authors kept their focus solely on “fieldwork excellence” and the critical stages of the fieldwork operation, since the quality of the final product is greatly determined by the efficient
accomplishment of a set of sequential and interrelated processes of enumeration.
THE BSC APPROACH
Using BSC, performance control started with the definition of the strategic framework. Subsequently, the definition of strategic objectives, measures, and targets (and respective tolerances) and, finally, the initiatives to be carried out for achieving the objectives. BSC also
requires the definition of initiatives related to the targets. The initiatives must be consistent with the objectives and fit in relevant metrics.
Strategic Framework
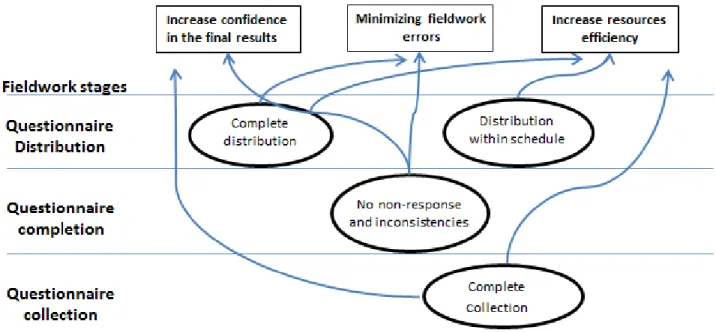
According to the 2011 census program defined by the Census Office of Statistics Portugal (Statistics Portugal 2007), an excellent fieldwork performance would comprise the following three strategic goals: 1) increase confidence in the final results; 2) improve the final product quality by minimizing errors; and 3) increase resource efficiency, that is, increase the rapid availability of information and cost savings.
Definition of Objectives
The translation of the strategic goals into objectives is done during the different stages of the fieldwork operation, and their relationships are illustrated in Figure 1.
The main tasks in the fieldwork operation include: 1) the exhaustive coverage of all statistical units – buildings, dwellings, households, and individuals; and 2) the collection of complete and consistent data. In addition, fieldwork operations had to be completed within a predefined time schedule. All these tasks were conceived to fit into the following three stages (see Figure 1), each with its own strategic objectives:
1. Questionnaire distribution: This stage had two main objectives: a) to ensure every household received the questionnaires, and b) to ensure the questionnaires were distributed within the planned time period.
2. Questionnaire completion: The objective of this stage was to have completed questionnaires without item nonresponse and inconsistent information. Item
nonresponse occurs when individuals fail to answer one or more questions, either on purpose or inadvertently. Inconsistencies may arise if the skipping patterns of the questionnaires are not respected, or if the question is not correctly understood or
responded to in an adverse way. The quality of completion can also be affected by fraudulent work by the enumerators; that is, the enumerators fill the questionnaires without contacting the households.
3. Questionnaire collection: The paper questionnaires were to be collected in person by the enumerators from all households within a predefined time period. One of the most important aspects of this stage was to make sure enumerators succeeded in contacting every household.
Definition of Measures and Targets
In the BSC approach, the objectives are translated into measureable items. The measures allow the various stages of the fieldwork process to be monitored; therefore, they had to be: a) clear, precise, and measurable; b) easy to obtain throughout the process (for example, via an electronic application); c) consistent and reflect, quantitatively, the vision and objectives associated with the process; and d) specified by measurement unit (absolute, percentages, averages, and deviations).
The measures associated with each strategic objective were defined with a target to be achieved and a tolerance that corresponded to a predefined allowed variation around the target. Outcomes that fell outside the tolerance range were a sign of concern and required additional checks.
The consequences of not accomplishing the objectives had to be identified for each critical stage of the fieldwork to define the measures that best monitor the attainment of the objectives:
1. Questionnaire distribution: The potential for error at this stage could lead to a delay in collecting the questionnaires and, consequently, could delay the end date of the fieldwork operation. Additionally, there is a potential for error leading to miscounting of the dwellings, households, and individuals at the parish level.
2. Questionnaire completion: The potential for error in this stage could lead to miscounting of buildings, households, and individuals at the parish level, as well as incorrect
characterization of buildings.
3. Questionnaire collection: The potential for error at this stage could lead to a delay in the end date of the fieldwork operation. Additionally, the potential for error in this stage could lead to miscounting of households and individuals at the parish level. The accomplishment of the questionnaire collection phase can be affected by the difficulty in finding people at home and in the refusal of some of the population to cooperate.
All the tasks and initiatives were to be carried out at the parish level; therefore, the measures were generally set at this level. To have an overall picture of certain critical ongoing processes, some measures were set at the national level.
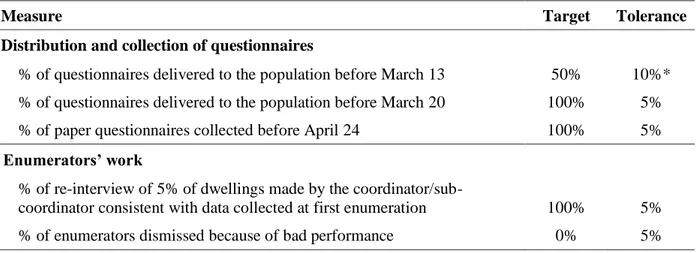
Table 4 presents the measures and respective targets and tolerances set for the critical steps of the fieldwork process at the parish level. The measures were classified into two groups so as to clearly identify their distinct underlying activities. The first – distribution and collection of
questionnaires – comprised three measures, expressed in percentage terms, and intended to measure the quality of the logistics of questionnaire distribution and collection during the course of the fieldwork. The second group – enumerators’ work – comprised two measures intended to quantify the quality of the enumerator’s work in its two main facets: questionnaire content and parish coverage.
It was also possible to monitor the fieldwork process at the national level by assessing the situation reports regarding enumeration coverage at the parish level. The aggregation of the information from all the parishes allowed assessment of the overall quality of the fieldwork at the national level.
The Census Office of Statistics Portugal monitors the exhaustive enumeration of dwellings and individuals at the national level. This information is relevant for the governing bodies of the
entire census process because the real-time knowledge of the progress of fieldwork enhanced confidence and guaranteed the reliability of the entire organizational system.
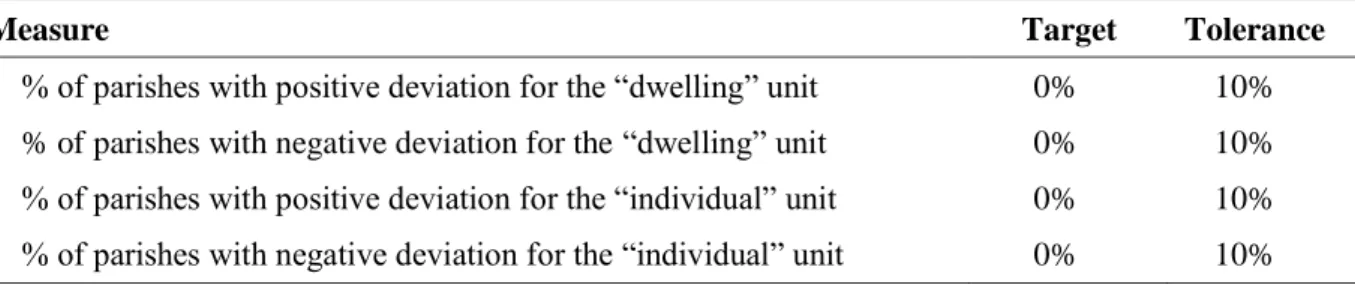
Table 5 provides the measures and respective targets and tolerances set for the fieldwork process at the national level. There are four measures, expressed in percentage terms, that intend to measure the quality of the enumeration coverage for dwellings and individuals: percent of parishes with positive deviations for the dwelling unit, percent of parishes with negative deviations for the dwelling unit, percent of parishes with positive deviations for the individual unit, and percent of parishes withnegative deviations for the individual unit. For all the measures, the target was set at 0 percent with a tolerance of 10 percent; that is, the quality standards are attained if, at most, 10 percent of the 4260 parishes present deviations (either positive or negative) that exceed the limits of the AIS intervals (Statistics Portugal 2010b).
Definition of Initiatives
The accomplishment of the fieldwork objectives required all processes to take place according to the planned schedule and to provide immediate detecting measures for the relevant outstanding issues. The results of the initiatives had to be represented by the measures defined for the fieldwork process. As a logical consequence, the entire fieldwork operation had to be continuously monitored, controlled, and improved, which meant a series of actions had to be implemented at each critical stage of the fieldwork operation.
Distribution of the questionnaires to the population Questionnaires were delivered to citizens in
person, or they were dropped off in a mailbox if no family member was present when the
enumerator visited the household. This initial contact with the households was compulsory and was done by the enumerators. Each enumerator was given a statistical section within the parish and visited all the households in that area in person with the following expectations: The enumerator
should deliver one dwelling questionnaire, one household questionnaire, and individual questionnaires to each resident.
The census questionnaire consisted of four parts: the building questionnaire, the dwelling (either private or collective) questionnaire, the household/family (either private or institutional) questionnaire, and the individual questionnaire. Each household also received an access code to the e-census in case they wished to answer the census online.
One of the most important aspects of this stage was to assure enumerators succeeded in contacting all the households to deliver the questionnaires while missing no one. If the enumerator could not find someone at the dwelling on the first attempt, he or she had to return to the same address on a different day or time. The enumerators were also encouraged to get information from the neighbors to know if a dwelling was empty or occupied. Questionnaires were delivered to the population from March 7 to March 20. QA initiatives were necessary at this stage, since the overall quality of the census data depended on the coverage achieved at the parish level, and the
accomplishment of the subsequent stages was totally dependent on the timely delivery of questionnaires to every household.
The distribution process was supported by a document called the “Building Cover Page,” and it was part of the enumerator’s reference pack. The completed “Building Cover Page” provided confirmation of whether the statistical section handed to the enumerator had been exhaustively canvassed (the number of dwellings recorded by the enumerator should be within the interval provided by the AIS).
Completion of questionnaires QA initiatives were needed to ensure complete and consistent
information was collected about the buildings, dwellings, households, and the individuals in every parish. The QA initiatives aimed at monitoring the quality of the collected data – complete and consistent information on all statistical units – were done first by the enumerator when visiting the households to collect the questionnaires. In questionnaires that were completed by
self-administration of the individuals, the enumerator had to check the responses to verify any missed questions. When errors were detected, the enumerator had to make the corrections immediately in the presence of the household member.
In a second phase, the QA initiatives were taken by the parish coordinator aimed at
monitoring the quality of collected data. For each statistical section completed and handed over to the coordinator, a systematic random sample of 5 percent of the households was reviewed for re-interviewing purposes. The re-interview questionnaire, specially designed to verify enumerators’ work, contained just three questions, which were chosen due to their high overall consistency (Statistics Portugal 2010a): 1) dwelling occupation type; 2) how many persons were living in the dwelling on March 21; and 3) how many rooms each dwelling has. The re-interview questionnaire was to be administered in person or by telephone and preferably answered by the same person who answered the census questionnaires.
When the responses of the re-interview did not coincide with those collected at the first enumeration, the coordinator had to find reasons for the deviations and, depending on the causes, act accordingly. It was established that: a) if deviations were found in more than 5 percent of the statistical section, corresponding to 10 to 20 re-interviews, depending on the size of the parish, the enumerator would be dismissed or provided with individual retraining sessions. The statistical section that was handed to that enumerator had to be re-enumerated and questionnaires from the first enumeration discarded; b) if deviations were found in no more than 5 to 10 re-interviews the enumerator would be corrected. The statistical units where deviations were detected had to be re-enumerated and the questionnaires from the first enumeration discarded; c) if fraud was detected, the enumerator was dismissed.
The QA measure defined for monitoring the quality of the questionnaire completion process was the “percentage of re-interview of 5 percent of dwellings made by the
the first enumeration and those of the re-interview. The tolerance was empirically set at 5 percent, for possible unpredictable errors due to respondent’s misinterpretation of the questionnaires or any other form of error from the enumerator.
The QA measure defined for monitoring the quality of the enumerators’ work in terms of coverage was the “percentage of enumerators dismissed because of bad performance” (see Table 4). The target was set at 0 percent; that is, no enumerator would be dismissed because of bad
performance with an empirical stated 5 percent tolerance corresponding to the inevitability of having bad enumerators.
Collection of completed questionnaires The logistics of this phase depended heavily on the way
citizens chose to respond to the census: via e-census or self-administered paper questionnaire. In the first case, the enumerator would receive an email message on his or her mobile phone after a
successful electronic submission of the questionnaire. Those who decided to respond via the e-census had to complete and upload the questionnaire between March 21 and April 10. If the self-administered paper questionnaire was chosen, the enumerators had to make a second visit to the household to collect the completed questionnaire.
QA initiatives were required at this stage because the overall quality of census data depended on the exhaustive coverage of the parish. The accomplishment of the census process subsequent to the fieldwork was dependent on the timely collection of questionnaires from every household.
It was also important to control the time taken to complete the collection of questionnaires in each parish at this stage. The QA measure selected for this purpose was the “percentage of paper questionnaires collected before April 24” (see Table 4). The target was set at 100 percent; that is, the goal was to have all dwellings, households, and individuals in each parish enumerated before April 24. A tolerance of 5 percent was allowed, as some delay was anticipated in collecting the questionnaires due to hard-to-contact households.
QA ANALYSIS
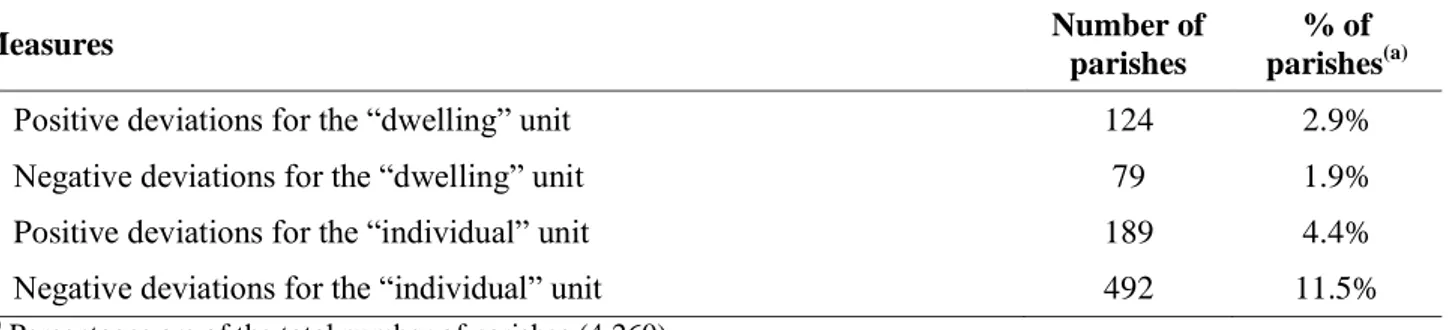
An overall evaluation was made to determine how successfully the objectives set for the fieldwork operation were met. This was done by comparing the final enumeration, at the national level, obtained from the census operation with the targets defined by the QA system (see Table 5). Table 6 presents the actual number and percentage of parishes with positive or negative deviations when counting the dwellings and the individuals (Statistics Portugal 2011).
Results show the overall objectives set for the fieldwork stage were met. The percentage of parishes with deviations from the expected counts, either positive or negative, was below the 10 percent established by the tolerance levels, with the exception of the enumeration of the individuals (which 11.5 percent of the parishes produced negative deviations). Less than 3 percent of the parishes presented positive or negative deviations for the dwellings.
All deviations from the estimated intervals were double checked, and the reasons for the deviations were identified by the parish coordinator. Most of the observed deviations were found to be acceptable and were due to changes in the geographical boundaries of the parishes.
CONCLUSIONS
The fieldwork involved the distribution, completion, and collection of the questionnaires. Time was a critical factor at all stages. The overall quality objectives set for the fieldwork operation were the exhaustive coverage of all statistical units – buildings, dwellings, households, and
individuals – and the collection of complete and consistent data. Error detection during the course of the fieldwork was crucial to final data quality. Therefore, the entire fieldwork operation had to be continually monitored, controlled, and improved to assure quality. In practical terms, this objective was attained by implementing a series of QA initiatives and metrics at each critical stage of the fieldwork operation.
The BSC approach was used as a QA strategy. For its accomplishment, a census strategic framework was established with four perspectives: citizen perception, budget stability, fieldwork excellence, and data handling accuracy.
For the fieldwork process, the entire BSC scheme was operationalized together with AIS intervals in the specially designed information system FOCS. The AIS helped to control coverage error. The AIS allowed the coordination staff to evaluate deviations at the parish level. When the deviations fell outside the AIS estimated intervals, it indicated a possible procedural error that had to be analyzed so as to identify the causes for the deviations. Once identified, corrective measures were implemented in the parish prior to the final completion of the fieldwork, thus assuring the quality of the parish’s fieldwork.
The overall results, at the national level, show the objectives set for the fieldwork stage were achieved. The percentage of parishes with positive or negative deviations from the limits of the expected intervals, both for the number of dwellings and individuals, was low. Only for individuals was the percentage of parishes with negative deviations higher than 10 percent. Acceptable reasons were found for each of these deviations, most of which came under the category “changes of the parish geographical boundaries.”
Traditional censuses are highly resource intensive. Internationally, countries are continuing to introduce technological and methodological innovations to make conducting a census more
efficient, thus responding to the challenges of producing high-quality data while controlling costs. Simultaneously, there is increasing concern over quality of information, privacy, technology, respondent burden, decreasing participation, availability of alternative information sources, and the strong demand for more frequent and more detailed information
Increasing census complexity and the need for cost reduction in future census operations point to the importance of developing and implementing the BSC model as a framework for the quality assurance strategy of all perspectives, including the strategic goals of transforming citizens into census collaborators and achieving a cost-effective budget management.
Acknowledgements
This article is part of the “Quality Assessment and Control Program of the 2011 Census,” a joint project of Statistics Portugal and Instituto Universitário de Lisboa (ISCTE-IUL).
REFERENCES
Anthony, R., and V. Govindarajan. 2001. Management control systems. Boston: McGraw Hill.
Beer, M., and R, Eisenstat. 2000. The silent killer of strategy implementation and learning. Sloan
Management Review (Summer):29-40.
Biemer, P. B., H. Woltmann, D. Raglin, and J. Hill. 2001. Enumeration accuracy in a population census: An evaluation using latent class analysis. Journal of Official Statistics, no. 17:129-148.
Biemer, P., and L. Lyberg. 2003. Introduction to survey quality. New Jersey: Wiley.
Biemer, P., and R. Casper. 1994. Continuous quality improvement for survey operations: Some general principles and applications. Journal of Official Statistics, no. 10:307-326.
Blacha, L., and J. Brzóska. 2016. The use of the balanced scorecard in evaluating the results of the innovations implemented in metallurgical companies. Metallurgija, no. 55:790-792.
Collins, M., and W. Sykes. 1999. Extending the definition of survey quality. Journal of Official
Statistics, no. 15:57-66.
Guimarães, B., P. Simões, and R. C. Marques. 2010. Does performance evaluation help public managers? A balanced scorecard approach in urban waste services. Journal of Environmental
Hidayat, M., C. I. Musa, S. Haerani, and I. Sudirman. 2015. The design of curriculum development based on entrepreneurship through balanced scorecard approach. International Education
Studies, no. 8, no. 11:123-138.
Hladchenko, M. 2015. Balanced scorecard: A strategic management system of the higher education institution. International Journal of Educational Management, no. 29, no. 2:167-176.
Houck, M., P. J. Speaker, A. S. Fleming, and R. A. Riley Jr. 2012. The balanced scorecard: Sustainable performance assessment for forensic laboratories. Science & Justice, no. 52, no. 4: 209-216.
Hughes II, K. E., and G. R. Pate. 2013. Moving beyond student ratings: A balanced scorecard approach for evaluating teaching performance. Issues in Accounting Education, no. 28, no. 1:49-75.
Hunt, I., R. K. Taylor, A. Winter, J. J. Mackie, and D. Fisher. 2016. Using the balanced scorecard to enhance undergraduate education in a first year business course: A pilot study. Journal of
Education for Business, no. 91, no. 3:132-137.
Imai, M. 1986. Kaizen: The key to Japan’s competitive success. New York: McGraw-Hill.
Isaki, C., L. Schultz, G. Diffendal, and E. Huang. 1988. On estimating census undercount in small areas. Journal of Official Statistics, no. 4:95-112.
Jeffs, L., J. Merkley, S. Richardson, J. Eli, and M. McAllister. 2011. Using a nursing balanced scorecard approach to measure and optimize nursing performance. Nursing Leadership, no. 24, no. 1:47-58.
Kaplan, R., and D. Norton. 1992. The balanced scorecard: Measures that drive performance.
Harvard Business Review, no. 70:71-79.
Kaplan, R., and D. Norton. 1993. Putting the balanced scorecard to work. Harvard Business
Review, no. 71:134-142.
Kaplan, R., and D. Norton. 1996. Using the balanced scorecard as a strategic management system.
Harvard Business Review, no. 74:75-85.
Kaplan, R., and D. Norton. 2000. Having trouble with your strategy? Then map it. Harvard
Business Review, no. 78:167-176.
Kaplan, R., and D. Norton. 2001. The Strategy-focused organization. Boston: Harvard Business School Press.
Kaplan, R., and N. Klein. 1996. Chemical bank: Implementing the balanced scorecard, case studies
from Harvard Business School: Implementing the balanced scorecard. Boston: Harvard Business
School Publishing.
Lyberg, L., P. Biemer, M. Collins, E. De Leeuw, C. Dippo, N. Schwarz, and D. Trewin, eds. 1997.
Marr, B. 2009. Managing and delivering performance: How government, public sector and
not-for-profit organizations can measure and manage what really matters. Oxford:
Butterworth-Heinemann.
Matos, L., and I. Ramos. 2009. Medir para Gerir. O Balanced Scorecard em Hospitais. Lisbon: Edições Sílabo.
Nørreklit, H. 2000. The balance on the balanced scorecard: A critical analysis of some of its assumptions. Management Accounting Research, no. 11:65-88.
Nørreklit, H. 2003. The balanced scorecard: What is the score? A rhetorical analysis of the balanced scorecard. Accounting, Organizations and Society, no. 28:591-619.
Norreklit, H., M. Jacobsen, and F. Mitchell. 2008. Pitfalls in using the balanced scorecard. Journal
of Corporate Accounting & Finance, no. 19:65-68.
Oliveira, H. C. 2014. The balanced scorecard operating as a risk management tool. Review of
Economic Studies and Research Virgil Madgearu, no. 7, no. 2:41-57.
Olve, N., J. Petri, and S. Roy. 2003. Making scorecards actionable. Stockholm: Wiley.
Pforsich, H. 2005. Does your scorecard need a workshop? Strategic Finance, no. 86:31-35. Redfern, P. 2003. Estimating census undercount by demographic analysis: New approaches to the
Richardson, S. 2004. The key elements of balanced scorecard success. Ivey Business Journal, no. 69:7-9.
Rigby, D. 2001. Management tools and techniques: A survey. California Management Review, no. 43:139-160.
Rigby, D. 2005. Management tools. Boston: Bain & Co.
Roberts, M., T. Albright, and A. Hibbets. 2004. Debiasing balanced scorecard evaluations.
Behavioral Research in Accounting, no. 16:75-88.
Silk, S. 1998. Automating the balanced scorecard. Management Accounting, no. 79:38-44.
Smandek, B., A. Barthel, J. Winkler, and P. Ulbig. 2010. Balanced score card implementation for IP rights management in a public research institution. Measuring Business Excellence no. 14, no. 4:65-75.
Speckbacher, G., J. Bischof, and E. Pfeiffer. 2003. A descriptive analysis on the implementation of Balanced Scorecards in German-speaking countries. Management Accounting Research, no. 14:361-387.
Statistics Portugal. 2001. Metodologia do Sistema de Indicadores de Alerta, 2001. Lisbon: Gabinete dos Censos, INE.
Statistics Portugal. 2007. Programa de Acção para os Censos 2011. Lisbon: Gabinete dos Censos, INE.
Statistics Portugal. 2010a. Censos 2011 Inquérito Piloto: Relatório da Operação. Lisbon: Gabinete dos Censos, INE.
Statistics Portugal. 2010b. Censos 2011 Plano de Controlo e Avaliação da Qualidade-Controlo do
Processo Produtivo. Lisbon: Gabinete dos Censos, INE.
Statistics Portugal. 2011. Avaliação do Sistema de Indicadores de Alerta Censos 2011 (SIA2011). Lisbon: Gabinete dos Censos, INE.
Thompson, A., and A. Strickland. 2001. Strategic management: Concepts and cases. Boston: McGraw-Hill.
Trotta, A., E. Cardamone, G. Cavallaro, and M. Mauro. 2012. Applying the balanced scorecard approach in teaching hospitals: A literature review and conceptual framework. The International
Journal of Health Planning and Management, no. 28, no. 2:181-201.
United Nations. 2008. Principles and recommendations for population and housing censuses, revision 2. New York: United Nations.
Zavodna, L. S. 2013. Sustainability as a part of balanced scorecard. Global Economic Observer, no. 1, no. 1:110-116.
BIOGRAPHIES
Álvaro Rosa, PhD. Assistant Professor of Management at Instituto Universitário de Lisboa
(ISCTE-IUL), Department of Marketing, Operations and Management, Lisbon, Portugal and Researcher at Business Research Unit – Management and Strategy Group (BRU-IUL). Main areas of research: Quality Management, Strategy, Corporate Governance, International Management.
Elizabeth Reis, PhD. Full Professor of Statistics and Data Analysis at Instituto Universitário de
Lisboa (ISCTE-IUL), Department of Quantitative Methods for Management and Economics, Lisbon, Portugal and Researcher at Business Research Unit – Research Methods Group (BRU-IUL). Main areas of research: Multivariate Statistics, Segmentation Methods, Survey and Census Methodology.
Paula Vicente, PhD. Assistant Professor of Statistics and Data Analysis at Instituto Universitário
de Lisboa (ISCTE-IUL), Department of Quantitative Methods for Management and Economics, Lisbon, Portugal and Researcher at Business Research Unit – Research Methods Group (BRU-IUL). Main areas of research: Survey and Census Methodology, Market and Social Research.
Table 1 AIS individuals’ interval estimates for selected parishes
Parish Point estimate Lower limit Upper limit % variation
Alcochete 13,181 12,522 13,840 5%
Samouco 4,041 3,637 4,445 10%
Table 2 AIS dwelling interval estimates for selected parishes
Parish Point estimate Lower limit Upper limit % variation
Alcochete 6,428 5,785 7,071 10%
Samouco 1,611 1,450 1,772 10%
Table 3 Census 2011 Balanced Scorecard perspectives Perception
Strategic goal: Citizen as census collaborator
Budget stability
Strategic goal: Cost-effective budget management
Fieldwork excellence
Strategic goals:
Increase confidence in the final results Minimizing fieldwork errors
Increase resources’ efficiency
Data handling for accuracy
Strategic goals:
Optimize resources’ deployment
Table 4 Measures, targets and tolerances for fieldwork process at parish level
Measure Target Tolerance
Distribution and collection of questionnaires
% of questionnaires delivered to the population before March 13 50% 10%* % of questionnaires delivered to the population before March 20 100% 5% % of paper questionnaires collected before April 24 100% 5%
Enumerators’ work
% of re-interview of 5% of dwellings made by the
coordinator/sub-coordinator consistent with data collected at first enumeration 100% 5% % of enumerators dismissed because of bad performance 0% 5%
Table 5 Measures, targets, and tolerances for the fieldwork process at national level
Measure Target Tolerance
% of parishes with positive deviation for the “dwelling” unit 0% 10% % of parishes with negative deviation for the “dwelling” unit 0% 10% % of parishes with positive deviation for the “individual” unit 0% 10% % of parishes with negative deviation for the “individual” unit 0% 10%
Table 6 Number and % of parishes with deviations for the dwellings and individuals at the national level Measures Number of parishes % of parishes(a)
Positive deviations for the “dwelling” unit 124 2.9%
Negative deviations for the “dwelling” unit 79 1.9%
Positive deviations for the “individual” unit 189 4.4%
Negative deviations for the “individual” unit 492 11.5%
(a)