Repositório ISCTE-IUL
Deposited in Repositório ISCTE-IUL:2018-05-14
Deposited version:
Post-print
Peer-review status of attached file:
Peer-reviewed
Citation for published item:
Dionísio, A. , Menezes, R. & Mendes, D.A. (2006). Entropy-based independence test. Nonlinear Dynamics. 44 (1-4), 351-357
Further information on publisher's website:
10.1007/s11071-006-2019-0
Publisher's copyright statement:
This is the peer reviewed version of the following article: Dionísio, A. , Menezes, R. & Mendes, D.A. (2006). Entropy-based independence test. Nonlinear Dynamics. 44 (1-4), 351-357, which has been published in final form at https://dx.doi.org/10.1007/s11071-006-2019-0. This article may be used for non-commercial purposes in accordance with the Publisher's Terms and Conditions for self-archiving.
Use policy
Creative Commons CC BY 4.0
The full-text may be used and/or reproduced, and given to third parties in any format or medium, without prior permission or charge, for personal research or study, educational, or not-for-profit purposes provided that:
• a full bibliographic reference is made to the original source • a link is made to the metadata record in the Repository • the full-text is not changed in any way
Entropy-Based Independence Test
Andreia Dionísio*, Rui Menezes** and Diana A. Mendes**
*Management Department, University of Évora, Largo dos Colegiais, 2, 7000 Évora, Portugal, Author for correspondence (Tel:+351266740892, email: andreia@uevora.pt). **ISCTE, Av. Forcas Armadas, 1649-026 Lisboa, Portugal (email: rui.menezes@iscte.pt; diana.mendes@iscte.pt).
Abstract. This paper presents a new test of independence (linear and nonlinear) among distributions, based
on the entropy of Shannon. The main advantages of the presented approach are the fact that this measure does not need to assume any type of theoretical probability distribution and has the ability to capture the linear and nonlinear dependencies, without requiring the specification of any kind of dependence model.
Key words: Entropy, independence test, mutual information, nonlinear serial dependence, stock index
mar-kets.
1. Introduction
The notion of "independence", "distance" and "divergence" between distributions has been central in statistical inference and econometrics from the earliest stages. This is also evident in the work of Kullback and Leibler, H. Jeffreys, H. Akaike, E. Shannon, Hartley, A. Renyi, E. Maasoumi, C. Granger, H. White, A. Zellner and many others (see Maasoumi [8]). Some authors, such as Cover et al. [1] and Maasoumi [8], moved by the "elegance" and the potential power of information theory, brought a new way of interpretation and motivation for the research in statistical inference. In addition, the axiomatic systems in information theory suggest principles of decomposition that distinguish between different information functions and "entropies", and identify desirable measures, decision criteria and indices (Maasoumi [8]).
Several measures have been used as independence tests and/or dependence measures in this field. The most known measure of dependence between random variables is the Pearson correlation coefficient.
How-ever, this is nothing but a normalized covariance and only accounts for linear (or linearly transformed) rela-tionships (see e.g. Granger et al. [4], Maasoumi et al. [9]). In general, this statistic may not be helpful to capture serial dependence when there are nonlinearities in the data. In this context, it seems that a measure of global dependence is required, that is, a measure that captures both linear and nonlinear dependencies with-out requiring the specification of any kind of model of dependence. Urbach [11] defends a strong relation-ship between entropy, dependence and predictability. This relation has been studied by several authors, namely Granger and Lin [4], Maasoumi and Racine[9], Darbellay and Wuertz [3]. On the basis of the above arguments we aim to evaluate in this paper the efficiency of a new entropy-based independence test without requiring the specification of mean-variance models and theoretical distribution probabilities. Thus, in the next section we discuss the subject of information and predictability in the context of entropy, and we then illustrate our test using evidence based on empirical financial data.
2. Information and Predictability
A measure that takes the value 0 when there is total independence and 1 when there is total depend-ence is one of the most practical ways to evaluate (in)dependdepend-ence between two vectors of random variables
X,Y. Let pX,Y
(
A B×)
be the joint probability distribution of (X,Y) and pX( )
A , pY( )
B the underlying marginal probability distributions, whereA
is a subset of the observation space of X andB
is a subset of the observation space of Y, such that we can evaluate the following expression:(
)
( ) ( )
ln p A B . p A p B × X,Y X Y (1)If the two events are independent, thenpX,Y
(
A B×)
= pX( ) ( )
A pY B , and so equation (1) will be equal to zero.Granger, Maasoumi and Racine [5] consider that a good measure of dependence should satisfy the fol-lowing six "ideal" properties:
1. It must be well defined both for continuous and discrete variables;
2. It must be normalized to zero if X and Y are independent, and, in general, lye between -1 and +1; 3. The modulus of the measure should be equal to 1 if there is an exact nonlinear relationship between
the variables;
4. It must be similar or simply related to the linear correlation coefficient in the case of a bivariate nor-mal distribution;
5. It must be a metric in the sense that it is a true measure of "distance" and not just a measure of "diver-gence";
6. It must be an invariant measure under continuous and strictly increasing transformations.
Now, consider two vectors of random variables (X,Y). Let
p
X,
p
Y andp
X,Y be the probabilityden-sity function (pdf) of X, Y and the joint probability distribution of (X,Y), respectively. Denote byH X
( )
,(
)
H X, Y and H Y X
(
|)
the entropy of X, the joint entropy of the two arguments (X,Y) and the conditional entropy of Y given X. Then, mutual information can be given defined by the following expression:(
)
(
)
(
)
( )
( )
(
)
(
)
( ) ( )
(
)
| , , ln . I H H H H H p x y p x y dxdy p x p y = − = + − =∫∫
X,Y X,Y X Y X, Y X, Y Y X X Y X, Y (2)SinceH
( )
X ≥H(
Y X|)
, we haveI(
X, Y)
≥0, assuming the equality iff X and Y are statisticallyin-dependent. Thus, the mutual information between the vectors of random variables X and Y can be consid-ered as a measure of dependence between these variables or, even better, the statistical correlation between X and Y.
The statistic defined in equation (2) satisfies some of the desirable properties of a good measure of de-pendence ([see Granger et al. [5]). In equation (2), we have0 I≤
(
X, Y)
≤ ∞, which renders difficult the comparisons between different samples. In this context Granger and Lin [4] and Darbellay [2], among others, use a standardised measure for the mutual information, the global correlation coefficient, defined by(
)
2 ( )1 I
e
λ
= − − X,YX, Y . This measure varies between 0 and 1 being thus directly comparable with the
lin-ear correlation coefficient
r
, based on the relationship between the measures of information theory andanalysis of variance. The function λ captures the overall dependence, both linear and nonlinear, between X and Y.
According to the properties displayed by mutual information, and because independence is one of the most valuable concepts in econometrics, we can construct a test of independence based on the following hypothesis:
( )
( ) ( )
( )
( ) ( )
0 1 : , ; : , . H p x y p x p y H p x y p x p y = ≠ X,Y X Y X,Y X YIf
H
0, then I(
X, Y)
=0 and we conclude that there is independence between the variables. IfH
1, then(
)
0I X, Y > and we reject the null hypothesis of independence. The above hypothesis can be reformulated
as follows:
(
)
(
)
0: 0; 1: 0.
H I X, Y = H I X, Y >
In order to test adequately for the independence between variables (or vectors of variables) we need to calculate the corresponding critical values. In our case, we have simulated critical values for the null distri-bution or the percentile approach.1
One of the problems with calculating mutual information from empirical data lies in the fact that the underlying pdf is unknown. There are, essentially, three different methods for estimating mutual information: histogram-based estimators; kernel-based estimators; parametric methods. According to Kraskov, Stogbauer and Grassberger [6] and Moddemeijer [10], the most straightforward and widespread approach to estimate mutual information consists of partitioning the supports of X and Y into bins of finite size, i.e. using histo-gram-based estimators. The histohisto-gram-based estimators are divided in two groups: equidistant cells (see e.g. Moddemeijer [10]) and equiprobable cells, i.e. marginal equiquantisation (see e.g. Darbellay [2]). The sec-ond approach, marginal equiquantisation, has some advantages, since it allows for a better adherence to the data and maximizes mutual information (Darbellay [2]).
The definition of mutual information is expressed in an abstract way and it is based on space partitions. To simplify, let us consider a finite dimension Euclidian space, d
=
dA×
dB, and let{ }
1{ }
2 X 1 Y 1 n n i i j j A = B =Γ = Γ = be two generic partitions of the subspaces dX
and dY
. Then the mutual
in-formation is a positive number defined as:
(
)
{ }{ }(
)
(
)
( )
( )
, sup log . i j i j i j A B i j i j P A B I P A B P A P B × ≡ × ×∑
X,Y X,Y X Y X, Y (3)The supremum is taken over all finite partitions of dX and dY. The conventions 0ln
( )
0 0z = for 0
z≥ and zln
( )
z0 = +∞ were used. Darbellay [2] shows that mutual information is finite iif the measurep
X,Y is absolutely continuous with respect to the product measurep
X( )
A p
i Y( )
B
j . The systemΓ = Γ × Γ
X Y is a partition ofd d
d
=
X×
Y and is the product of two marginal partitions, one of dXand the other of dY
.
Marginal equiquantisation consists of dividing each edge of a cell intoα
(α
=2,usually) intervals with approximately the same number of points. The approximativeness of the division has two causes: the number of points in a cell may not be exactly divisible by α, or some X may take repeating values (for more details see for example Darbellay [2]).
The mutual information and the global correlation coefficient (λ) almost satisfy the property of a good measure of dependence here presented, but they are not measures of "distance", since they don't verify the triangle inequality. Kraskov, Stogbauer, Andrzejak, and Grassberger [7] present a modified mutual informa-tion-based measure, such that the resulting is a metric in strict sense. According to these authors, this modifi-cation presents some difficulties when we deal with continuous random variables. One solution for this prob-lem consists of dividing mutual information by the sum or by the maximum of dimensions of the continuous variable in study (Kraskov et al. [7]).
3. Empirical Evidence
We now apply the concepts of mutual information and global correlation coefficient as measures of dependence in financial time series, in order to evaluate the overall performance of these measures and to extract the advantages of this approach face to the traditional linear correlation coefficient. Mutual informa-tion was estimated through marginal equiquantisainforma-tion, and was applied to a number of stock market indexes. From the data base DataStream we selected the daily closing prices of several stock market indexes: ASE (Greece), CAC 40 (France), DAX 30 (Germany), FTSE 100 (UK), PSI 20 (Portugal), IBEX 35 (Spain) and S&P 500 (USA), spanning the period from 4/01/1993 to 31/12/2002, which corresponds to 2596 obser-vations per index, in order to compute the rates of return.
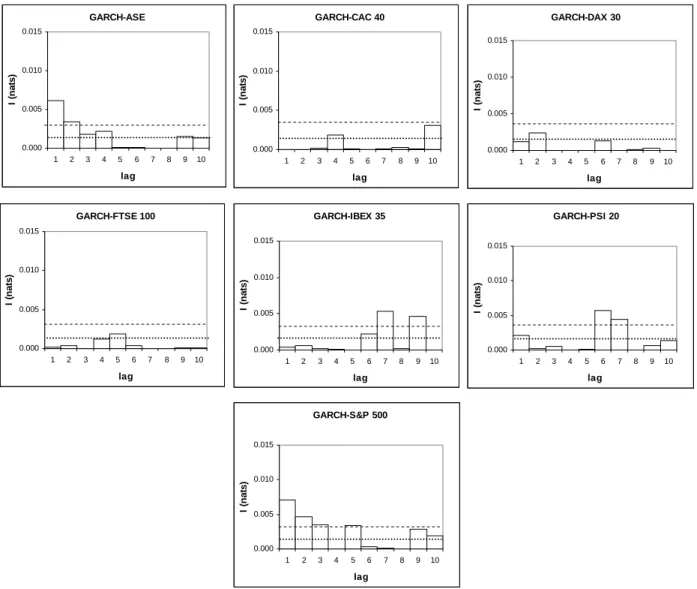
We filtered all the time series with ARMA(p,q) processes in order to eliminate the linear serial depend-ence. In order to isolate the possible sources of nonlinear dependence, namely the heteroscedasticity, we filtered all the time series through GARCH(p,q) processes. The new time series did not reject the null of homocedasticity for the Engle test and the McLeod and Li test. According to the results of the BDS test ap-plied to this new time series, the nonlinear serial dependence disappear, since the null is not rejected in any case. We calculate the mutual information for the time series filtered from the GARCH effects. The results are presented in the Figure 1.
Figure 1. Mutual information for the rate of returns of the filtered GARCH effects indexes stocks for the lags
1,...,10.
k
=
. The dashed line is the 1% critical value (0,0030 nats) and the point line is the 5% critical value for the mutual information (0,0015 nats) with 2 degrees of freedom.We should note the presence of values of mutual information statistically significant for some lags in all the indexes, denoting the presence of nonlinear dependence for those lags.
The results obtained for the mutual information allow us to identify possible lags relatively to which it is necessary to proceed with a detailed analysis, in attempting to identify the type of nonlinearity. It is in-ferred to here, that the sources of captured nonlinearity won't be just the existence of nonlinearity in the mean and heteroscedasticity. Mutual information does not provide guidance about the type of nonlinearity, but it
GARCH-ASE 0.000 0.005 0.010 0.015 1 2 3 4 5 6 7 8 9 10 lag I ( n at s) GARCH-DAX 30 0.000 0.005 0.010 0.015 1 2 3 4 5 6 7 8 9 10 lag I ( n at s) GARCH-PSI 20 0.000 0.005 0.010 0.015 1 2 3 4 5 6 7 8 9 10 lag I ( n at s) GARCH-IBEX 35 0.000 0.005 0.010 0.015 1 2 3 4 5 6 7 8 9 10 lag I ( n a ts ) GARCH-FTSE 100 0.000 0.005 0.010 0.015 1 2 3 4 5 6 7 8 9 10 lag I ( n ats) GARCH-S&P 500 0.000 0.005 0.010 0.015 1 2 3 4 5 6 7 8 9 10 lag I (n at s) GARCH-CAC 40 0.000 0.005 0.010 0.015 1 2 3 4 5 6 7 8 9 10 lag I (n at s)
informs about which are the "most problematic" lags and on the level of existent nonlinear dependence through the calculation of the global correlation coefficient (λ).
To conclude, we can say that the main advantage of the application of mutual information to financial time series is the fact that this measure captures the global serial dependence (linear and nonlinear) without requiring a theoretical probability distribution or specific model of dependency. Even if this dependence is not able to refute the efficient market hypothesis, it is important to the investor to know that the rate of return is not independent and identically distributed.
Notes
1. These values have been found through the simulation of critical values based upon a white noise, for a number of sample sizes. Given that the distribution of mutual information is skewed, we can adopt a percentile approach to obtain critical values.
Appendix A lists the 90th, 95th and 99th percentiles of the empirical distribution of the mutual information for the process
t t
y
=
ε
with
ε
t ∼i i d N. . .( )
0,1 , having been made 5000 simulations for each critical value. This methodology was applied as proposed by Granger, Maasoumi and Racine [5], and according to these authors, the critical values can be used as the base to test for time series serial independence.4. Appendix A
Tables of critical values for testing serial independence through mutual information for N
( )
0,1 data. 5000 replications were computed. D.F. are the degrees of freedom for the mutual information, which corre-spond to the dimension (d) of the analysed vectors.N=100 Percentiles D.F 90 95 99 2 0.0185 0.0323 0.0679 3 0.1029 0.1232 0.1933 4 0.1059 0.1260 0.1722 5 0.2290 0.2580 0.3261 6 0.6639 0.7528 0.9663 7 0.8996 0.9731 1.1586 8 1.3384 1.3839 1.5024 9 1.9030 1.9352 2.0142 10 2.5266 2.5571 2.6181 N=500 Percentiles D.F 90 95 99 2 0.0037 0.0070 0.0144 3 0.0222 0.0369 0.0501 4 0.0680 0.0788 0.1128 5 0.1756 0.2066 0.2712 6 0.3084 0.3514 0.4390 7 0.4920 0.5391 0.6339 8 0.4477 0.4843 0.5659 9 0.6661 0.6941 0.7594 10 1.0884 1.1082 1.1483
N=1000 Percentiles D.F 90 95 99 2 0.0019 0.0041 0.0071 3 0.0133 0.0191 0.0311 4 0.0340 0.0399 0.0568 5 0.0708 0.0865 0.1128 6 0.2119 0.2430 0.3046 7 0.3635 0.3954 0.4688 8 0.4041 0.4414 0.5252 9 0.3865 04114 0.4640 10 0.6418 0.6585 0.6942 N=2000 Percentiles D.F 90 95 99 2 0.0009 0.0019 0.0033 3 0.0061 0.0094 0.0147 4 0.0169 0.0203 0.0278 5 0.0701 0.0804 0.1030 6 0.1370 0.1549 0.1940 7 0.2496 0.2733 0.3224 8 0.4497 0.4864 0.5508 9 0.3036 0.3298 0.3858 10 0.3530 0.3669 0.3996 N=2500 Percentiles D.F 90 95 99 2 0.0008 0.0015 0.0030 3 0.0054 0.0078 0.0129 4 0.0134 0.0171 0.0251 5 0.0556 0.0648 0.0797 6 0.1203 0.1376 0.1738 7 0.2181 0.2418 0.2884 8 0.3938 0.4217 0.4719 9 0.3175 0.3409 0.4024 10 0.2931 0.3124 0.3477
References
[1] Cover, T. and Thomas, J., Elements of Information Theory, Wiley, 1991.
[2] Darbellay, G., ‘An Adaptative Histogram Estimator for the Mutual Information’, UTIA Research Report, n.º 1889,
Acad. Sc., Prague, 1998.
[3] Darbellay, G. and Wuertz, D., ‘The Entropy as a Tool for Analysing Statistical Dependence's in Financial Time Series’, Physica A 287, 2000, 429-439.
[4] Granger, C. and Lin, J., ‘Using the Mutual Information Coefficient to Identify Lags in Nonlinear Models’, Journal
of Time Series Analysis 15, 1994, 371-384.
[5] Granger, C, E. Maasoumi e J. Racine, ‘A Dependence Metric for Possibly Nonlinear Processes’, Journal of Time
Series Analysis 25, 2004, 649-669.
[6] Kraskov, A., Stogbauer, H. and Grassberger, P., ‘Estimating Mutual Information’, preprint in
http://www.arxiv:cond-mat/0305641, 2003
[7] Kraskov, A., Stogbauer, H.; Andrzejak, R. and Grassberger, P., ‘Hierarchical Clustering Based on Mutual Informa-tion’, preprint in http://www.arxiv:q-bio.QM/0311039, 2004
1993, 137-181.
[9] Maasoumi, E. and Racine, J., ‘Entropy and Predictability of Stock Market Returns’, Journal of Econometrics 107, 2002, 291-312.
[10] Moddemeijer, R., ‘A Statistic to Estimate the Variance of the Histogram-Based Mutual Information Estimator on Dependent Pairs of Observations’, Signal Processing 75, 1999, 51-63.
[11] Urbach, R., Footprints of Chaos in the Markets - Analysing non-linear time series in financial markets and other