Vol.50, n. 2 : pp.311-319, March 2007
ISSN 1516-8913 Printed in Brazil BRAZILIAN ARCHIVES OF
BIOLOGY AND TECHNOLOGY
A N I N T E R N A T I O N A L J O U R N A L
Utilisation of Respirometry to Assess Organic Matter
Reduction of Effluents from the Camaçari Industrial
Complex (BA, Brazil)
Carla A. Oliveira1, Cristiano V. M. Araújo2*, Renato B. Nascimento1, Uwe J. Strotmann3
and Eduardo M. da Silva2
1
Instituto de Ciências Biológicas; Universidade Católica de Salvador; 40710-000; Salvador - BA - Brasil. 2Instituto de Biologia; Universidade Federal da Bahia; Campus de Ondina; 40170-115; Salvador - BA - Brasil. 3Department of Environmental Engineering; University of Applied Sciences; 45665 Recklinghausen; Germany
ABSTRACT
The treatment efficiency of industrial effluents, after biological treatment by activated sludge in aeration tanks (AT), was assessed through the utilisation of respirometry tests at the Cetrel’s-wastewater treatment plant (WTP). Samples of the equalised effluent (EE), prior to treatment, and of the treated effluent (TE), after treatment, were analysed. Twenty bioassays batch were carried out to AT (AT-2, AT-3 and AT-4). Each test consisted of: a basic test, a basic test with peptone added, a test using EE and a test using TE. The data showed that there was no statistically significant difference (p>0.05) in the respiration activity between the aeration tanks. Regarding the specific oxygen uptake rate there was a mean reduction of 70.8% between the tests performed with EE and TE. The results demonstratd that respirometry tests could successfully assess the efficiency of the activated sludge process and, therefore, be adopted as tool for the monitoring from the WTP.
Key words: Activated sludge, bacterial toxicity, oxygen uptake rate, wastewater treatment plant.
INTRODUCTION
Human activities generate domestic and industrial residues that may be adequately treated in wastewater treatment plant (WTP) to remove harmful pollutants, minimizing adverse effects to the environment, preventing pollution and protection public health (Fernández et al., 1995; Ratsak et al., 1996). The inadequate management of these residues can have harmful consequences to human health (Teixeira et al., 2005). Wastewater treatment is carried out by a combination of physical, chemical and biological methods, being activated sludge, the most used
biological treatment, due to its high performance (Pujol and Canler, 1992).
hydraulic residence time and a possible biological adaptation from the activated sludge organisms (Strotmann et al., 1995). The chemical and ecotoxicological characterisation of effluents, before and after treatment by activated sludge, is very important to assess the performance of WTP (Gutierrez et al., 2002). Therefore, the estimation of the toxicity of chemicals to micro-organisms in the sludge is an important criterion for evaluating the environmental risk of chemicals in wastewater, protecting the WTP from toxic shock loading (Strotmann et al., 1994; Strotmann and Pagga, 1996). Indeed, the toxicity of effluents measured in the sludge reflects the integrity of the biological processes, namely respiration, and may act as an effective and reliable indicator of treatment efficiency (Orupõld et al., 2001).
There is no doubt that respiration is an essential activity of aerobic bacteria and that the respiration inhibition test of activated sludge is a widely accepted parameter for monitoring activated sludge activity (Strotmann et al., 1995; Gendig et al., 2003). In this test, a decrease in dissolved oxygen concentration is recorded as a function of time. During the treatment of different kinds of substrates in industrial wastewater and due to different loads, oxygen consumption may vary considerably (Orupõld et al., 2001). When a toxicant is supplied to the activated sludge, the oxygen uptake by the micro-organisms may decrease, resulting in lower treatment efficiency or break down of the system (Kilroy and Gray, 1992; Gutierrez et al., 2002). Thus, the oxygen uptake rate (OUR) is considered to be the key parameter for estimation of aerobic microbial transformation (Vollertsen et al., 1999). According to Roš et al. (1988), biological oxygen uptake is closely related to substrate removal because it simulates the degradation processes that occur in the aeration tanks, from which the inoculum is obtained, providing a clear indication on the metabolism of the activated sludge (Dircks et al., 1999; Orupõld et al., 2001).
In this study, it was aimed to evaluate the efficiency of the WTP at the Camaçari Industrial Complex (CIC) (BA, Brazil) through the assessment of organic matter reduction, using the oxygen consumption inhibition test.
MATERIALS AND METHODS
The WTP of this study (12º46’06.7” and 38º06’59.4”) has been described by Araújo et al. (2005) and receives and processes effluents from the SID, consisting of 52 industries, working in different production sectors: chemical, petrochemical, metallurgy, cellulose and breweries, under tropical conditions.
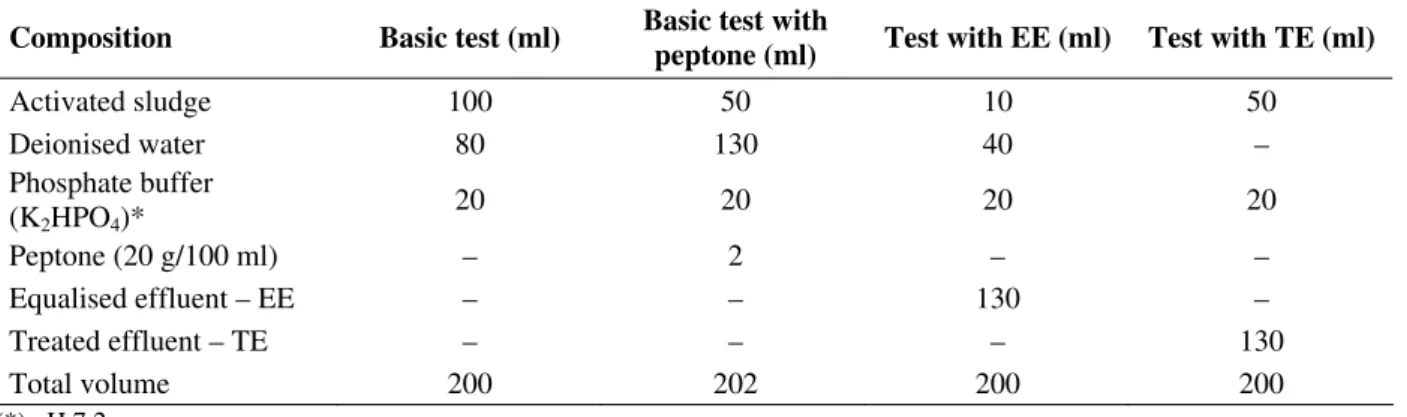
Short-term respiration assays were performed at 20 ± 2 ºC by a modification of the ISO 8192 method (ISO, 1986). Single samples of fresh activated sludge were daily obtained from the three aeration tanks, named as AT-2, AT-3 and AT-4 from the WTP, collected at 6:00 h, stored at 4 ± 2 ºC and assayed at the same day of collection. Effluent single samples were collected using amber glass flasks in the early hours of the day. Collections were performed prior treatment, at the exit of the equalisation basin (equalised effluent – EE), and after treatment, just before entering the outfall pipeline (treated effluent – TE), matching the hydraulic residence time of 24 h in the WTP. Mean values of the three tanks, to each effluent tested, were used to evaluate the efficiency of the WTP. Four test batches were carried out: basic test, basic test with peptone added, test with EE and test with TE (Table 1). Batch tests were aerated for at least 30 min to reach an oxygen saturation level. The initial oxygen concentration in the test vessels ranged from 6 to 8 mg l-1. In
order to assess the respiration activity, aeration was stopped and an oxygen electrode (WTW, model Inolab Oxi Level 2) was directly placed in the flasks. Readings were recorded every 30 s over a 5 min period. During the readings, the test vessel mixture was stirred continuously through a calibrated velocity magnetic stirrer for preventing sludge settleability. The oxygen uptake rate (OUR) defined as mg O2 consumed l-1 h-1 was calculated
100 x ΕΕ COD ΤΕ COD 1
RCOD
− − − = ) ( ) , ( test basic spOUR TE or EE peptone spOUR SF= 100 x ΕΕ spOUR ΤΕ spOUR 1
RspOUR
− − − =
Table 1 – Composition of the batch tests.
Composition Basic test (ml) Basic test with
peptone (ml) Test with EE (ml) Test with TE (ml)
Activated sludge 100 50 10 50
Deionised water 80 130 40 –
Phosphate buffer
(K2HPO4)* 20 20 20 20
Peptone (20 g/100 ml) – 2 – –
Equalised effluent – EE – – 130 –
Treated effluent – TE – – – 130
Total volume 200 202 200 200
(*) pH 7.2.
The specific oxygen uptake rate (spOUR), (the respiration rate per g of mixed liquor suspended solid-MSSL) was determined by dividing the respiration rate by the MLSS (APHA, 1998). The concentration of the activated sludge was expressed as MLSS according to APHA (1998). The spiking factor (SF) (Strotmann et al., 1999), an indicator of the stimulating activity, was calculated by the following formula:
Chemical oxygen demand (COD) analysis (closed reflux colorimetric method) according to APHA (1998) was carried out for all EE and TE samples to estimate its reduction (RCOD) during treatment
using the following formula:
The spOUR
reduction (RspOUR) between the EE and the TE was estimated
applying the formula:
Data were analysed statistically using Tukey’s test (p<0.05) when significant ANOVA results were
found (Zar, 1996).
RESULTS AND DISCUSSION
Biomass contents in the aeration tanks
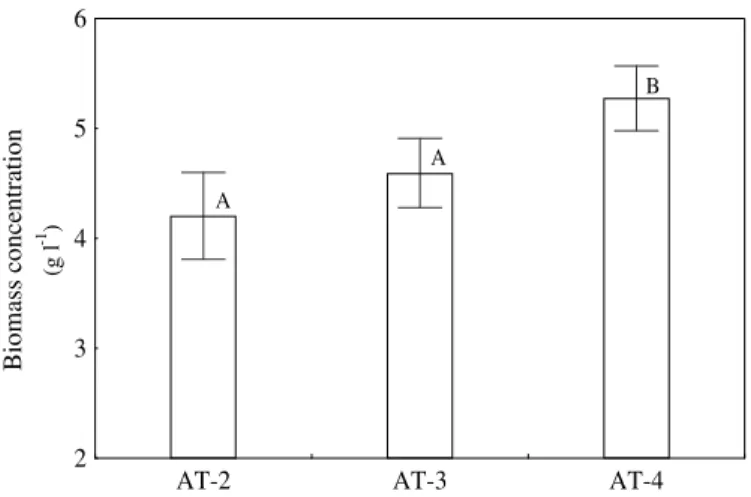
The mean values and respective 95% confidence
interval of the mixed liquor suspended solid loads of the AT-2, AT-3 and AT-4 were 4.20 (3.81– 4.60), 4.59 (4.28–4.91) and 5.27 (4.98–5.57) g l-1,
respectively (Fig. 1). There was a significant statistical difference (p<0.05) between the contents
of suspended solid of AT-2 and AT-4 and between AT-3 and AT-4.
Oxygen uptake rate (OUR)
The aim of the performance the basic test was to obtain an estimate of the basal respiration of the sludge in the aeration tanks, as for this test, no substance was added that incremented the respiration activity. The mean values and respective 95% confidence interval of sludge respiration activity in the basic test were 8.69 (6.67–10.72), 7.05 (4.83–6.28) and 7.67 (5.18– 10.16) mg O2 l-1 h-1 in the AT-2, AT-3 and AT-4,
respectively. No statistically significant difference (p>0.05) was found between the OUR results for
the tested aeration tanks.
Peptone was added in one of the test, due to its stimulatory effect to micro-organisms and to allow a more detailed analysis of the metabolism of substrate added (Dirks et al., 1999). Oxygen consumption for the AT-2, AT-3 and AT-4, peptone added test, were 16.65 (13.09–20.21), 13.77 (11.37–16.17) and 17.07 (14.2–19.93) mg O2 l-1 h-1, respectively, with no statistically
significant difference (p>0.05) between results, but
B
io
m
as
s
co
nc
en
tr
at
io
n
(g l
-1 )
2 3 4 5 6
AT-2 AT-3 AT-4
A A
B
Figure 1 - Mean values of suspended solid of the aeration tanks, and its respective confidence
interval (95%). Means followed by the same letter do not differ significantly (Tukey’s test, p<0.05)
The mean respiration activity of the ATs and its respective 95% confidence interval after addition of EE was 24.34 (19.26–29.43) in the AT-2, 20.56 (16.97–24.15) in the AT-3 and 24.70 (19.66– 29.75) mg O2 l-1 h-1 in the AT-4. In the EE test, the
oxygen consumption was higher than in both the basic test and the test with peptone added. On the other hand, the TE test showed a reduction in the oxygen consumption rate, that could be explained due to the reduced organic load in the TE, presenting a mean activity of 7.69 (5.92–9.46) in the AT-2, 6.84 (5.06–8.62) in the AT-3 and 7.51 (5.30–9.73) mg O2 l-1 h-1 in the AT-4. There was
no statistically significant difference (p>0.05)
between TE test results.
In general, in the peptone added and in the EE test, the sludge presented higher respiration activity. Inhibitory discharges could reduce the activated sludge activity, however the EE did not exhibit any toxicity to the sludge. On the order hand, a lower activity registered in the TE test reflected a lower biodegradable load, which indicated an efficient treatment in the aeration tanks.
Specific oxygen uptake rate (spOUR)
The results of specific oxygen uptake rate (spOUR) in the basic and peptone test and respective 95% confidence interval are presented in Fig. 2. The results with the basic test showed that the ATs presented a similar behaviour. The test with peptone increased the spOUR greater
than three times. These results indicated that micro-organisms were responding steadily to medium changes.
The spOUR results were higher in the EE test than in the TE test. These results indicated that the velocity of the oxygen consumption was much higher and proportional to the organic load present in the effluent. Regarding the EE test, the spOUR values presented a mean activity and respective 95% confidence interval of 26.69 (21.26–32.12), 20.87 (16.78–24.97) and 20.58 (17.72–23.44) mg O2 g MLSS-1 h-1 in the AT-2, AT-3 and AT-4,
respectively (Fig. 3). There was an increase in the respiration activity coupled with a wider confidence interval in all results. This could be attributed to changes in the composition of the incoming effluent, as far as organic matter was concerned. The TE test showed the lowest values for the spOUR. The AT-2, AT-3 and AT-4 presented a mean spOUR and respective 95% confidence interval of 7.45 (5.66–9.23), 6.66 (3.73–9.59) and 5.77 (4.12–7.42) mg O2 g MLSS-1
h-1, respectively (Fig. 3). A reduction in the width
S
pe
ci
fi
c
ox
yg
en
u
pt
ak
e
ra
te
(m
g
O2
g
M
L
S
S
-1 h -1 )
0 3 6 9 12 15 18 21
AT-2 AT-2 AT-3 AT-3 AT-4 AT-4
(basic test) (peptone) (basic test) (peptone) (basic test) (peptone)
A
A A
B
B B
Figure 2 - Results for the spOUR of the aeration tanks in the basic test and test with peptone
added, and their respective confidence interval (95%). Means followed by the same letter do not differ significantly (Tukey’s test, p<0.05).
S
peci
fi
c
ox
yg
en
u
pt
ak
e
rat
e
(m
g
O2
g
M
L
S
S
-1 h -1)
0 5 10 15 20 25 30 35
AT-2 AT-2 AT-3 AT-3 AT-4 AT-4
(EE test) (TE test) (EE test) (TE test) (EE test) (TE test) A
A A
B B
B
Figure 3 - Results for spOUR of the aeration tanks in the test with EE and TE, and their respective
confidence interval (95%). Means followed by the same letter do not differ significantly (Tukey’s test, p<0.05).
During the treatment of industrial wastewater, different loads released showed different oxygen uptake rates (Orupõld et al., 2001). Similarly, the composition of the microbial biomass could show certain variation (Kilroy and Gray, 1992). In order to achieve an efficient aerobic treatment, a sufficient amount of oxygen must be supplied
The MLSS content in the AT-4 was statistically different from the other tanks, with lower activity. On the order hand, the AT-2 presented lower MLSS content and, in general, had higher activity. This lower concentration of MLSS did not correspond to a lower sludge activity. Usually, the concentration of mixed liquor suspended solids is used to estimate the amount of micro-organisms in the activated sludge (Yokoi et al., 1999), especially when no information is available about estimation of microbial numbers (Orupõld et al., 2001). However, a few other components (protozoan, micro-algae, nematode, rotifer), apart from living and dead micro-organisms, make up the suspended solids (Rosenwinkel et al., 2001).
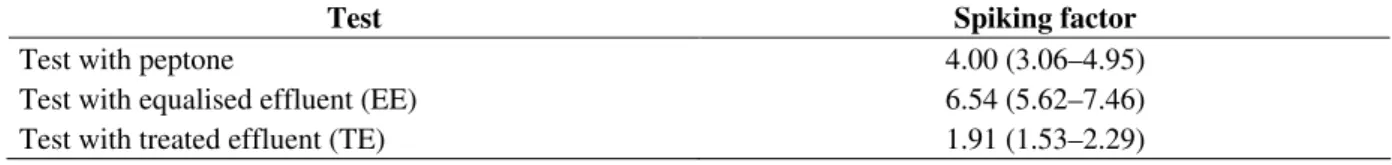
Spiking of respiration activity
The spiking factor calculated for the three tests is summarised in Table 2. The data showed that the stimulatory effect was increased in the presence of higher organic load. It was possible to observe that the EE presented higher stimulation potential, followed by peptone and by TE addition. The spiking factor importance arises from the fact that, it allows a clear respiration profile, thus reflecting the capacity of the sludge to response to eventual respiratory effects (Strotmann et al., 1999). Lower respiratory activities of the tanks and lower spiking factors in the TE tests can be due to reduction of the biodegradable compounds after treatment, which results in a reduced toxicity from the WTP (Araújo et al., 2005). No evidence of activated sludge inhibition was detected.
Table 2 - Mean values of the spiking factor of the tests and its 95% confidence interval.
Test Spiking factor
Test with peptone 4.00 (3.06–4.95)
Test with equalised effluent (EE) 6.54 (5.62–7.46)
Test with treated effluent (TE) 1.91 (1.53–2.29)
Activity respiration and chemical demand oxygen (COD) reduction
The difference between the spOUR values of the tests with EE and TE added to the three aeration tanks were 65.7 (51.0–80.4), 71.6 (62.5–80.8) and 75.1 (65.2–85.0) % in the AT-2, AT-3 and AT-4, respectively, with a mean reduction of 70.8%. Although AT-4 presented higher organic load reduction, all tanks presented similar respiration activity. In a study with Microtox at this WTP during the same period, Araújo et al. (2005) found a mean toxicity reduction of 92.71%. Several authors have shown that Microtox test is more sensitive to the action of toxicants than respirometry (Kilroy and Gray, 1992; Dalzell et al., 2002; Ricco et al., 2004). On the other hand, respirometry seems to be more accurate than Microtox to assess the toxicity reduction at this WTP, since it is a more direct method for assessing sludge activity and thus toxicity to sludge (Ren, 2004) and the whole microbial
community is involved in the process, instead of only one organism (Vibrio fischeri), in the
Microtox test.
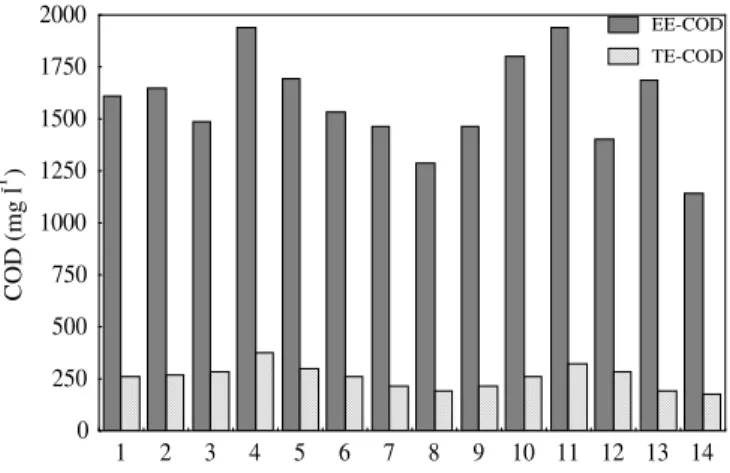
Due to the importance of COD reduction in the activated sludge process as it represented the quality of the wastewater treatment (Ubay Çokgör et al., 1998; Baker et al., 1999; Vidal et al, 1999; Reis and Nozaki, 2000; Teixeira et al., 2005), the COD of each effluent treatment step was assessed. EE and TE-COD mean values were 1,576.4 (1,444.5-1,708.4) and 257.7 (226.2-289-1) mg l-1
(Fig. 4). The organic load reduction due to the treatment process ranged between 80-90% based on COD determination, with a mean reduction of 83.6%.
C
O
D
(
m
g
l
-1 )
0 250 500 750 1000 1250 1500 1750 2000
1 2 3 4 5 6 7 8 9 10 11 12 13 14 EE-COD TE-COD
Figure 4 - EE and TE-COD values.
This could be due to the natural higher variation from the EE-COD, as mentioned by Araújo et al. (2005). Biological processes, such as aerobic respiration are similar to all sorts of organisms. Therefore, the results found here could be indicative that the toxicity for all sort of organisms (including animals) would also be reduced. In Ecotoxicology, as a general rule, data is normally extrapolated from some tests for the whole biological community. Otherwise, for every substance or even effluent combination, a huge battery of tests would be necessary to assess any toxicity.
CONCLUSIONS
It was possible to conclude that the aeration tanks (AT-2, AT-3 and AT-4) presented similar respiration activity. The reduction of 70.8% in the specific oxygen uptake rate, between the equalised and treated effluents, indicated the efficiency of the activated sludge in reducing effluent toxicity of the CIC. In general, the equalised effluents could be considered non-inhibitory to activated sludge. The COD reduction of 83.6% between the equalised and treated effluents indicates also a reduction due to the respiratory activity of the activated sludge.
Industrial effluent treatment plants in Brazil do not take into account the toxicity of raw effluent. This study demonstrated how important such studies could be in determining toxicity, as the main aim of effluent treatment is to reduce toxicity effects for the biological communities.The monitoring of
the aeration tank is essential to balance the treatment efficiency and its normal activity (Strotmann et al., 1995). Besides, the results obtained are most accurate due to the involvement of the sludge microbial community and fast. In order to assess the efficiency of the aerobic treatment and control of the activated sludge process, the oxygen consumption inhibition test could be adopted as routine tool in the monitoring from the WTP.
ACKNOWLEDGEMENTS
This work was partially funded by RHAE-Training Program of Human Resources for Strategic Activities (Process 610666/99-9) from the Brazilian Research Council (CNPq).
CAPES (Brazilian Coordination of
Improvement of Personnel of Superior Level) and DAAD (The German Academic Exchange Service) provided an additional grant. CETREL S.A. provided all infrastructure and conditions for the laboratory work. The authors also acknowledge a grant from the Brazilian Research Council (Nº 620151/2004-8).
RESUMO
ativado em tanques de aeração (TA). Foram analisadas amostras do efluente equalisado (EE), antes do tratamento, e do efluente tratado (ET). Vinte baterias de ensaios foram realizadas com cada um dos TA (TA-2, TA-3 e TA-4). Cada bateria consistiu de um ensaio básico, contendo apenas o licor misto, um ensaio com adição de peptona, um ensaio com o EE e um com o ET. Não houve diferença estatística significativa (p>0,05) na atividade respiratória dos TA. Quanto à taxa de consumo de oxigênio específica houve uma redução média de 70,8% entre os ensaios realizados com EE e ET. Os ensaios de respirometria determinaram com eficiência o nível de tratamento através de lodo ativado, e deve ser adotado no monitoramento dos efluentes da estação de tratamento de efluentes do Pólo Industrial de Camaçari.
REFERENCES
APHA (1998), Standard Methods for the Examination of Water and Wastewater. 20th Ed. American Public Health Association, Port City Press, Baltimore, Maryland.
Araújo, C. V. M., Nascimento, R. B., Oliveira, C. A., Strotmann, U. J. and da Silva, E. M. (2005), The use of Microtox® to assess toxicity removal of industrial
effluents from the Industrial District of Camaçari (BA, Brazil). Chemosphere, 58, 1277-1281.
Baker, J. R., Milke, M. W. and Mihelcic, J. R. (1999), Relationship between chemical and theoretical oxygen demand for specific classes of organic chemicals. Water Res, 33, 327-334.
Brown, D. E. (1999), The operating line for activated sludge. Biotechnol Tech, 13, 185-186.
Dalzell, D. J. B., Alte, S., Aspichueta, E., de la Sota, A., Etxebarria, J., Gutierrez, M., Hoffmann, C. C., Sales, D., Obst, U. and Christofi, N. (2002), A comparison of five rapid direct toxicity assessment methods to determine toxicity of pollutants to activated sludge.
Chemosphere, 47, 535-545.
Dircks, K., Pind, P. F., Mosbaek, H. and Henze, M. (1999), Yield determination by respirometry – The possible influence of storage under aerobic conditions inactivated sludge. Water SA, 25, 69-74.
Fernández. A., Tejedor, C., Cabrera, F. and Chordi, A. (1995), Assessment of toxicity of river water and effluents by the bioluminescence assay using
Photobacterium phosphoreum. Water Res, 29,
1281-1286.
Forney, L. J., Liu, W. T., Guckert, J. B., Kumagai, Y., Namkung, E., Nishihara, T. and Larson, R. J. (2001), Structure of microbial communities in activated sludge: potential implications for assessing the biodegradability of chemicals. Ecotoxicol Environ Safety, 49, 40-53.
Gendig, C., Domogala, G., Agnoli, F., Pagga, U. and Strotmann, U. J. (2003), Evaluation and further development of the activated sludge respiration inhibition test. Chemosphere, 52, 143-149.
Gutierrez, M., Extebarria, J. and de las Fuentes, L. (2002), Evaluation of wastewater toxicity: comparative study between Microtox
and activated sludge uptake inhibition. Water Res, 36, 919-924. ISO 8192. (1986), Water quality – Test for inhibition of
oxygen consumption by activated sludge.
Kilroy, A. C. and Gray, N. F. (1992), The toxicity of four organic solvents commonly used in the pharmaceutical industry to activated sludge. Water Res, 26, 887-892.
Madoni, P., Davoli, D., Gorbi, G. and Vescovi, L. (1996), Toxic effect of heavy metals on the activated sludge protozoan community. Water Res, 30, 135-141.
Mulkerrins, D., Dobson, A. D. W. and Colleran, E. (2004), Parameters affecting biological phosphate removal from wastewaters. Environ Inter, 30, 249-259.
Orupõld, K., Maširin, A. and Toomas, T. (2001), Estimation of biodegradation parameters of phenolic compounds on activated sludge by respirometry.
Chemosphere, 44, 1273-1280.
Pujol, R. and Canler. J. P. (1992), Biosorption and dynamics of bacterial populations in activated sludge.
Water Res, 26, 209-212.
Ratsak, C. H., Maarsen, K. A. and Kooijman, A. L. M. (1996), Effects of protozoa on carbon mineralization in activated sludge. Water Res ,30, 1-12.
Reis, E. and Nozaki, J. (2000), Biological treatment of effluents of paper industry after flocculation and coagulation with aluminum salts and natural polyelectrolytes. Braz. Arch. Biol. Technol., 43:(1), 125-131.
Ren, S. (2004), Assessing wastewater toxicity to activated sludge: recent research and developments.
Environ Inter, 30, 1151-1164.
Ricco, G., Concett Tomei, M., Ramadori, R. and Laera, G. (2004), Toxicity assessment of common xenobiotic compounds on municipal activated sludge: comparison between respirometry and Microtox.
Water Res, 38, 2103-2110.
Roš, M., Dular, M. and Farkas, P. A. (1988), Measurement of respiration of activated sludge.
Water Res, 22, 1405-1411.
Rosenwinkel, K.-H., Weichgrebe, D., Meyer, H. and Wendler, D. (2001), Suspended solids from industrial and municipal origins. Ecotoxicol Environ Safety, 50,
Strotmann, U. J., Eglsãer, H. and Pagga, U. (1994), Development and evaluation of a growth inhibition test with sewage bacteria for assessing bacterial toxicity of chemical compounds. Chemosphere, 28,
755-766.
Strotmann, U. J., Keinath, A. and Hüttenhain, S. H. (1995), Biological test systems for monitoring the operation of wastewater treatment plants.
Chemosphere, 30, 327-338.
Strotmann, U. J. and Pagga, U. (1996), A growth inhibition test with sewage bacteria – results of an international ring test 1995. Chemosphere, 32,
921-933.
Strotmann, U. J. Geldem, A., Kuhn, A., Gendig, C. and Klein, S. (1999), Evaluation of a respirometric test method to determine the heterotrophic yield coefficient of activated sludge bacteria.
Chemosphere, 38, 3555-3570.
Tan, K. N. and Chua, H. (1997), COD adsorption capacity of the activated sludge – Its determination and application in the activated sludge process.
Environ Monitoring Ass, 44, 211-217.
Teixeira, A. C. S. C., Mendes, L., Stollar, G., Guardani, R. and Nascimento, C. A. O. (2005), Photo-fenton remediation of wastewater containing agrochemicals.
Braz. Arch. Biol. Technol., 48, 207-218.
Ubay Çokgör, E., Sözen, S., Orhon, D. and Henze, M. (1998), Respirometric analysis of activated sludge behaviour – I. Assessment of the readily biodegradable substrate. Water Res 32, 461-475.
Vidal, G., Soto, M., Méndez, R. and Lema, J. M. (1999), Influence of bleaching technologies on the aerobic biodegradability of effluents from eucalyptus kraft pulps factories. Braz. Arch. Biol. Technol., 42 :
(3), 323-329.
Vollertsen, J., Almeida, M. C. and Hvitved-Jacobsen, T. (1999), Effect of temperature and dissolved oxygen on hydrolysis of sewer solids. Water Res, 33,
3119-3126.
Yokoi, H., Wakasone, S., Nakashima, H., Nakashima, S., Hirose, J. and Takasaki, Y. (1999), Growth inhibition of activated sludge by humus. Biotechnol Tech, 13, 263-266.
Zar, J.H., 1996. Biostatistical Analysis. 3rd Ed., Prentice-Hall Int, Upper Saddle River, N.J., USA.