Characterizing and modelling the spatial
patterns of wildfire ignitions in Portugal:
fire initiation and resulting burned area
F. X. Catry
1, F. C. Rego
1, F. Moreira
1& F. Bacao
21Centre of Applied Ecology ‘Prof. Baeta Neves’, Institute of Agronomy,
Technical University of Lisbon, Portugal
2Institute of Statistics and Information Management,
New University of Lisbon, Portugal
Abstract
According to the statistics Portugal has the highest density of wildfire ignitions among southern European countries. The ability to predict ignition occurrence constitutes an important tool for managers, helping to improve the effectiveness of fire prevention, detection and fire fighting resources allocation. In this study we used a database with information about 127 490 fire ignitions that occurred in Portugal during a five year period. We performed frequency analysis to characterize the occurrence of wildfire ignitions in relation to both human and environmental variables and compared the spatial patterns of ignitions which originated fires larger or smaller than 500 ha. We also used logistic regression models to predict the relative probability of ignition occurrence, as a function of the resulting fire size. Results show that fire ignitions are strongly related to human presence and activity, and that the spatial patterns of ignitions are different for larger or smaller wildfires. Larger wildfires started in areas with lower population density, more distant from the main roads and at higher elevations, when compared to smaller fires, and also started more frequently in shrublands and forested areas. The results obtained can be useful in decision making for fire danger management.
Keywords: fire ignition, spatial patterns, logistic regression, wildfires, GIS, Portugal.
1 Introduction
Wildfires constitute a serious concern in the Mediterranean Basin, representing important social, environmental and economic impacts. Statistics show that Portugal has the highest density of ignitions among southern European countries, and that both the number of wildfire ignitions and the total area burned increased in Portugal during the recent decades [1].
The importance of knowing the spatial patterns of fire ignition is widely recognized, and the ignition risk is an essential element in analysing and assessing fire danger (e.g. [2–8]). Under similar fuel, topographic or weather conditions, the areas with higher ignition risk should be given priority for surveillance (e.g. [3, 7]). However, there are still several fire prevention plans and management decisions that are exclusively based on the factors influencing the fire spread and suppression difficulty.
Previous studies identified numerous factors influencing the spatial patterns of fire ignitions (e.g. [3, 7, 9–15]). Based on this knowledge and on the fact that the vast majority of contemporary wildfires in southern Europe are human-caused (e.g. [16, 17]), we concentrated our analysis on factors related to the human presence and activity, selecting a small group of easily obtainable variables that were hypothesized to influence the spatial patterns of fire occurrence, namely: population density, distance to roads, land cover type and elevation.
In a recent study [11] we analysed the influence of these variables on the spatial patterns of wildfire ignitions in Portugal and developed models to predict the likelihood of ignition occurrence. The best model was then used to produce a fire ignition risk map, giving an expected ignition frequency at each risk class. In the present study we concentrated our analysis on comparing the relative importance of each variable on the spatial distribution of fire ignitions as a function of the resulting burned area, using a database with 127 490 fire events that occurred in Portugal during a five years period and a set of layers corresponding to potentially explanatory variables.
2 Methods
2.1 Study area
The study area is constituted by the entire Portuguese mainland, which covers about 90 000 km2 in southern Europe. Most part of the country is included in the Mediterranean biogeographic region and there is a transition to the Atlantic region in the north. The elevation ranges from sea level to 2000 m. About 48% of the country area is used for agriculture, while forests and shrublands cover about 27% and 19% respectively. The population is estimated in about ten million inhabitants, more concentrated in the north and centre coastal areas [18]. 2.2 Geographic information
The background information used in this study was the official wildfire database from the Portuguese Forest Services (DGRF), containing the starting coordinates
(ignition) and the resulting burned area of 127 490 fires that occurred in Portugal between 2001 and 2005. Then we used geographic information systems (GIS) to prepare a set of cartographic layers corresponding to the following potentially explanatory variables:
a) Population density – this map was obtained by assigning the number of persons per km2 in each parish [18] to the official parish map;
b) Land cover – we used the Corine Land Cover 2000 [19]. The Portuguese cartography identifies 42 land cover classes, which were grouped into six major classes: 1) agriculture, 2) forests, 3) shrublands, 4) urban-rural interspersed areas, and 5) others;
c) Distance to roads – we used a map with the main national and regional roads [20] to calculated the distance (m) from each location of the territory to the nearest road;
d) Elevation – we used a digital elevation model (m) in raster format [21]. After these steps, the fire ignition database was transformed into a vector point map and overlayed with all the other maps in order to gather all the information into a single database, where each record contained the information of all the other layers.
2.3 Data analysis
In a first step we performed a frequency analysis to characterize the occurrence of fire ignitions in relation to the selected variables. For that purpose we established classes for each variable, and used chi-square statistics [22] to compare observed and expected frequencies. Special attention was given to compare ignitions that originated fires smaller or larger than 500 ha. Observed frequencies were the number of fire ignitions that occurred in each class, and the expected frequencies were represented by the number of ignitions that would occur in each class assuming a random spatial distribution.
In a second step, we used multivariate logistic regression to fit models to predict the probability of ignition occurrence as a function of resulting burned area. Logistic regression is a useful method to predict the presence or absence of a given characteristic or event, based on the values of a group of explanatory variables [23], and have been widely used by several authors to model fire occurrence [e.g. 3, 7, 10, 24, 25]. The dependent variable used in our analysis was the presence or absence of fire ignitions. For the presence we used the information concerning 127 490 ignition locations. An equal number of points was randomly generated within the whole country and considered as non-ignition locations. Since it is impossible to know the real proportion between ignition and non-ignition locations, the probability values given by the models represent relative probabilities.
The assessment of models significance and performance was done by means of Hosmer and Lemeshow goodness-of-fit test [23], and through ROC analysis [26]. The ROC method has advantages in assessing model performance in a threshold-independent fashion, being independent of prevalence [e.g. 27].
Continuous variables were much skewed, thus they were log (x+1) transformed to approach normality and reduce variance. All analyses were carried out using SPSS software [26].
3 Results
3.1 Wildfire frequencies
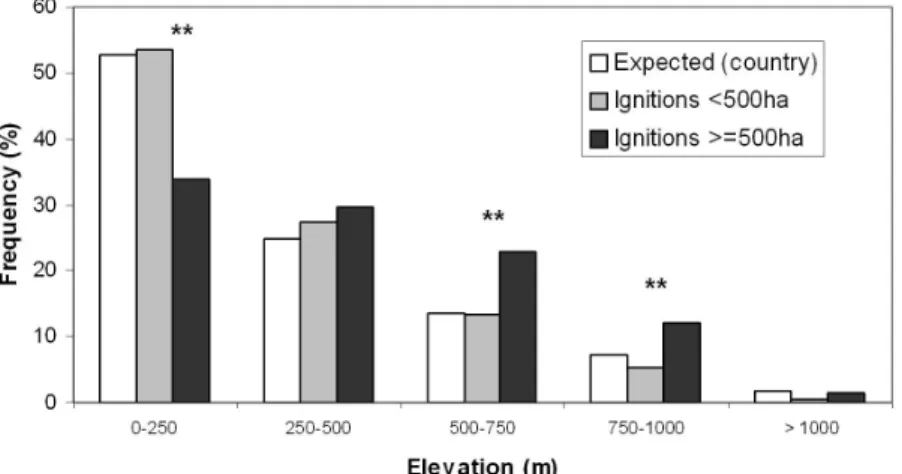
Comparison between expected and observed frequencies of fire ignitions in relation to the selected variables are presented in figures 1-2. The expected frequencies correspond to a situation where all ignitions would occur randomly in the country, and the observed frequencies are separated as a function of resulting area burned (ignitions which originated fires larger or smaller than 500 ha). We used chi-square homogeneity tests to compare the frequencies of expected and observed ignitions, and confirmed the existence of significant differences (P<0.001) in their spatial distribution in relation to all variables. The same procedure was used to compare (on each class) the frequencies between ignitions which originated fires larger or smaller than 500 ha, and the significant differences are shown in figures 1-2.
The chi-square test for population density showed that in general fire ignitions are more likely to occur on more populated areas. However there are great differences between ignitions that originated burned areas smaller or larger than 500 ha, with most part of larger fires starting in areas with comparatively lower population density. The frequency of ignitions also significantly depended on distance to roads, showing that ignitions are more likely to occur closer to the main roads, independently of the resulting fire size; however the frequency of larger fires starting at longer distances is significantly higher than for smaller fires. Land cover variable also influenced the occurrence of fire ignitions, showing that they are more likely to occur in agricultural and urban-rural interspersed areas. Results also show that the likelihood of large fire occurrence is significantly higher in woodlands and lower in urban-rural areas, when compared to small fires. Ignitions were also significantly affected by elevation, but the differences between observed and expected frequencies are much less obvious than in the other three variables. However significant differences were observed, showing that larger fires are more likely to start at higher altitudes than smaller fires.
3.2 Wildfire models
Logistic regression models were fitted to predict the likelihood of ignition occurrence as a function of the resulting burned area (greater than 0, 5, 50, 250 or 500 ha). The Hosmer and Lemeshow goodness-of-fit test showed adequate fit of the models to the data, and the area under the curve (AUC) ranged from 0.74 to 0.87, indicating reasonable to good model adjustment in predicting respectively larger and smaller wildfires. Results obtained show that the most influential variable explaining the spatial distribution of all fire ignitions (burned
Figure 1: Comparison between expected (random distribution) and observed wildfire frequencies in relation to different variables: land cover, population density, and distance to roads. Asterisks signal significant differences between fire ignitions that resulted in a burned area smaller or larger than 500 ha (based on the likelihood-ratio statistical test: * P<0.05, ** P<0.001).
Figure 2: Expected (random distribution) and observed wildfire frequencies in relation to elevation. Asterisks signal significant differences between fire ignitions that resulted in a burned area smaller or greater than 500 ha (based on the likelihood-ratio statistical test: ** P<0.001).
area > 0 ha) was population density, followed by land cover type, elevation, and distance to roads. However, this scenario changed for increasing fire sizes, and in the models concerning ignitions which resulted in larger fires (>250 or >500 ha), the most influential variable was distance to roads followed by land cover type, elevation, and population density.
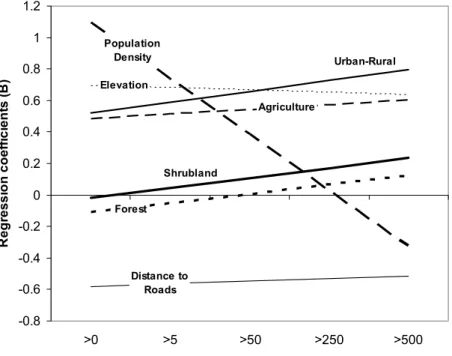
In order to include land cover type in this analysis and to quantify both the variation and the relative influence of each variable on fire ignition as a function of the resulting fire size, we also fitted logistic models using the original variables standardized. The obtained model coefficients were then plotted and trend lines (linear regression) were added for each variable to facilitate comparisons (figure 3).
Analysis of Spearman correlation coefficients, showed that only population density, shrubland and forest had highly significant increment/decline for different fire sizes (P<0.001), but agriculture and urban-rural areas also had significant variation (P<0.05).
4 Conclusions
We analysed and compared the influence of different factors on the spatial distribution of fire ignitions and verified that their influence changed as a function of the resulting burned area. The obtained results can be used to increase the ability of predicting wildfire occurrence and to help managers in defining priority areas for fire prevention campaigns, for vigilance and for fire fighting resources allocation.
Population Density Agriculture Forest Shrubland Urban-Rural Distance to Roads Elevation -0.8 -0.6 -0.4 -0.2 0 0.2 0.4 0.6 0.8 1 1.2 >0 >5 >50 >250 >500
Area burned (ha) resulting from ignitions
R eg res si o n coef fi ci ent s (B )
Figure 3: Comparison of the relative importance of each variable and regression coefficients variation (trend lines) as a function of the resulting area burned. Only population density, shrubland and forest showed highly significant decline/increment for different fire sizes (P<0.001). Based on the results of multivariate logistic models.
Acknowledgements
We acknowledge the Portuguese Forest Services for making available the wildfire database. Part of this study was supported by the European Commission under the 6th Framework Programme through the Integrated Project ‘Fire Paradox’ (FP6-018505).
References
[1] EC, Forest fires in Europe 2006. Official Publication of the European Commission, EUR 22931 EN, 2007.
[2] Bonazountas, M., Kallidromitou, D., Kassomenos, P.A. & Passas, N., Forest fire risk analysis. Human and Ecological Risk Assessment, 11, pp. 617–626, 2005.
[3] Chuvieco, E. Allgöwer, B. & Salas, J., Integration of physical and human factors in fire danger assessment (Chapter 7). Wildland fire danger
estimation and mapping. The role of remote sensing data, ed. E. Chuvieco,
World Scientific Publishing: Singapore, pp. 197–217, 2003.
[4] Finney, M.A., The challenge of quantitative risk analysis for wildland fire.
Forest Ecology and Management, 211, pp. 97–108, 2005.
[5] Johnson, E.A. & Miyanishi, K., Forest fires: behavior and ecological
effects, Academic press: USA, 594 p., 2001.
[6] Roloff, G.J., Mealey, S.P., Clay, C., Barry, J., Yanish, C. & Neuenschwander, L., A process for modelling short and long-term risk in the southern Oregon Cascades. Forest Ecology and Management, 211, pp. 166–190, 2005.
[7] Vasconcelos, M.J.P., Silva, S., Tomé, M., Alvim, M. & Pereira, J.M.C., Spatial prediction of fire ignition probabilities: comparing logistic regression and neural networks. Photogrametric Engineering & Remote
Sensing, 67(1), pp. 73–81, 2001.
[8] Vasilakos, C., Kalabokidis, K., Hatzopoulos, J., Kallos, G., Matsinos, Y., Integrating new methods and tools in fire danger rating. International
Journal of Wildland Fire, 16(3), pp. 306–316, 2007.
[9] Badia-Perpinyà, A. & Pallares-Barbera, M., Spatial distribution of ignitions in Mediterranean periurban and rural areas: the case of Catalonia.
International Journal of Wildland Fire, 15, pp. 187–196, 2006.
[10] Cardille, J.A., Ventura, S.J. & Turner, M.G., Environmental and social factors influencing wildfires in the Upper Midwest, USA. Ecological
Applications 11(1), pp. 111–127, 2001.
[11] Catry, F.X., Modeling and mapping the occurrence of wildfire ignitions in
Portugal. Master Thesis - Science and Geographic Information Systems.
ISEGI – UNL, 2007.
[12] Loboda, T.V. & Csiszar, I.A., Assessing the risk of ignition in the Russian Far East within a modelling framework of fire threat. Ecological
Applications, 17(3), pp. 791–805, 2007.
[13] Mercer, D.E. & Prestemon, J.P., Comparing production function models for wildfire risk analysis in the wildland-urban interface. Forest Policy and
Economics, 7, pp. 782–795, 2005.
[14] Yang, J., Healy, H.S., Shifley, S.R., Gustafson, E.J., Spatial patterns of modern period human-caused fire occurrence in the Missouri Ozark Highlands. Forest Science, 53(1), pp. 1–15, 2007.
[15] Romero-Calcerrada, R., Novillo, C.J., Millington, J.D.A. & Gomez-Jimenez, I., GIS analysis of spatial patterns of human-caused wildfire ignition risk in the SW of Madrid (Central Spain). Landscape Ecology, 23, pp. 341–354, 2008.
[16] DGRF, Incêndios florestais – Relatório de 2005. Divisão de Defesa da Floresta Contra Incêndios. Direcção-Geral dos Recursos Florestais: Lisboa, 2006.
[17] MMA, Los incendios forestales en España. Decenio 1996–2005. Area de Defensa Contra Incendios Forestales. Ministerio de Medio Ambiente: Madrid, 2007.
[18] INE, Dados estatísticos da população em Portugal - Censos 2001. Instituto Nacional de Estatística, 2003. [database]
[19] IA, CORINE Land Cover 2000 Portugal. Instituto do Ambiente, 2005. [map]
[20] IGEOE, Carta Militar Itinerária de Portugal. Instituto Geográfico do Exército, 2005. [map]
[21] NASA, NIMA, DLR, ASI Digital elevation model, 2004 [map].
[22] Sokal, R.R. & Rohlg, F.J., Biometry, W.H. Freeman and Company: New York, 1987.
[23] Hosmer, D.W. & Lemeshow, S., Applied logistic regression, John Wiley and Sons: New York, 1989.
[24] Vega-Garcia, C., Woodard, P.M., Titus, S.J., Adamowicz, W.L., Lee, B.S., A logit model for predicting the daily occurrence of human caused forest fires. International Journal of Wildland Fire 5(2), pp. 101–111, 1995. [25] Preisler, H.K., Brillinger, D.R., Burgan, R.E. & Benoir, J.W., Probability
based models for estimation of wildfire risk. International Journal of
Wildland Fire, 13, pp. 133–142, 2004.
[26] SPSS, SPSS for Windows. SPSS Inc.: Chicago, 2006.
[27] Manel, S., Williams, H. & Ormerod, S.J., Evaluating presence-absence models in ecology: the need to account for prevalence. Journal of Applied