Service quality strategy implementation – a model
and the case of the Algarve hotel industry
C
ARLOSJ.
F.
C
ÂNDIDOFaculdade de Economia, Universidade do Algarve, Campus de Gambelas, 8005-139 Faro, Portugal.
ABSTRACT This is the third of a series of papers addressing the problem of service quality strategy implementation. The first paper focuses on service quality as a function of quality gaps and proposes a comprehensive model that amplifies the areas where to look for service quality gaps (Cândido & Morris, 2000). The second paper focuses on strategy implementation and proposes three interrelated models: a static model of the organisation; a dynamic model of the strategy process; and a mixed model, which integrates static and dynamic models (Cândido & Morris, 2001). Taken together, the four models can help to implement a service quality strategy that simultaneously avoids quality gaps and resistance to change. Now, this paper undertakes a tentative validation of the models. Sample data has been collected through two complementary questionnaires, both implemented in the population of four and five star hotels of the Algarve (FFSHA). Data analysis involves descriptive statistics and statistical tests. In general, the descriptives and the statistical tests do not provide evidence against the models thus supporting their validity. Descriptives have also raised concerns about some possible inconsistent management practices during the implementation of a quality strategy. The paper concludes with insights to managers interested in implementing such a strategy.
KEY WORDS: business strategy, strategy implementation, total quality management, service quality, quality gap, Algarve, hotel industry, tourism.
Correspondence: Faculdade de Economia, Universidade do Algarve, Campus de Gambelas, 8005-139 Faro, Portugal. E-mail address: [email protected]
This is a preprint version of an article submitted for consideration in the
Available at: http://www.tandfonline.com/doi/full/10.1080/1478336042000255613 Copyright by Taylor and Francis Total Quality Management journal, printed in 2005, Volume 16, Issue 1, pp. 3-14.
Introduction
This paper addresses the problem of service quality strategy implementation. The problem can be defined more precisely as how to implement a strategy of quality, which focuses on customers’ needs, in a service organisation, or alternatively, as how to integrate coherently a strategy of service quality, centred on the customers, with the requirements and idiosyncrasies of operationalization, in order to make it successful. The nature and scope of this research problem is based in the confluence of the areas of service quality, business strategy and strategy implementation. Thus, addressing this problem naturally required a review of the literature on service quality, on business strategy and on strategy implementation. The literature review on service quality revealed, first, that service quality is a function of service quality gaps (SQGs); second, that there are some models of SQGs; and, third, that there are several SQGs in the literature which are not integrated into any model; thus revealing a need for an encompassing synthesised model. A previous paper (Cândido & Morris, 2000)
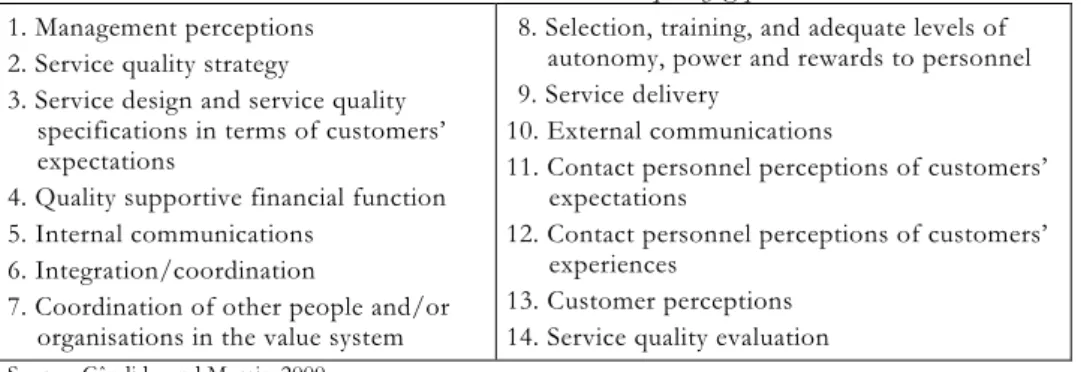
considers the existing SQG models and a list of other gaps and quality inconsistencies to propose a comprehensive model comprising 14 different SQGs (See Table 1).
<Table 1 here>
Similarly, the literature review on business strategy and on strategy implementation revealed, first, that there is a lack of clear, detailed and general strategy implementation models; second, that existing strategy implementation models can be separated into two distinct types, the static and the dynamic models; and, third, that existing static models exhibit many relevant aspects but differ strongly on the number and on the nature of the aspects included; thus revealing insufficiencies and the need for an integrative effort. The same happens with the existing dynamic models. A previous paper (Cândido & Morris, 2001)
consequently considers several existing models to propose a synthesised static model and a synthesised dynamic model (See Figures 1 and 2).
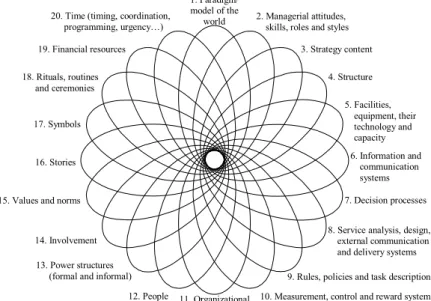
<Figure 1 here>
The synthesised static model is a representation of an organisation; of all organisational aspects relevant for strategy implementation, at a given instant. This includes manager’s mental model of the world; manager’s attitudes, skills, roles and styles; strategy content; structure; facilities; equipment; and other relevant organisational dimensions.
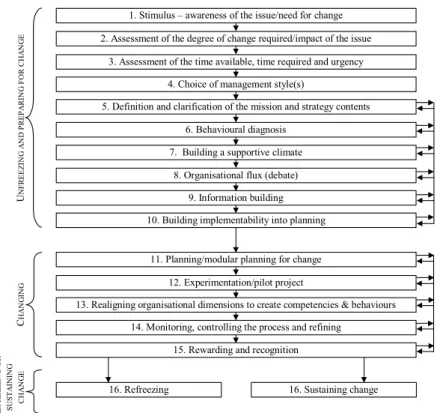
The synthesised dynamic model is a generic process of strategy formulation and implementation that explicitly addresses the requirements for success, including avoidance of resistance to change. Resistance to change is avoided through a series of preparatory stages in the process which include extensive communication; internal debate among opposing parties; behavioural and resistance diagnosis; choice of best management styles; building a strong coalition that supports the new strategy; changing the rewarding systems; providing adequate training to people; and involving all those that will be responsible for implementing the strategy in previously discussing and planning it.
Note that whilst the two kinds of models – static and dynamic models – address the implementation problem from different perspectives, they are not in competition. In fact, it is the view of the authors that the models are complementary and have to be integrated into a “mixed model”, in order to provide a better understanding of strategy implementation
(Cândido & Morris, 2001). Thus, besides the already mentioned three comprehensive models, that have been synthesised, the previously mentioned paper goes further to suggest a mixed model which, simultaneously and harmoniously, considers all relevant organisational
can be changed and at what stages. Such model, unique in the literature, as far as the author is aware, is finally combined with the SQG model to propose: (1) a map of the pattern of the quality gaps occurring at each implementation stage; (2) the organisational variables that can be manipulated, at each stage, to prevent and eliminate the gaps; and (3) several relevant implications to practising managers (Cândido & Morris, 2001; Cândido, 2001).
<Figure 2 here>
The gap, static, dynamic and mixed models are now confronted, in this paper, with sample data from the four and five star hotels of the Algarve (FFSHA). The data does not provide evidence against the models thus supporting their validity. This tentative validation of the models thus provides some relevant theoretical contributes to the service quality and the strategy implementation literatures. It also raises some concerns about possible inconsistent management practices during the implementation of a service quality strategy and provides some insights to managers interested in implementing such a strategy. Sample data is also used, elsewhere, to describe (1) how FFSHA are implementing service quality strategies; (2) how they prevent and eliminate SQGs; (3) how management practices differs according to hotel ownership: international chains, portuguese chains, and independent hotels; and (4) what can be learned from the differences (Cândido, 2001 & 2003).
Research objectives and methodology In this paper, the objectives are to assess the:
1. importance of eliminating each individual SQG;
2. importance of managing each organisational dimensions of the static model; 3. importance of each stage of the dynamic model;
5. validity of the basic assumption underlying the mixed model;
6. organisational dimensions that can be manipulated, at each stage of the strategy process, to prevent and eliminate SQGs;
7. relevance of the implications for managers deduced from the models.
The method chosen to achieve these objectives was the survey method. The number of questions necessary to achieve all these objectives would make one questionnaire too much extensive and very unattractive for managers to answer. It was thus preferable to divide the relevant questions into two different questionnaires and to administer them at different periods, separated by a considerable interval of time. This interval of time, approximately five months, was necessary to warrant that managers would be willing to answer all questions and was not seen as being able to influence the data in any other way. The periods for
interviewing had also to coincide with the low season. The first questionnaire addresses objectives 1 and 2, listed above, and the second questionnaire addresses objectives 3 to 7.
Both questionnaires were initially sent by post, together with accompanying letters of introduction; one letter from the author, one letter from the author’s faculty, and another letter from the influential Hotel Association in the Algarve (AHETA).
Both questionnaires were subsequently administered through face-to-face interviews. To secure face-to-face interviews, personal appointments with each manager were made by telephone, just a few days after posting the questionnaires. Some of the reasons for the choice of an interviewing method are that interviewing warrants a bigger response rate; avoids item non-response; and allows the respondent to ask for additional information or clarification of complex questions.
A five point Likert scale was used in several questions, with “1” meaning
Several different types of fixed-alternative questions were also used, including a special type of question that relates the concepts of one model, e.g. the static model, to the concepts of another model, e.g. the dynamic model.
In order to ensure comparability between samples, only the managers interviewed during the administration of the first questionnaire were chosen for the administration of the second questionnaire. However, only 70% of these managers agreed to be interviewed a second time.
Characterisation of respondents
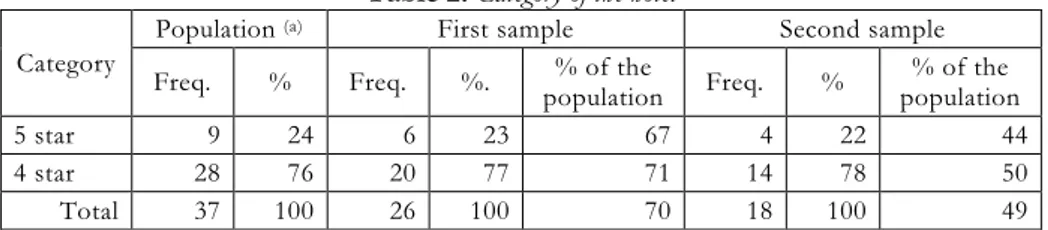
Table 2, below, exhibits the frequencies of four and five star hotels in the population of the Algarve hotel industry. There are 9 five star hotels (24%) and 28 four star hotels (76%), composing a total of 37 hotels. Other categories of hotels are not considered in this study. Table 2 also shows the frequency of four and five star hotels in the samples. The first sample has 6 five star hotels (23%) and 20 four star hotels (77%); a total of 26 hotels (100%). The second sample has 4 five star hotels (22%) and 14 four star hotels (78%), composing a total of 18 hotels (100%).
<Table 2 here>
The first sample represents 70% of the population of FFSHA. It includes 67% of the five star hotels and 71% of the four star hotels on the Algarve. The second sample is smaller but, still, it represents 49% of the population of FFSHA. It includes 44% of the five star hotels and 50% of the four star hotels in the Algarve.
These percentages show that the distribution of hotels according to their category, in the samples, are not very different from that in the population. In fact, comparing with the
population, the first sample presents a mere 1% more of four star hotels and 1% less of five star hotels, whereas the second sample presents a mere 2% more of four star hotels and 2% less of five star hotels. These figures suggest that the samples might be representative of the population, but they are insufficient to demonstrate that fact without any doubt. As in most similar studies, all that can be said is that those figures do not provide evidence against sample representativeness.
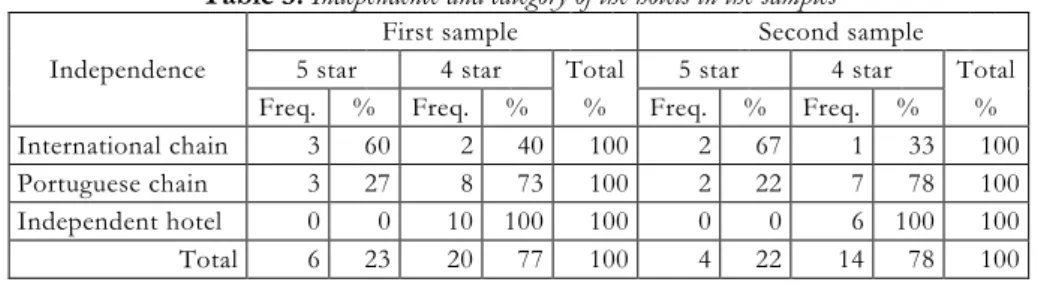
Another important characteristic dimension of the population is hotel dependence / independence. Some hotels belong to chains, while others are independent. Differences on this dimension can have an important effect on the ways that hotels are managed and on their performances. Table 3 characterises the samples on this important dimension. The table does not characterise the whole population since the required data was not available.
<Table 3 here>
As Table 3 shows, for both samples, the majority of international chain hotels are five star hotels, whereas most portuguese chain hotels are four star hotels. All five star hotels are chain hotels and all independents are four star hotels. The distributions and percentages, in the table, corresponding to both samples, are very similar, just as in Table 2, indicating that the relative compositions of the two samples are almost identical. Being almost identical means that the samples are comparable and provides no evidence against sample
representativeness. (Note that the χ2 goodness of fit test is not recommendable in this case,
because some of the frequencies in Table 3 are very small or null.)
Results: tentative validation of the models
samples. The data does not provide evidence against the models thus supporting their validity. A summary of how the data supports the validity of the models is now provided.
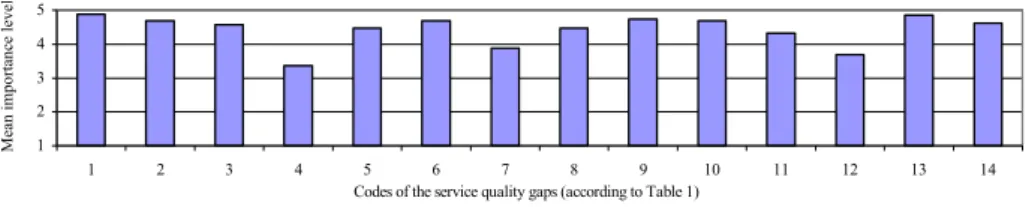
Service quality gap (SQG) model. A five point Likert scale, as described above, was
used to assess the importance of each gap in managers’ opinions. All descriptive statistics computed suggest that managers are unanimous in considering all SQGs as very important – for most gaps, the mean answer is higher than 4 (See Figure 3).
Binomial tests were also performed for each gap. For this purpose, the Likert scale was turned into a dichotomous scale, by joining together, into one category, answers 1, 2 and 3, regarded as the “small and medium importance” answers, and into the other category, answers 4 and 5, regarded as the “high importance” answers. This was necessary, because the sample distributions of the answers, for each gap, are not normally distributed nor
symmetrical, which prevents the t test from being performed.
Results from the binomial tests, thus, suggest that more than half of the hotels (>51%) confer 12 of the 14 gaps with a high importance level (answers 4 and 5 in the second
category). Similar tests suggest that a proportion higher than 35% of the hotels, but smaller than 51%, considers the remaining two gaps very important (answers 4 and 5). In conclusion, the descriptive statistics and the statistical tests provide strong support for the relevance of the 14 SQGs that constitute the gap model, particularly in the FFSHA. Nevertheless, this is merely a first and a tentative validation. A stronger validation of the model would require additional research, which would benefit from the interest and involvement of other researchers.
<Figure 3 here>
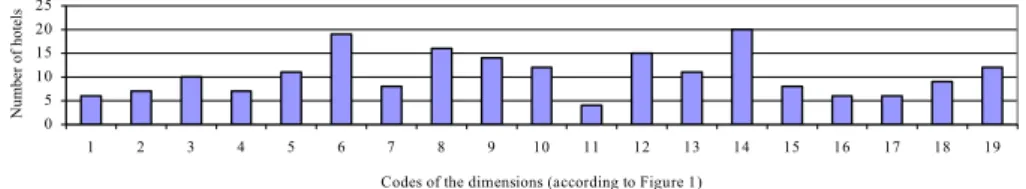
was used in order to assess the number of managers that consider relevant to manage them. The descriptive statistics computed make it plausible to conclude that all dimensions are relevant to hotels implementing a service quality strategy or trying to eliminate SQGs (See Figure 4). Statistical binomial tests have also been performed, providing strong evidence that all dimensions in the static model are manipulated by positive proportions of hotels in the population of FFSHA. “Positive” meaning here that the proportions are not equal to zero, nor too close to zero. These proportions may vary from dimension to dimension, but the tests indicate that they are higher than 10% and lower than 85%. This means that all dimensions in the model are relevant to managers taken as a group. However, descriptive statistics have also suggested that, when taken individually, most managers seem to
manipulate only a limited group of variables. On average, each manager manipulates a limited set composed of only nine variables. In conclusion, the data does not provide evidence against the static model, substantiating it, and further suggests that most individual managers manipulate only a limited set of dimensions. These managers are not exploiting all kinds of direct impacts that they can obtain from manipulating every dimension. They are either ignoring many of the organisational dimensions that can be managed or relying on the indirect effects that can be produced through interactions between dimensions. Such confidence in indirect effects does not seem appropriate since these effects can be either insufficient or opposed to the changes that are intended. Consequently, managers should try to expand the number of dimensions that they manage instead of relying only on their personal management experience with a limited set of variables.
<Figure 4 here>
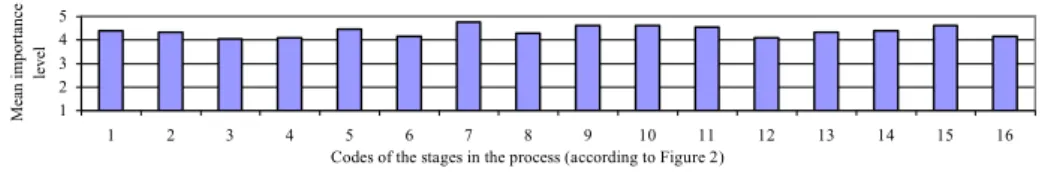
importance of each stage of the dynamic model, in managers’ opinions. All descriptive statistics computed seem to confirm that managers consider every stage as very important – for all stages, the mean answer is higher than 4 (See Figure 5). Managers do not feel the need to add any other stage to those already included in the model and the great majority of the managers has further agreed with the order of those stages. Binomial tests were also
performed for each stage. The tests suggest that more than half of the hotels (>51%) confer 14 of the 16 stages with a high importance level. Similar tests suggest that a proportion higher than 35% of the hotels, but smaller than 51%, considers the remaining two stages very
important. In conclusion, the descriptive statistics and the statistical tests provide strong support for the relevance and order of the stages that constitute the dynamic model, particularly in the FFSHA. Again, this is merely a first and a tentative validation. A stronger validation of the model requires additional research that would benefit from the interest and involvement of other researchers.
<Figure 5 here>
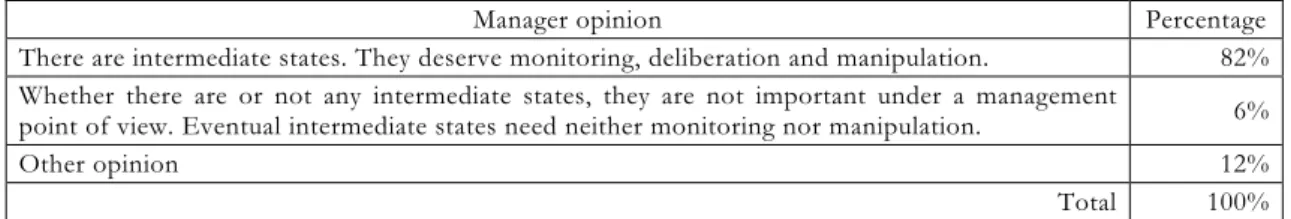
Mixed model. The basic assumption of the mixed model is that in the process of
strategy formulation and implementation, each organisational dimension (e.g., facilities, competencies, values, norms, information system) goes through a succession of several distinct states, until its desired final state is achieved. During this process, a dimension can be monitored continuously and “manipulated” several times, in different stages, according to its relevance to strategy and to progress of the change. The great majority of the managers (82%) have agreed completely with this assumption. Only 6% expressed disagreement and the remaining 12% expressed slightly different opinions, which are not in total contradiction with the assumption. Hence, the basic assumption of the mixed model is not rejected, by the great
majority of the FFSHA, thus receiving supporting evidence (See Table 4).
<Table 4 here>
Link between the mixed and the gap models. A table was built, from managers’
opinions, linking the gaps to the mixed model. This table indicates, for each stage, what are the gaps associated to each organisational dimension. Such table, built from managers’ opinions, shows a distribution of the gaps that is different from that predicted in a previous paper (Cândido & Morris, 2001; Cândido, 2001). In spite of the differences, the most important features of the tables are, however, basically coincident. Thus, the theoretical conclusions extracted from the predicted table and the corresponding implications for managers, previously advanced, are supported by the sample data. These conclusions and implications are the following:
1. SQGs occurring during the strategy process can affect it and may become embedded in the organisational processes, routines, culture and remaining organisational dimensions. 2. When this happens, subsequent organisational activity will be severely affected; the
implementation process will probably be considered unsuccessful; and the organisation’s competitiveness will be diminished.
3. Consequently, being aware of the SQGs that might occur can help in preventing them and in limiting their broader consequences. More generally, winning the challenge of implementation requires that managers are aware of the character and importance of each organisational dimension; of the eventual unanticipated behaviour of organisational dimensions; of each stage of the dynamic strategy process; and of SQGs’ pervasiveness, character and behaviour during the process. The models, proposed earlier, can contribute to raising understanding of these aspects. They can also be adapted to specific
organisations and be used to anticipate what SQGs might occur at each stage; what organisational dimensions might be afected; and what organisational dimensions might be managed, at each stage, to eliminate the gaps.
manager for three reasons. First, the gap may not stand in isolation, but might coexist with others, making the problem much more complex than it seems. Second,
manipulation of one organisational variable, alone, may be insufficient to eliminate any one gap; the elimination of which may require an integrated and coherent approach. And, third, even if an existing gap has been dealt with and eliminated, it may reappear, at some later stage, for the same or for different reasons, making constant surveillance mandatory.
Conclusion
Validation of the four models suggested earlier (Cândido & Morris, 2000 & 2001) requires additional research, but the attempt made here to disprove the models has failed, providing evidence that in fact supports their validity. Moreover, the features of the table linking the models and the resulting implications for managers, previously advanced, are also supported by sample data. Some of these features and implications are that:
1. SQGs can affect the strategy process and become embedded in the organisation. 2. Subsequent organisational activities and competitiveness will be severely affected. 3. Winning the challenge of implementation requires that managers understand every stage
of the strategy process, every organisational dimension, and their possible unanticipated and inconsistent behaviour during the process. An understanding of each SQG and of resistance to change is fundamental. The models, proposed earlier, can help raising this understanding and can help to successfully implement any strategy. For instance, they should help in anticipating what organisational dimensions will be most affected by SQGs and by resistance, at each stage of the process, and what variables can be used to prevent and eliminate gaps and resistance.
4. Managers should not underestimate SQGs, because a gap may not stand in isolation; because manipulation of one organisational variable, alone, may be insufficient to eliminate it; and because any gap may reappear, at some later stage.
A last conclusion of this research is that individual managers, in the FFSHA, manipulate only a limited group of organisational variables. On average, each manager manipulates only nine of the variables in the static model. These managers are not exploiting
all kinds of direct positive impacts that they can obtain from managing every dimension. They are either ignoring many of the dimensions that can be managed or relying on the indirect effects that can be produced through interactions between dimensions. Such confidence in indirect effects does not seem appropriate since these effects can be either insufficient or opposed to the changes that are intended. An important implication from this conclusion is that perhaps managers should try to expand the number of dimensions that they manage instead of relying only on their personal management experience with a limited set of variables.
The sample data, obtained for this research, is looked at from a different point of view elsewhere (Cândido, 2001 & 2003) and some additional management recommendations are also detailed.
Acknowledgement
The author wishes to express profound gratitude to Professor D. S. Morris for his invaluable contribution to this paper. The author wishes to acknowledge also the financial support by the Portuguese/E.U. Programme “Sub-Programa Ciência e Tecnologia do 2º Quadro Comunitário de Apoio”.
References
CÂNDIDO,C.J.F.&D.S.MORRIS (2000) Charting Service Quality Gaps, Total Quality Management, Vol. 11, No. 4/5&6, S463-S472.
CÂNDIDO,C.J.F.&D.S.MORRIS (2001) The Implications of Service Quality Gaps for Strategy Implementation, Total Quality Management, Vol. 12, No. 7&8, 825-833.
CÂNDIDO,C.J.F.(2001) Implementation of a Service Quality Strategy - Application to the Algarve Hotel Industry, Unpublished PhD Thesis (Sheffield Hallam University, U.K.).
Algarve Hotel Industry, The International Journal of Applied Management, Vol. 4, No. 1, 37-54. INE–INSTITUTO NACIONAL DE ESTATÍSTICA (1999) List of the hotel names, categories, addresses and other
Table 1. The 14 service quality gaps in the model
1. Management perceptions 2. Service quality strategy
3. Service design and service quality specifications in terms of customers’ expectations
4. Quality supportive financial function 5. Internal communications
6. Integration/coordination
7. Coordination of other people and/or organisations in the value system
8. Selection, training, and adequate levels of autonomy, power and rewards to personnel 9. Service delivery
10. External communications
11. Contact personnel perceptions of customers’ expectations
12. Contact personnel perceptions of customers’ experiences
13. Customer perceptions 14. Service quality evaluation Source: Cândido and Morris, 2000.
Table 2. Category of the hotel
Category
Population (a) First sample Second sample
Freq. % Freq. %. % of the
population Freq. % % of the population 5 star 9 24 6 23 67 4 22 44 4 star 28 76 20 77 71 14 78 50 Total 37 100 26 100 70 18 100 49
Table 3. Independence and category of the hotels in the samples
First sample Second sample Independence 5 star 4 star Total 5 star 4 star Total Freq. % Freq. % % Freq. % Freq. % % International chain 3 60 2 40 100 2 67 1 33 100 Portuguese chain 3 27 8 73 100 2 22 7 78 100 Independent hotel 0 0 10 100 100 0 0 6 100 100 Total 6 23 20 77 100 4 22 14 78 100
Table 4. Manager’s opinions about intermediate states during change in an organisational dimension
Manager opinion Percentage
There are intermediate states. They deserve monitoring, deliberation and manipulation. 82% Whether there are or not any intermediate states, they are not important under a management
point of view. Eventual intermediate states need neither monitoring nor manipulation. 6%
Other opinion 12%
Figure 1. Static model: fundamental dimensions of strategy implementation
1. Paradigm/ model of the
world 2. Managerial attitudes,skills, roles and styles
3. Strategy content 4. Structure 5. Facilities, equipment, their technology and capacity 6. Information and communication systems 7. Decision processes 8. Service analysis, design,
external communication and delivery systems 9. Rules, policies and task descriptions 10. Measurement, control and reward systems 11. Organizational
competencies 12. People
13. Power structures (formal and informal) 14. Involvement 15. Values and norms
16. Stories 17. Symbols 18. Rituals, routines
and ceremonies 19. Financial resources
20. Time (timing, coordination, programming, urgency…)
Figure 2. Dynamic model: a process for strategy implementation that avoids resistance to change
11. Planning/modular planning for change 12. Experimentation/pilot project
13. Realigning organisational dimensions to create competencies & behaviours 14. Monitoring, controlling the process and refining
15. Rewarding and recognition
16. Refreezing 16. Sustaining change
7. Building a supportive climate 8. Organisational flux (debate)
9. Information building 10. Building implementability into planning 5. Definition and clarification of the mission and strategy contents
6. Behavioural diagnosis
1. Stimulus – awareness of the issue/need for change 2. Assessment of the degree of change required/impact of the issue
3. Assessment of the time available, time required and urgency 4. Choice of management style(s)
U NFR E E Z IN G A N D P R E P A R IN G F O R C HA N G E C HA N G IN G R E FR E E Z IN G OR SUS T A INI N G C HA N G E
Figure 3. Mean importance level of the gaps on a 5 point Likert scale 1 2 3 4 5 1 2 3 4 5 6 7 8 9 10 11 12 13 14
Codes of the service quality gaps (according to Table 1)
Mea n impo rt an ce leve l
Figure 4. Number of hotels manipulating each organisational dimension 0 5 10 15 20 25 1 2 3 4 5 6 7 8 9 10 11 12 13 14 15 16 17 18 19 Codes of the dimensions (according to Figure 1)
Number
of hot
els
Notes: The 20th dimension, time, is not considered here, as it is exploited with the dynamic model. Number of respondents: 24.
Figure 5. Mean importance level of the stages in the dynamic model 1 2 3 4 5 1 2 3 4 5 6 7 8 9 10 11 12 13 14 15 16
Codes of the stages in the process (according to Figure 2)
Mean impo
rtance
level