A
ssessing cArbon sequestrAtion in brAziliAn northeAstern biomesunder
enso
eventsrobsonde sousA nAscimento1*, ivAldo bArbosAde brito2, vAlériA Peixoto borges1
1 Universidade Federal da Paraíba – Centro de Ciências Agrárias – Departamento de Solos e Eng. Rural 2 Universidade Federal de Campina Grande – CTRN - Unidade Acadêmica de Ciências Atmosféricas * Autor para correspondência: [email protected]
Recebido em 04 de junho de 2019. Aceito em 16 de dezembro de 2019. Publicado em 30 de dezembro de 2019.
AbstrAct - Net Primary Production (NPP) represents the amount of carbon absorbed by a plant. The present study aimed to know the behavior of the Net Primary Production (NPP) in years that have occurred El Niño Southern Oscillation (ENSO) and during the anomalies of the sea surface temperature (SST) in the Tropical Atlantic, that is Atlantic Dipole, to assessing the quantity of carbon absorbed by the northeastern biomes (Amazon Rainforest, Atlantic Forest, Cerrado and Caatinga) during these events. NPP was calculated using NDVI-AVHRR sensor data, and climate data from NCEP, both covering the period from 1981 to 1999. The results showed that the Amazon Rainforest, Atlantic Forest, and the Cerrado were not enough affected by the occurrence of ENSO and Atlantic Dipole. However, the Caatinga biome has shown to be quite sensitive to these events and patterns, especially in years of occurrence of El Niño, which contributed to a reduction in NPP; while in years of La Niña and negative dipole, the NPP achieved the highest values. The amount of precipitaton in previous year to the ENOS episodes showed influence on the amount of carbon sequestration by biomes in the year of study.
Keywords: Net primary production; Precipitation; Atlantic dipole; Carbon market.
AvAliAndoocArbonosequestrAdoembiomAsnordestinobrAsileiroemeventos enos
resumo – A Produção Primária Líquida (PPL) representa a quantidade de carbono absorida por uma planta. O objetivo do presente estudo foi conhecer o comportamento da PPL em anos que ocorreram El Niño Oscilação Sul (ENOS) e durante as anomalias de temperatura da superfície do mar (TSM) no Atlântico Tropical, que é o Dipolo Atlântico, para avaliar a quanttidade de carbono absorvida pelos biomas nordestino (Floresta Amazônica, Mata Atlântica, Cerrado e Caatinga) durante esses eventos. A NPP foi calculada por meio de dados de NDVI do sensor AVHRR, e os dados climáticos do NCEP, ambos abrangendo o período de 1981 a 1999. Os resultados mostraram que a Floresta Amazônica, a Mata Atlântica e o Cerrado não foram afetados pela ocorrência de ENOS e Dipolo do Atlântico. No entanto, o bioma Caatinga mostrou-se bastante sensível a esses eventos e padrões, especialmente em anos de ocorrência do El Niño, o que contribuiu para a redução da PPL; enquanto em anos de La Niña e dipolo negativo, a NPP alcançou os maiores valores. A quantidade de chuvas no ano anterior à eventos de ENOS mostrou influência na quantidade de carbono sequestrado pelos biomas no ano de estudo.
PAlAvrAs-chAve: Produção primária líquida; Precipitação; Dipolo do atlântico; Mercado de carbono.
evAluAcióndelcArbonosecuestrAdoenlosbiomAsdelnordestebrAsileñoeneventos enos
resumen - La Producción Primaria Líquida (PPL) representa la cantidad de carbono absorbido por una planta. El objetivo de este estudio fue conocer el comportamiento de la PPL en años que ocurrieron El Niño Oscilación del Sur (ENOS) y durante anomalías de la temperatura de la superficie del mar (TSM) en el Atlántico Tropical, que es el Dipolo del Atlántico,
para evaluar la cantidad de carbono absorbido por los biomas del nordeste (Selva Amazónica, Bosque Atlántico, Cerrado y Caatinga) durante estos eventos. Se calculó la NPP utilizando los datos de NDVI del sensor AVHRR y los datos climáticos del NCEP, ambos abarcando el período de 1981 a 1999. Los resultados mostraron que la Selva Amazónica, el Bosque Atlántico y el Cerrado no se vieron afectados por la ocurrencia de ENOS y Dipolo del Atlántico. Sin embargo, el bioma de Caatinga se vio muy sensible a estos eventos y patrones, especialmente en los años de ocurrencia de El Niño, lo que contribuyó a la reducción de PPL; mientras que en La Niña y dipolo negativo, la NPP alcanzó los valores más altos. La cantidad de lluvias en el año anterior a los eventos de ENOS mostró influencia en la cantidad de carbono secuestrado por los biomas en el año de estudio.
PAlAbrAsclAve: Producción primária líquida; Precipitación, Dipolo del atlántico; Mercado del carbono.
i
ntroductionPlants assimilate CO2 in photosynthesis process, but also release CO2 through the respiration process, and the difference between the absorption and release of CO2, is called Net Primary Production (NPP), which is the amount of carbon stored by the plant (Wang et al. 2014).
NPP is a fundamental ecological variable because its significance in indicating the condition of the land surface area and the status of a wide range of ecological process, as well as it measures the energy input to the biosphere and terrestrial carbon dioxide assimilation. It is an important indicator of ecosystem performance and a key component of the carbon cycle (Hao et al. 2017).
It is important to analyze the vegetation temporal dynamic in some regions and its relationships with the climate to a better undestanding of carbon fluxes between ecosystem and atmosphere (Kobayashi and Dye 2005; Gang et al. 2017).
There are many ways to estimate NPP measurements, can be done in field, remote sensing techniques and models simulating the carbon mass fluxes can be used to scale up. But, remote sensing has been an invaluable tool to improve the estimation of NPP at landscape and regional scales because its models are based on the principle of Light Use Efficiency (LUE).
LUE is defined as the amount of carbon produced per unit of absorbed photosynthetically active radiation (APAR), and the methods for estimating plant productivity from APAR and LUE was developed by Monteith (1972, 1977) differing between the various types of forest cover (Schwalm et al. 2006). The intercepted photosynthetically active radiation (IPAR) by the canopy, it was taken equal to 50% of short-wave radiation (Ferreira 2006).
NPP models seek to describe the light absorption by the plant canopy through a relationship among the Normalized Difference Vegetation Index (NDVI) and the fraction of photosynthetically active radiation (fPAR)
absorbed. The last one expresses the energy absorption capacity of canopy and acts as an indicator of plant canopy state (McCallum et al. 2010).
Carbon stocks may respond differently to warming and drought, so that, precipitation and air temperature has been some dominant climatic factors that control the interannual variability in NPP throughtout some biomes (Liang et al. 2015; Nascimento et al. 2017).
Drought has caused a decrease in NPP (Peng et al. 2017), and changes in water availability have affected the NPP variability because they affect the evapotranspiration (Li et al. 2016; ). Factors such as urbanization (Xu et al. 2007), precipitation (Chen et al. 2013), different types of crops (Li et al. 2014) and ENSO events (Bastos et al. 2013) also have affected the NPP.
The northeast region of Brazil (NEB) is very vulnerable to ENSO events and the Atlantic dipole (Ferreira and Melo 2005), contributing to the increase or decrease for rainfall in this region. Thus, the NPP provides a
comprehensive assessment of the ecosystem condition, including health changes, habitat and wildlife (Crabtree et al. 2009).
As the northeastern biomes are highly dynamics and variables due its different characteristics, since a biome with high amount of rainfall such as Amazon Rainforest until the Caatinga biome, that is a biome in a semi-arid region with low rainfall. Thus, it is important to assess the amount of carbon among the biomes to know if them play an important role in the carbon sequestration in terms quantitative.
In this context, the biomes are primarily responsible for regulating the amount of carbon due to its huge storage capacity and productivity (Wang et al. 2008).
This study aims to determine NPP by means of satellite remote sensing data for Northeastern biomes and check their behavior in episodes of ENOS, which covers El Niño and La Niña, and their absence. It also observed the influence of temperature anomalies of the Sea Surface Temperature (SST) of Tropical Atlantic on values of NPP for the different biomes of the Northeast. It has been done an evaluating on the carbon availability to be negociated in carbon market.
m
AteriAl And methodsStudy Area
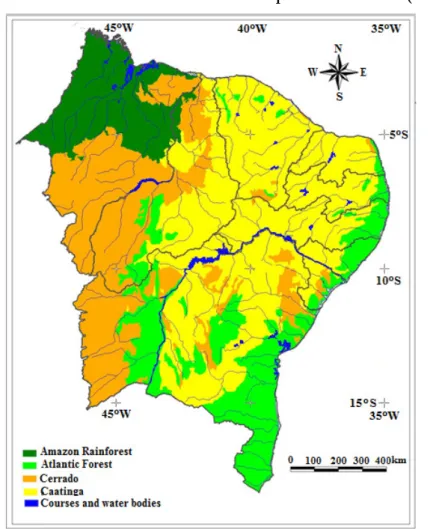
The study area of this work was the northeast region of Brazil (NEB) with its distinct biomes that are Amazon Rainforest, Atlantic Forest, Cerrado and Caatinga, as can be seen in Figure 1. In whole NEB the Caatinga occupies 54 %, Cerrado 27 %, Atlantic Forest 11 % and Amazon Rainforest 8 % (Miranda 2013).
Data
In the present research was used monthly data of NDVI, for the period from January 1981 to December 1999 with spatial resolution of 5 km x 5 km, from the Center for Weather Forecasting and Climate Studies (CPTEC) of the National Institute of Space Researches (INPE), which are available at Academic Unit of Atmospheric Sciences (UACA) of the Federal University of Campina Grande (UFCG).
The rainy season of the various NEB sub-regions begins and ends in different months of the year and it is not linked to the civil calendar (January to December), it was applied the concept of hydrological year, that is a twelve months period beginning in one of the driest months before to start the rainy season. Thus, monthly precipitation data to the hydrological year were obtained from September to August of the next year. Details to determinate hydrological year can be obtained in Marcuzzo and Goularte (2013), and NDVI in Chino et al. (2010), and Silva and Liporace (2016).
Climate data of rainfall, short-wave radiation and temperature were of reanalyze of the National Center of Environment Prediction (NCEP) (Kalnay 1996).
El Niño Southern Oscillation (ENSO)
Bastos et al. (2013) showed the dependence of the global NPP on the ENSO phenomenon. Therefore, it is important to verify if the NPP of the NEB also presents some degree of dependence of these phenomena. For this purpose, it was used monthly data of equatorial Pacific SST anomaly from the National Oceanic and Atmospheric Administration’s (NOAA) Climate Prediction Center (CPC).
CPC/NOAA makes available on its homepage (http://www.cpc.ncep.noaa.gov) information about the values of SST anomalies presented indicating El Niño, Neutral or La Niña occurrence (CPC/NOAA 2018), considering El Niño, anomalies of SST higher than 0.5 oC for five consecutive quarters, La Niña for anomalies of SST lower
than -0.5 oC, also for five consecutive quarters. No occurrence of these conditions is characterized as neutral. From
the CPC/NOAA data, Figure 2 was constructed taking into account the hydrological year for the NEB. Figure 2. ENSO occurrence (El Niño, La Niña and Neutral).
Neutral El Niño La Niña
1981/82 1982/83 1983/84 1984/85 1985/86 1986/87 1987/88 1988/89 1989/90 1990/91 1991/92 1992/93 1993/94 1994/95 1995/96 1996/97 1997/98 1998/99 Source: CPC (2018)
Atlantic Dipole
Moura and Shukla (1981) defined the dipole of Tropical Atlantic SST anomaly (Atlantic dipole) as being the difference of the SST anomalies of areas of the Northern and Southern Tropical Atlantic basins, that is, the value of the anomaly of the northern area less the south area.
Similarly to the ENSO phenomenon, the Atlantic dipole is composed of three modes: positive, neutral and negative. When the North Tropical Atlantic is warmer (positive dipole) inhibits rainfall in the NEB, and when the South Tropical Atlantic is warmer (negative dipole), provides rains in NEB, mainly in the northern part of this region (Cavalcanti 2012), so that was analyzed its influence on the values of NPP.
It is important to highlight that there are not currently any institutions monitoring the Tropical Atlantic SST anomaly and classifying periods of positive, neutral or negative dipole occurrence. Thus, the occurrence of this phenomenon was obtained by Ferreira and Mello (2005) and Menezes et al. (2008), and they are presented in Figure 3.
Figure 3. Occurrence of Atlantic Dipole (the years not listed in the period from 1981 to 1999 were neutral years). Source: Ferreira and Mello (2005) and Menezes et al. (2008).
Positive Negative
1981, 1992, 1997, 1998 1985, 1986, 1989, 1999
The model
The monthly NPP is calculated from the Eq. (1).
(1) The light use efficiency factor (ε, MJ-1), which is the efficiency with which plants can absorb radiant energy to
produce biomass, and it is dependent on factors such as temperature, photochemical processes and water supply (Hilker et al. 2010).
For this study, it was used the value of ε equal to 0.62 MJ-1 for the Amazon Rainforest and Atlantic Forest
(Saldarriaga and Luxmoore 1991), for these two biomes have similar characteristics. For the Caatinga and the Cerrado used ε equal to 0.97 MJ-1, the value used by Fensholt et al. (2006) to shrub and savanna, in Sahel, Africa.
For the calculation of fPAR used the linear relationship proposed by Baret and Olioso (1989). Thus, fPAR is
given by:
fPAR = -0.31 + 1.33 NDVI (2)
The fPAR was made equal to zero for negative value of NDVI, which indicates bare soil.
r
esults And discussionThe interannual variability of rainfall for biomes is shown in Figure 4, and it is observed that the greatest volume of annual average rainfall was recorded for the Amazon rainforest (1765 mm), the second largest volume of rain made for Atlantic Forest (1429 mm), Cerrado ranks third (1179 mm) and finally, the Caatinga (1076 mm).
Figure 4. Interannual variability of precipitation in different biomes in NEB.
It is important to be noted that these average annual precipitation totals of the areas of the Northeast occupied by each biomes are consistent with the climatological normals of the National Institute of Meteorology (INMET) for the period from 1981 to 2010 (INMET, 2018).
It is observed from the Figure 4 that in 1982/83, 1986/87, 1991/92 and 1997/98 occurred a decrease in the precipitation. Figure 2 shows that these years were of El Niño occurrence. In Figure 2 it can also be observed that in 1984/85, 1988/89, 1995/96 occurred rainfall higher than the climatological average, indicating that these years were of occurrence of the La Niña phenomenon.
It should be noted that the period 1998/99 was also from La Niña, however, precipitation was higher than the average only in the Amazon Rainforest area, in the other Biomes it was lower, but higher than the El Niño years. According to Cavalcanti (2012) the lowest values in precipitation occurred in years of El Niño and the largest in La Niña episodes.
Net Primary Production in Neutral Years
Figure 5 shows the NPP for the biomes in northeastern Brazil in neutral years. The annual average rainfall for the Amazon rainforest was 1765 mm and the average NPP 1157 gC.m-2.yr-1. Figure 5a shows that the Amazon
rainforest kidnapped 900-1500 gC.m-2.yr-1. In figure 5b the values are between 800 and 1300 gC.m-2.yr-1, 1100 to
1600 gC.m-2.yr-1 in Figure 5c and 1100 to 1600 gC.m-2.yr-1 in Figure 5d.
These results are consistent with those of Costa et al. (2009), which obtained values from 1050 to 1360 gC.m -2.yr-1, observed in micrometeorological sites, and values from 970 to 1340 gC.m-2.yr-1, simulated by climatic data
and by products of remote sensing, for the period from 2001 to 2006. It is important to highlight that Costa et al. (2009) performed their analyzes for isolated points in the states of Pará, Amazonas and Acre, while the results presented in the present study are for the Amazon Rainforest area of the NEB.
It was seen a variability in this biome among the years of absence of ENSO episodes, especially in the years 1985/86 and 1996/97, since there was an increase in the area of high values of sequestration, reaching the eastern part of the Caatinga. This increase occurred in 1985/86 because that year was a negative dipole and the previous year of La Niña episode, providing a greater volume of rainfall for the biomes.
Although there was a reduction in the value of sequestration and comprehensiveness of area in 1996/97, it was observed that the high values reached the eastern part of the Caatinga, even being a year of positive dipole, but the previous year was La Niña.
The NPP is a function of a number of factors and that the climatic parameters, especially the rainfall, is only one, but it has a relatively relevant contribution to the interannual variability of the NPP of tropical forests (Potter et al. 2009).
Figure 5. Net Primary Production in gC.m-2.yr-1 for neutral years.
In addition, the interannual variability of climatic parameters is dependent from one year to the other. By the way, Santos et al. (2011) observed that the storage of water in the soil in the west of Pará in years of La Niña continued to be high even in the driest period due to the prolongation of the rainy season due to the prolongation of the rainy season, causing the soil moisture to be higher than a normal year. The opposite was also observed in a normal year preceded by dry year.
Galvíncio and Sousa (2007) obtained similar results for the Cariri Paraibano, that is a Caatinga area. In the present research, it was observed that occurred ten hydrological years considered neutral from the point of view of ENOS phenomenon, but two of them occurred subsequently to La Niña events, 1985/86 and 1996/97, in these two periods the annual NPP values were higher than mean plus the standard deviation of the neutral periods.
The Caatinga showed a large spatial variability, especially in south and west. In 1981/82, the NPP reached values ranging 200-900 gC.m-2.yr-1, and the northern part of the Caatinga has sequestered the lowest values due this
year was a positive dipole and the previous year of El Niño episode.
The values in the NPP for Caatinga in 1983/84 were not so different from those in year 1991/92, mainly the northern part of Caatinga, it ranged from 300 to 800 gC.m-2.yr-1, Figure 5b. These low values were a result of a
strong El Niño in the previous year.
The period 1985/86, presented by Figure 5c, was that one, which had substantial increase in NPP from the northern part of the Caatinga, because it reached values between 700 and 1400 gC.m-2.yr-1, and in this year the rain,
hit in 1535 mm, where the average for this biome was 1076 mm. This increase in rainfall and hence the NPP was because this year was negative dipole and the last year of La Niña, which provides more rain in the northern area of the Caatinga (Cavalcanti 2012).
For the last neutral period, 1996/97, the Caatinga showed low values NPP in the northern part of the Caatinga, although not as low as shown in Figure 3c. It happened because that year was positive dipole and the last year a La Niña, which contributed to the reduction were not so high in carbon sequestration. The values obtained are close to those found by Morais et al. (2017) for the years of 2011 and 2012 in an area of Caatinga in Petrolina, Pernambuco State.
The Cerrado located in the northern part of the NEB reached high values, mainly because of the action of the negative dipole and La Niña in the previous year, as can be seen in Figures 5c and 5d, reaching values over 1400 gC.m-2.yr-1. These values are similar to those obtained by Potter et al. (2009) for the Brazilian Cerrado from
2001 to 2004.
The Atlantic Forest has sequestered 900-1200 gC.m-2.yr-1 for the period 1981/82, 700-1200 gC.m-2.yr-1 for the
period 1983/84, 1000 to 1200 gC.m-2.yr-1 for the 1985/86 period and 1000-1300 gC.m-2.yr-1 for the period 1996/97,
respectively.
It was observed that the lower values of NPP in the northern part of the NEB, which is the most vulnerable region to ENSO and Atlantic Dipole events. This explains the amount of 700 gC.m-2.yr-1 for the period 1983/84,
Figure 5b, to be lower than other periods because it was subsequent to a strong El Niño and one positive Dipole, influencing the rainfall in this period, which was well below average, only 722 mm.
It is important to note that NPP values are high, mainly in Amazon Rainforest and Atlantic Forest, even in neutral years. Cerrado and Caatinga are similar in amount carbon sequestration, although Caatinga presents more spatial variability.
Net Primary Production in El Niño Episodes
The spatial distribution of NPP in El Niño years is shown in Figure 6, and it is observed that in 1982/83 the NPP the Amazon rainforest reached values ranging from 900 to 1300 gC.m-2.yr-1. The NPP in the 1986/87 period
reached values between 1100 and 1600 gC.m-2.yr-1 and higher than that of the previous period. In 1991/92, the
amount of carbon sequestered by this biome was between 900 and 1300 gC.m-2.yr-1, the same value obtained in
1982/83 period. In the period 1997/98 the amounts reached between 1200 and 1500 gC.m-2.yr-1.
It was seen a similarity in the spatial distribution of the Amazon rainforest between the years 1986/87 and 1997/98, calling attention to the high values of carbon sequestration in El Niño years.
The year 1986 was negative dipole, contributing to greater volumes of rain, approximately 1500 mm, however 1997/98 needs better research to determine the factors that contributed to a higher volume of rainfall, about 1500 mm.
For the other biomes showed a decrease in precipitation and an increase in the Amazon rainforest, even in 1997 being a year of positive dipole.
Many researchers have already described the influence of ENSO and the Atlantic dipole on the precipitation in the Northeast and Amazon regions, such as Kayano and Andreoli (2007), Cavalcanti (2012) and Kayano and Capistrano (2014), which showed that in years of El Niño and/or positive Atlantic dipole there is a decrease of precipitation in the Northeast and Amazon and in years of La Niña and/or negative dipole there is an increase of precipitation.
Figure 6. Net primary production in gC.m-2.yr-1 for El Niño episodes
In 1997/98 was El Niño year and positive dipole, in the eastern part of the northeast area of the Caatinga the rainfall was below of the average, however, in the Amazon rainforest biome of Maranhão State the rainfall was above of average in the period 1997/98.
According to Grace (2005) and Yu and Chen (2016) an increase in precipitation up to 3000 mm/year may lead to an increase in NPP. Of course, climatic parameters are not the only factors that produce variability in the absorption of CO2 by plants, but it is one of them.
The north central part of the Caatinga was greatly affected during the episodes of El Niño, with a large variability in its spatial configuration, where certain areas did not sequester carbon, Figure 6c, while others reached values above 1000 gC.m-2.yr-1, Figures 6b and 6c.
The low values in the NPP mid-north of the Caatinga, especially in 1991/92, has been intensified by the positive Dipole of 1992. However, the highest amount reported in the mid-north part of the Caatinga in 1986/87 was due to the negative Dipole in 1986, which reduced the influence of El Niño.
Silva et al. (2017) carried out an experiment in the municipality of Serra Talhada, Pernambuco State, in a Caatinga area, obtained a CO2 absorption of 282 gC.m-2.yr-1 in the period from March 2014 to February 2015. This
value is close to those obtained in the present study for the Serra Talhada area (close to 8,0 oS and 38,3 oW) in the
years 1982/83, 1986/87 and 1991/92 (Figures 6a, 6b and 6c).
The Cerrado has showed high values of NPP in the northern part of the NEB, above 1300 gC.m-2.yr-1, and
sometimes sequestering the similarity of the Amazon rainforest (Figure 6c and 6d). However, the values obtained in this study for the Cerrado in El Niño years were similar to those of Potter et al. (2009) for the same biome and climatic conditions.
The Atlantic Forest that is located in the northern part of the NEB was the most affected during El Niño episodes and positive dipole, as shown in Figure 6c. As it moves to the south, there is an increase in the amounts of NPP, with the presence of a core of high value of NPP in southern NEB during all El Niño episodes.
During El Niño episodes, the Caatinga is the biome more affected with area no sequestering. These areas are not carbon sequestration because they are areas that have been affected by anthropic actions and desertification (MMA 2007).
Net Primary Production in La Niña Episodes
The NPP for La Niña years presented by Figure 7 shows that the Amazon rainforest has not sequestered larger amounts of carbon than the normal and El Niño episodes, even in years of negative dipole.
In the average of area of the Amazon Rainforest wich is inside of the NEB region, the NPP in La Niña years was higher than in the neutral and El Niño years. However, when testing for means comparisons using Student’s t, the differences of the means were not statistically significant. Therefore, it is not possible to state categorically that the NPP of the Amazon Rainforest Biome of the NEB in the years of La Niña is superior to those of other years.
It is noteworthy that Potter et al. (2009) analyzed the NPP of the Amazon Rainforest for the period from 2000 to 2004. They observed a higher value of NPP in La Niña years, but did not do any statistical test, since they had only one year of La Niña, one of El Niño and two neutrals. It is noteworthy still that Costa et al. (2009) making a NPP analysis for the Amazon Rainforest also obtained results similar to those of Potter et al. (2009) and those obtained in the present study.
The spatial distribution of NPP for the Cerrado was similar to that observed in El Niño events, but with higher value. This result is similar to that obtained by Potter et al. (2009).
The Caatinga deserves highlight because has sequestered high amounts of carbon, except the central and northern part in La Niña of 1998/99. This lower value in NPP occurred due a strong El Niño in previous year.
In fact, it is not the El Niño or La Niña that leads to greater or lesser uptake of carbon by the Caatinga. In general, in El Niño years in the Caatinga region there is a drastic reduction of precipitation, while, in La Niña years, in general, occurs an increase of precipitation in all Caatinga area.
This climate variability affects the balance of humidity and energy in the atmosphere and in the soil, and consequently in the vigor of the vegetation. In addition, it is not just the climatic variability that imposes variability in carbon absorption; plant physiology is also one of the factors.
Figure 7. Net Primary Production in gC.m-2.yr-1 for La Niña episode
The amount of carbon absorbed by the Atlantic Forest in episodes of La Niña was between 1000 and 1200 gC.m-2.yr-1, 900 and 1100 gC.m-2.yr -1 and 900-1400 gC.m-2.yr-1 as shown in Figure 7a to 7d, respectively. Their
values did not differ when compared with neutral and El Niño episodes, there were only differences of the El Niño of 1991/92 values.
When performing a statistical analysis of comparison of means, it is observed that the average carbon absorption by Atlantic Forest during the periods of events: La Niña, El Niño and neutral are not statistically different, since the Student’s t test for differences of means values did not present statistical significance.
Costa et al. (2009) obtained NPP of 1366 gC.m-2.yr-1 in Teixeira de Freitas, Bahia State, in an Atlantic Forest
area, in the year 2006, that is, a value similar to that obtained in this research for the area of Teixeira de Freitas (Figures 5 to 7).
It is important to note that Cao at al. (2001) showed values 900-1200 gC.m-2.yr-1 in NPP for Tropical Forest
The Caatinga is an exclusively Brazialian biome. It is known that the Northeastern Caatinga presents much higher trees than shrubs, however it also presents shrub areas, and Grace (2005) showed an average NPP of 500 gC.m-2.yr-1 for shrub areas.
But the northeastern Caatinga presented a large spatial variability, and showed higher values than Grace (2005), since NPP obtained for Caatinga presented values between 800 and 1000 gC.m-2.yr-1, in the year 1984/85 (Figure
5a), and between 200 and 500 gC.m-2.yr-1, in the year 1991/92 (Figure 4c).
The average for the whole period from 1981 to 1999 was 720 gC.m-2.yr-1. It is emphasized that Morais et al.
(2017) obtained NPP values between 500 and 700 gC.m-2.yr-1 for 2011 year and between 100 and 400 gC.m-2.yr-1,
in 2012, for the Caatinga area in the municipality of Petrolina, Pernambuco State.
Pachavo and Murwira (2014) found values of the NPP who have achieved 550 gC.m-2.yr-1 for the Savanna;
however, the Cerrado reached the highest.
Hashimoto et al. (2004) reported a decrease in NPP during episodes of El Niño, however, some northeastern biomes showed no reduction meant during these events, such as the Amazon rainforest, which reached similar values to La Niña events; the Cerrado and Atlantic Forest, basically have sequestered the same values in the three episodes under study.
It has been observed that the north central part of the Caatinga has reached the lowest values in NPP, especially in El Niño years. On the other hand, it also has noted, that during La Niña events, the Caatinga, which is located in the northern part of the Brazilian Northeast, showed high values in the NPP.
The Caatinga occupies the area of greatest climate variability of Brazil with periods of intense rains and large droughts (Ferreira and Mello 2005; Kayano and Andreoli 2007; Menezes et al. 2008; Cavalcante 2012; Kayano and Capistrano 2014). Therefore, it is a vegetation with adapted characteristics, over time, to the geomorphological, pedological and climate conditions of the area that occupies, thus it resists to great periods of drought, that generally occurs the fall of leaves, but when it starts the rainy period the vegetation of the Caatinga increases the foliage (Costa et al. 2017).
Thus, it was observed that in La Niña episodes, the amount of carbon sequestrated is greater than in others episodes, showing that northeastern biomes are able to carbon market.
c
onclusionsThe results show that the Amazon Rainforest, the Cerrado and Atlantic Forest are slightly influenced by episodes of ENSO or Atlantic Dipole, no significant changes occurring in carbon sequestration during these standards.
It was calculated the NPP averages for the four biomes and climate conditions of El Niño, positive dipole, La Niña, negative dipole and neutral. To test whether the mean of the same biome was different or not, the student’s t test for difference of means was performed. The only averages that presented statistically significant differences (p value < 0.05) were the NPP of the El Niño and La Niña periods of the Caatinga area.
Area with lower value of NPP in Caatinga agree with susceptible area of desertification, being more noted during El Niño events.
The values of the means of NPP of the others biomes did not present statistically significant differences. However, it is clear that the Caatinga presents large variability during occurrences of ENSO and Atlantic Dipole, particularly the mid-north part, causing decreased/increased carbon sequestration during El Niño/La Niña or positive/negative Dipole.
The climate conditions produced by these phenomena, such as drought with low soil moisture (El Niño, positive dipole) and rainy season with a longer rain period and higher humidity in the soil (La Niña, negative dipole).
The amount of rainfall in previous years of occurrence of ENSO and Dipole also influences the amount of carbon sequestered by biomes because in years of El Niño there is a decrease in rainfall and consequently lower humidity of the soil, occurring a decreasement on NPP. On the other hand, in year of La Niña there is an increase in precipitation and prolongation in the rainy season, providing a soil more moist than driest period resulting in a increase on NPP.
As during La Niña events the amount of carbon sequestrated is greater than during others events, La Niña events are very important to the carbon market.
r
eferencesBarbosa HA, Huete AR, Baethgen WE. 2006. A 20-year study of NDVI variability over the Northeast Region of Brazil.
Journal of Arid Environments, 67(2):288-307. http://dx.doi.org/10.1016/j.jaridenv.2006.02.022.
Baret F, Olioso O. 1989. Estimation à partir de mesures de réflectance spectrale du rayonnement photosynthétiquement actif absorbé PAR une culture de blé. Agronomie; 9(9):885-895. http://dx.doi.org/10.1051/agro:19890906.
Bastos A, Running S, Gouveia C, Trigo, RM. 2013. The global NPP dependence on ENSO: La Niña and the extraordinary year of 2011. Journal of Geophysical Research Biogeosciences, 118(3):1247–1255. http://dx.doi.org/10.1002/jgrg.20100.
Cao M, Zang Q, Shugart HH. 2001. Dynamic Responses of African Ecosystem Carbon Cycling to Climate Change. Climate Research, 17(2):183-193. http://dx.doi.org/10.3354/cr017183.
Cavalcanti IFA. 2012. Large scale and synoptic features associated with extreme precipitation over South America: A review and case studies for the first decade of the 21st century. Atmospheric Research, 118(15):27–40. http://dx.doi.org/10.1016/j.
atmosres.2012.06.012.
Chen B, Arain MA, Khomik M, Trofymow JA, Grant RF, Kurz WA et al. 2013. Evaluating the impacts of climate variability and disturbance regimes on the historic carbon budget of a forest landscape. Agricultural and Forest Meteorology,
180(10):265-280. http://dx.doi.org/10.1016/j.agrformet.2013.06.002.
Chino, DYT, Romani, LAS, Traina, AJM. 2010. Construindo séries temporais de imagens de satélite para sumarização de dados climáticos e monitoramento de safras agrícolas. Brasília:CNPTIA/EMBRAPA, 16 p. Avaliable in https://ainfo.cnptia. embrapa.br/digital/bitstream/item/23611/1/REIC2010.pdf Access in 20/02/2018.
Climate Prediction Center (CPC) / National Oceanic and Atmospheric Administration (NOAA). Cold & Warm Episodes by Season. 2018. http://origin.cpc.ncep.noaa.gov/products/analysis_monitoring/ensostuff/ONI_v5.php Access in 20/02/2018.
Costa MH, Nunes EL, Senna MCA, Imbuzeiro HMA. 2009. Estado-da-arte da simulação da taxa de fixação de carbono de ecossistemas tropicais. Revista Brasileira de Meteorologia, 24(2):179-187.
http://dx.doi.org/10.1590/S0102-77862009000200007.
Costa WLB, Braga CC, Alcantara CR, Costa AS. 2017. Phenological Dynamics of Vegetation Using the Enhanced Vegetation Index (EVI) in Regions of Bahia State. Journal of Hyperspectral Remote Sensing,7(7):399-407. https://doi.org/10.29150/
Crabtree R, Potter C, Mullen R, Sheldon J, Huang S, Harmsen J, Rodman A, Jean C. 2009. A modeling and spatio-temporal analysis framework for monitoring environmental change using NPP as an ecosystem indicator. Remote Sensing of Environment, 113(7):1486–1496. http://dx.doi.org/10.1016/j.rse.2008.12.014.
Fensholt R, Sandholt I, Rasmussen MS, Stisen S, Diouf A. 2006. Evaluation of satellite based primary production modeling in the semi-arid Sahel. Remote Sensing of Environment, 105(3):173-188. http://dx.doi.org/10.1016/j.rse.2006.06.011.
Ferreira WPM. 2006. Radiação Solar em Sete Lagoas – MG. Sete Lagoas: Embrapa, 21 p.
Ferreira AG, Mello NGS. 2005. Principais Sistemas Atmosféricos Atuantes sobre a Região Nordeste do Brasil e a Influência dos Oceanos Pacífico e Atlântico no Clima da Região. Revista Brasileira de Climatologia, 1(1): 15-28. http://dx.doi.
org/10.5380/abclima.v1i1.
Gang C, Zhang Y, Wang Z et al. 2017. Modeling the dynamics of distribution, extent, and NPP of global terrestrial ecosystems in response to future climate change. Global and Planetary Change, 148:153–165. http://dx.doi.org/10.1016/j.
gloplacha.2016.12.007.
Galvíncio JD, Sousa FAS. 2007. Avaliação do Desempenho de Modelo Hidrológico de Balanço Hídrico na Sub-bacia de Caraúbas, em anos de El Niño e La Niña. Revista Brasileira de Recursos Hídricos, 12(4):103-110. http://dx.doi.
org/10.21168/rbrh.v12n4.p103-110.
Grace JH. 2005. Role of forest biomes in the global carbon balance. In: Griffiths H, Jarvis PG (Eds). The carbon balance of forest biomes. Edinburg: Taylor & Francis; p. 19-47.
Hashimoto H, Nemani RR, White MA, Jolly WM, Piper SC, Keeling CD et al. 2004. El Niño–Southern Oscillation– induced variability in terrestrial carbon cycling. Journal of Geophysical Research, 109(D23):1-8. http://dx.doi.
org/10.1029/2004JD004959.
Hilker T, Hall FG, Coops NC, Lyapustin A, Wang Y, Nesic Z et al. 2010. Remote sensing of photosynthetic light-use efficiency across two forest biomes: Spatial scaling. Remote Sensing of Environment, 114(12):2863-2874. http://dx.doi.
org/10.1016/j.rse.2010.07.004.
Hao R, Yu D, Wu J. 2017. Relationship between paired ecosystem services in the grassland and agro-pastoral transitional zone of China using the constraint line method. Agriculture, Ecosystems & Environment, 240:171-181. http://dx.doi.
org/10.1016/j.agee.2017.02.015.
Instituto Brasileiro de Geografia e Estatística – IBGE. 2004. Accessed on 2015 aug. 05. Available from: http://www.ibge.gov. br/home/presidencia/noticias/21052004biomashtml.shtm.
Instituto Nacional de Meteorologia – INMET. Normais Climatológicas do Brasil período 1981 a 2010. Brasília:INMET, 2018. Availiable in http://www.inmet.gov.br/portal/index.php?r=clima/normaisClimatologicas. Accessed in 05/04/2018. Kalnay E, Kanamitsu M, Kistler R, Collins W, Deaven D, Gandin L et al. 1996. The NCEP/NCAR 40-year reanalysis project.
Bulletin American Meteorology Society, 77(3):437-471. http://dx.doi.org/10.1175/1520-0477(1996)077<0437:TNYR
P>2.0.CO;2.
Kayano MT, Andreoli RV. 2007. Relations of South American summer rainfall interannual variations with the Pacific decadal oscillation. International Journal of Climatology, 27(4):531-540. http://dx.doi.org/10.1002/joc.1417.
Kayano MT, Capistrano VB. 2014. How the Atlantic multidecadal oscillation (AMO) modifies the ENSO influence on the South American rainfall. International Journal of Climatology, 34:162–178. http://dx.doi.org/10.1002/joc.3674.
Kobayashi H, Dye DG. 2005. Atmospheric conditions for monitoring the long-term vegetation dynamics in the Amazon using normalized difference vegetation index. Remote Sensing of Environment, 97(4):519–525. http://dx.doi.org/10.1016/j.
rse.2005.06.007.
Landau EC. Biomas da Região Nordeste do Brasil. 2013. [cited 2015 oct. 22]. Avaliable in: http://panorama.cnpms.embrapa. br/mapas/geografia-do-milho-no-nordeste/mapa_aplmilho2009a11_biomas.jpg/view.
Li Z, Chen Y, Wang Y, Fang G. 2016. Dynamic changes in terrestrial net primary production and their effects on evapotranspiration. Hydrology and Earth System Science, 20:2169–2178. http://dx.doi.org/10.5194/hess-20-2169-2016.
Li P, Peng C, Wang M et al. 2017. Quantification of the response of global terrestrial net primary production to multifactor global change. Ecological Indicators, 76:245–255. http://dx.doi.org/10.1016/j.ecolind.2017.01.021.
Liang W, Yang Y, Fan D, Guan H, Zhang T, Long D, Zhou Y, Bai D. 2015. Analysis of spatial and temporal patterns of net primary production and their climate controls in China from 1982 to 2010. Agricultural and Forest Meteorology,
204:22–36. http://dx.doi.org/10.1016/j.agrformet.2015.01.015.
Marcuzzo FFN, Goularte ERP. 2013. Caracterização do ano hidrológico e mapeamento espacial das chuvas nos períodos úmido e seco do estado do Tocantins. Revista Brasileira de Geografia Física, 6(1):91-99.
McCallum I, Wagner W, Schmullius C, Shvidenko A, Obersteiner, M, Fritz S et al. 2010. Comparison of four global fAPAR datasets over Northern Eurasia for the year 2000. Remote Sensing of Environment, 114(5):941-949. http://dx.doi.
org/10.1016/j.rse.2009.12.009.
Menezes HEA, Brito JIB, Santos CAC, Silva LL. 2008. A relação entre a temperatura da superfície dos oceanos tropicais e a duração dos veranicos no Estado da Paraíba. Revista Brasileira de Meteorologia, 23(2):152-161. http://dx.doi.
org/10.1590/S0102-77862008000200004.
Ministério do Meio Ambiente. Atlas das Áreas Susceptíveis à Desertificação no Brasil. Brasília: MMA; 2007. Available on https://www.mma.gov.br/estruturas/sedr_desertif/_arquivos/129_08122008042625.pdf. Accessed in 12/16/2019.
Miranda E. Desafios e oportunidades para o desenvolvimento agropecuário e social nos Biomas do Nordeste Brasileiro. Brasília: Embrapa; 2010. Available on https://www.embrapa.br/gite/projetos/nordeste/150408_NORDESTEMAPA.pdf. Accessed in 01/13/2019.
Morais, YCB, Araújo, MSB, Moura, MSB, Galvíncio, JD, Miranda, RQ. 2017. Análise do Sequestro de Carbono em Áreas de Caatinga do Semiárido Pernambucano. Revista Brasileira de Meteorologia, 32(4):585-599. http://dx.doi.
org/10.1590/0102-7786324007).
Moura AD, Shukla J. 1981. On the dynamics of the droughts in northeast Brazil: Observations, theory and numerical experiments with a general circulation model. Journal of the Atmospheric Science, 38(12): 2653-2673. http://dx.doi.
org/10.1175/1520-0469(1981)038<2653:OTDODI>2.0.CO;2.
Nascimento RS, Brito JIB, Borges VP, Borges PF, Araújo LS. 2017. Variabilidade interanual dos teores de carbono absorvido nos biomas nordestinos e sua relação com fatores climáticos. Gaia Scientia, 11(3):232-242. http://dx.doi.org/10.21707/
Pachavo G, Murwira A. 2014. Remote sensing net primary productivity (NPP) estimation with the aid of GIS modelled shortwave radiation (SWR) in a Southern African Savanna. International Journal of Applied Earth Observation and Geoinformation, 30(1):217-226. http://dx.doi.org/10.1016/j.jag.2014.02.007.
Peng D, Zhang B, Wu C et al. 2017. Country-level net primary production distribution and response to drought and land cover change. Science of the Total Environment, 574:65–77. http://dx.doi.org/10.1016/j.scitotenv.2016.09.033.
Potter C, Klooster S, Huete A, Genovese V, Bustamante M, Ferreira LG, Oliveira Jr RC, Zepp R. 2009. Terrestrial carbon sinks in the Brazilian Amazon and Cerrado region predicted from MODIS satellite data and ecosystem modeling. Biogeosciences,
6:937–945. http://dx.doi.org/10.5194/bg-6-937-2009.
Saldarriaga JG, Luxmoore R. 1991. Solar energy conversion efficiencies during succession of a tropical rain forest in Amazonia. Journal of Tropical Ecology, 7(2):233-242. http://dx.doi.org/10.1017/S0266467400005393.
Santos SRQ, Silva RBC, Barreto PN, Nunes HGGC, Rodrigues RS, Campos TLOB. 2011. Regime térmico e hídrico do solo para área de Floresta Tropical em anos de El Niño e La Niña, Caxiuanã-pa: estudo de caso. Revista Brasileira de Meteorologia, 26(3):367-374. http://dx.doi.org/10.1590/S0102-77862011000300004.
Schwalm CR, Black TA, Amiro BD, Arain MA, Barr AG, Bourque CP et al. 2006. Photosynthetic light use efficiency of three biomes across an east–west continental-scale transect in Canada. Agricultural and Forest Meteorology, 140(1-4):269–286.
http://dx.doi.org/10.1016/j.agrformet.2006.06.010.
Silva MAO, Liporace FS. 2016. Detecção automática de nuvem e sombra de nuvem em imagens de sensoriamento remoto. Boletim de Ciências Geodésicas, 22(2):369-388. http://dx.doi.org/10.1590/S0102-77862011000300004.
Silva PF, Lima JRS, Antonino ACD, Souza R, Souza ES, Silva RI, Alves EM. 2017. Seasonal patterns of carbon dioxide, water and energy fluxes over the Caatinga and grassland in the semi-arid region of Brazil. Journal of Arid Environments,
147:71-82. http://dx.doi.org/10.1016/j.jaridenv.2017.09.003.
Wang Q, Zhao P, Ren H, Kakubari Y. 2008. Spatiotemporal dynamics of forest net primary production in China over the past two decades. Global and Planetary Change, 61(3-4):267–274. http://dx.doi.org/10.1016/j.gloplacha.2006.12.007.
Wang X, Li F, Gao R, Luo Y, Liu T. 2014. Predicted NPP spatiotemporal variations in a semiarid steppe watershed for historical and trending climates. Journal of Arid Environment, 114(5): 67-79. http://dx.doi.org/10.1016/j.jaridenv.2014.02.003.
Xu C, Liu M, An S, Chen JM, Yan P. 2007. Assessing the impact of urbanization on regional net primary productivity in Jiangyin County, China. Journal of Environmental Management, 85(3):597-606. http://dx.doi.org/10.1016/j.
jenvman.2006.08.015.
Yu B, Chen F. 2016. The global impact factors of net primary production in diferente land cover types from 2005 to 2011.