CARBON BALANCE AND CROP RESIDUE MANAGEMENT IN
DYNAMIC EQUILIBRIUM UNDER A NO-TILL SYSTEM IN
CAMPOS GERAIS
(1)Ademir de Oliveira Ferreira(2), João Carlos de Moraes Sá(3), Mônica Gabrielle Harms(4), Simone Miara(4), Clever Briedis(5), Caio Quadros Netto(6), Josiane Burkner dos Santos(7)
& Lutécia Beatriz Canalli(7)
SUMMARY
The adoption of no-tillage systems (NT) and the maintenance of crop residues on the soil surface result in the long-term increase of carbon (C) in the system, promoting C sequestration and reducing C-CO2 emissions to the atmosphere.The
purpose of this study was to evaluate the C sequestration rate and the minimum amount of crop residues required to maintain the dynamic C equilibrium (dC/ dt = 0) of two soils (Typic Hapludox) with different textural classes. The experiment was arranged in a 2 x 2 x 2 randomized block factorial design. The following factors were analyzed: (a) two soil types: Typic Hapludox (Oxisol) with medium texture (LVTM) and Oxisol with clay texture (LVTA), (b) two sampling layers (0-5 and 5-20 cm), and (c) two sampling periods (P1 - October 2007; P2 - September 2008). Samples were collected from fields under a long-term (20 years) NT system with the following crop rotations: wheat/soybean/black oat + vetch/maize (LVTM) and wheat/maize/ black oat + vetch/soybean (LVTA). The annual C sequestration rates were 0.83 and 0.76 Mg ha-1 for LVTM and LVTA, respectively. The estimates of the minimum
amount of crop residues required to maintain a dynamic equilibrium (dC/dt = 0) were 7.13 and 6.53 Mg ha-1 year-1 for LVTM and LVTA, respectively. The C conversion
rate in both studied soils was lower than that reported in other studies in the region, resulting in a greater amount of crop residues left on the soil surface.
Index terms: C sequestration rate, soil texture, subtropical soils.
(1) Received for publication in July 25, 2011 and approved in July 10, 2012.
(2) Posgraduate student (PhD) in Soil Sciences, Department of Soil Management and Conservation. Federal University of Santa
Maria (Universidade Federal de Santa Maria - UFSM). Av. Roraima, 1000. Camobi. CEP 97105900 Santa Maria (RS). CNPq scholarship. E-mail: [email protected]
(3) Adjunct Professor, Department of Soils and Agricultural Engineering. Ponta Grossa State University (Universidade Estadual
de Ponta Grossa - UEPG). Av. Gal. Carlos Cavalcanti, 4748. CEP 84030-900 Ponta Grossa (PR). E-mail: [email protected]
(4) Agronomist, Graduate student (Masters), UEPG. E-mails: [email protected]; [email protected]
(5) Graduate student (PhD) in Agronomy, Department of Soils and Agricultural Engineering, UEPG. E-mail: [email protected] (6) Faculty member of the Agronomy course UEPG. E-mail: [email protected]
RESUMO: BALANÇO DE CARBONO E MANEJO DE RESÍDUOS CULTURAIS
EM EQUILÍBRIO DINÂMICO SOB SISTEMA PLANTIO DIRETO NOS CAMPOS GERAIS
A adoção do sistema plantio direto e a manutenção dos resíduos culturais na superfície do solo resultam, com o passar dos anos, em adição de carbono (C) ao sistema, o que promove o sequestro de C e a mitigação de emissões de C-CO2 para a atmosfera. O objetivo deste trabalho foi avaliar a taxa de sequestro de C e a quantidade mínima de resíduos culturais necessária para manter o equilíbrio dinâmico (dC/dt = 0) de dois solos (Latossolo) com classes texturais diferentes. O delineamento experimental utilizado foi blocos ao acaso em arranjo fatorial 2 x 2 x 2. Os fatores analisados foram: (a) dois solos: Latossolo Vermelho distrófico típico, com classe textural franco-argiloarenosa (LVTM), e Latossolo Vermelho distrófico típico, com classe textural franco-argilosa (LVTA); (b) profundidades de amostragem: 0-0,05 e 0,05-0,20 m; e (c) épocas de amostragem (E1-outubro de 2007; E2-setembro de 2008). As lavouras onde foram coletadas as amostras vinham sendo manejadas em SPD por longo prazo (20 anos), com as seguintes rotações de cultura: trigo/soja/aveia-preta + ervilhaca/milho (LVTM) e trigo/milho/ aveia-preta + ervilhaca/soja (LVTA). A taxa de sequestro anual de C foi de 0,83 e 0,76 Mg ha-1 para o LVTM e LVTA, respectivamente. A estimativa da quantidade mínima de resíduos culturais necessária para manter o equilíbrio dinâmico (dC/dt = 0) foi de 7,13 e 6,53 Mg ha-1 ano-1 para o LVTM e LVTA, respectivamente. A taxa de conversão de C em ambos os solos foi inferior à encontrada em outros estudos regionais, resultando numa elevada taxa de remanescente de palha na superfície do solo.
Termos de indexação: taxa de sequestro de C, textura do solo, solos subtropicais.
INTRODUCTION
The adoption of conservation agriculture associated with an appropriate crop rotation system can result in annual increases in soil carbon (C) of 5.12 to 6.20 Mg ha-1 (Campos et al., 2011) and has become a key
approach to reducing greenhouse gases (Lal, 2007). Over time, the plant residues left on the soil surface lead to the conversion of organic C to soil C and, consequently, to the recovery of soil organic matter (SOM) (Sá & Lal, 2009; Boddey et al., 2010).
SOM acts as a key component of soil quality because of its associated chemical, physical and biological properties. Depending on the management practice, soil can act as a source or sink of atmospheric CO2,
directly influencing the greenhouse effect. From an agricultural perspective, soil becomes a CO2 source
to the atmosphere when oxidation losses exceed the C from crop residues (Sá et al., 2008; Sá & Lal, 2009).
When native ecosystems are converted for agriculture, the dynamic equilibrium (dC/dt = 0) is disrupted, leading to a reduction in SOM levels (Cerri et al., 2008). The amount of lost SOM varies according to the soil management system, the crop system, and climatic conditions (Sá et al., 2008; Bayer et al., 2011). The practices of plowing and disking to prepare the soil for cultivation are the major causes of SOM loss (Bruce et al., 1999; Sá et al., 2008), which occurs by the following processes: a) the disruption of aggregates exposes SOM to microbial attack; b) the mixture of fresh organic matter with soil results in more favorable conditions for decomposition; and c) increased
microbial activity, as a result of increased soil aeration and supply of labile organic matter (OM), raises C mineralization levels (Reicosky, 1995). The severity of SOM losses is greater in tropical environments than in other regions (Lal & Logan, 1995).
Several models have been used to describe alterations in SOM over time. The complexity of these models varies from simple and unicompartmental approaches, such as that proposed by Hénin & Dupuis (1945), to the multicompartmental models proposed by Jenkinson & Rainer (1977), van Veen & Paul (1981), Janssen (1984), and Parton et al. (1987). Some authors have used more simplified models to evaluate SOM transformation under cultivation and soil preparation systems (Bayer et al., 2006). The results reported by Bayer et al. (2006) for a subtropical region using a first-order unicompartmental model allowed for an estimation of coefficients of the conversion and loss of C in addition to an estimation of the C sequestration rates associated with crop rotation and soil management.
long-term NT on soils with different texture in the region of Campos Gerais.
MATERIALS AND METHODS Study area
In this study, two soils (Oxisols) were evaluated after long-term NT. The area is located at 990 m a.s.l. at the geographic coordinates 25° 05’ 49" S and 50° 03’ 11" W, and belongs to the Fazenda Escola Capão da Onça - FESCON, in Ponta Grossa, State of Paraná (PR), Brazil. The climate of the region was classified as humid subtropical (mesothermal). During the experimental period, from October 2007 to September 2008, the maximum average temperature was 26 °C, the minimum 13 °C (Table 1), and the total rainfall 1,558 mm (Iapar, 2008).
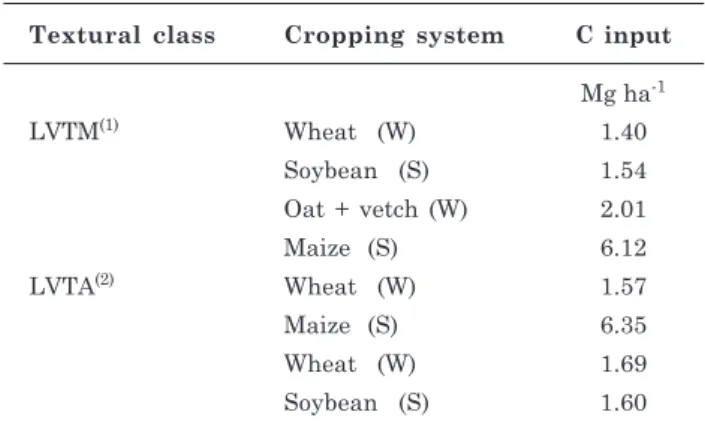
Samples were collected from fields that were managed under long-term NT (20 years) with the following crop rotation: wheat/soybean/black oat + vetch/maize. The NT system of the study area is characterized as consolidated according to the evolution scale proposed by Sá (2004). The average amount of crop residue in the study areas was 5.16 Mg ha-1. Table 2 presents the average amount of C
added to the soil through plant residues.
The first soil, herein referred to as LVTM, was classified as a Typic Hapludox (Oxisol), medium texture (232.5 g kg-1 clay), with an average slope of 7
%. The second soil, herein referred to as LVTA, also a Typic Hapludox (Oxisol), clay texture (401 g kg-1 clay),
but with an average slope of 4 %. Mineralogy was analyzed in samples from the top layer of the toposequence of the profiles of these Oxisols (Figure 1) and from three horizons (Ap, Bw1, and Bw2), in which kaolinite, gibbsite, and vermiculite with an aluminum interlayer were observed (V-AL) (Sá, 1995).
Two layers (0-5 and 5-20 cm) were sampled in two sampling periods: after the wheat harvest in October 2007 (P1) and following the mechanical management of black oat + vetch in September 2008 (P2). Additional
detailed information on the soil properties were provided by Ferreira et al. (2011).
Experimental design
The experimental design consisted of randomized blocks with a 2 x 2 x 2 factorial scheme. The following factors were analyzed: (a) two soils (LVTM and LVTA), (b) two sampling layers (0-5 and 5-20 cm), and (c) two sampling periods (October 2007 - P1, and
September 2008 - P2).
Granulometric and chemical analyses Particle size analysis was performed using the Bouyoucos method, according to Embrapa (1997).
Description
Month
Mean
Jan Feb Mar Apr May Jun Jul Aug Sep Oct Nov Dec
Historical data(1) Rainfall (mm) 188 155 136 105 118 115 95 80 134 149 120 150 119.1
Tmax (°C) 28 27 26 24 22 20 20 22 29 24 26 27 24.5
Tmin (°C) 17 17 16 14 11 9 9 10 12 14 15 16 13.3
2007-2008(2) Rainfall (mm) 60 195 214 154 158 105 161 83 137 54 184 53 129.8
Tmax (°C) 28 28 30 28 30 28 27 23 20 25 23 24 23.6
Tmin (°C) 15 15 16 17 17 17 14 10 9 9 11 11 13.4
Table 1. Monthly rainfall distribution as a function of the average maximum (Tmax) and minimum (Tmin) temperatures
(1) Historical data for Ponta Grossa collected from January to December over 44 years. (2) Data collected during the experimental
period from October 2007 to September 2008.
Textural class Cropping system C input
Mg ha-1
LVTM(1) Wheat (W) 1.40
Soybean (S) 1.54
Oat + vetch (W) 2.01
Maize (S) 6.12
LVTA(2) Wheat (W) 1.57
Maize (S) 6.35
Wheat (W) 1.69
Soybean (S) 1.60
Table 2. Average carbon input derived from the dry matter of winter (W) and summer (S) crops in two soils with different texture
(1)Typic Hapludox (Oxisol), medium texture; (2)Typic Hapludox
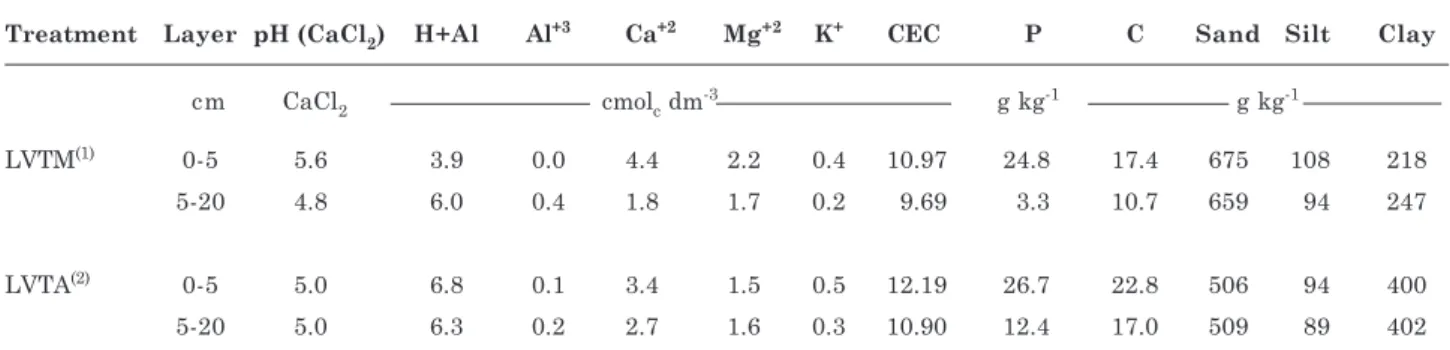
Chemical analyses were performed according to Pavan et al. (1992), in composite samples (10 sub-samples) from the layers 0-5 and 5-20 cm (Table 3).
Determination of carbon contents and stocks The soil samples were finely ground in a porcelain mortar, sieved through a 0.053 mm sieve, and subsequently placed in an oven at 40 °C to complete drying. The carbon contents in these samples were determined using a dry combustion method with a TruSpec CN LECO® analyzer (St. Joseph, MI, USA).
The estimations of C stocks according to equation 1 based on C content data are expressed in g kg-1 and
transformed into g Mg-1 (Equation 1):
C stock (Mg ha-1) = C (kg Mg-1) x DS (Mg m-3) x SDV (m3) (1)
The soil density (DS) data, expressed in g cm-3,
were transformed into Mg m-3, and the sampling depth
volume (SDV) data are expressed in m3.
Calculation of the C balance
Using the unicompartmental model proposed by Hénin & Dupuis (1945), the C balance was calculated
to predict the changes in SOM. The unicompartmental model estimates the C balance based on the dynamic equilibrium concept (dC/dt = 0) of SOM according to the amounts of C added, characterized as “inputs”, and losses through oxidation, referred to as “outputs” of the system, according to equation 2:
dC/dt = -K2C + K1A (2) where dC/dt = the annual rate of soil organic carbon (SOC) variation in Mg ha-1, A = the amount of organic
C added by crop residues annually in Mg ha-1, K 1 = the
humidification coefficient representing the percentage of C added that will become SOC, C = stock of SOC in Mg ha-1, and K
2 = annual coefficient of SOC lost via
SOM oxidation. Both the input (K1A) and annual loss of humidified organic matter (K2C) vary according to
the soil type, crop system, and management system.
Additional parameters related to C balance with various management systems
Harvest index: amount of dry matter produced per grain unit (Table 4), which is expressed in Mg of dry matter per Mg of harvested grain.
Root dry matter index: the amount of root dry matter (DM) produced in Mg of grains (Table 4), which is expressed as the percentage of grain yield corresponding to root DM.
Percentage of carbon in dry matter: the amount of C in crop residues calculated according to Sá et al. (2001) (Table 4).
K1: the humidification coefficient, which is calculated
based on the coefficient proposed by Sá et al. (2001) (K1 = 0.265) for a crop rotation system (black oat/ maize/black oat/soybean/wheat/soybean) in the same region.
K2: the oxidation coefficient for SOM. This coefficient
was proposed by Sá et al. (2006) to calculate the C balance in the same region. The values calculated here were K2= 0.025 for LVTMand K2= 0.023 for LVTA.
Crop residues equivalent (CRE):the minimum amount of dry matter (DM of shoots and roots) required to LVTA(2)
LVTM(1)
Figure 1. Topographic profile of the toposequence.
(1)Typic Hapludox (Oxisol) with medium texture; (2)Typic Hapludox (Oxisol) with clay texture.
Source: Ferreira et al. (2011).
Treatment Layer pH (CaCl2) H+Al Al+3 Ca+2 Mg+2 K+ CEC P C Sand Silt Clay
cm CaCl2 cmolc dm-3 g kg-1 g kg-1
LVTM(1) 0-5 5.6 3.9 0.0 4.4 2.2 0.4 10.97 24.8 17.4 675 108 218
5-20 4.8 6.0 0.4 1.8 1.7 0.2 9.69 3.3 10.7 659 94 247
LVTA(2) 0-5 5.0 6.8 0.1 3.4 1.5 0.5 12.19 26.7 22.8 506 94 400
5-20 5.0 6.3 0.2 2.7 1.6 0.3 10.90 12.4 17.0 509 89 402
Table 3. Chemical and physical properties of the studied soils
maintain the dynamic equilibrium of the system, according to equation 3:
CRE = C sequestered x 3.77 x 2.28 (3) where sequestered C is the annual rate of accumulated C estimated based on the Hénin & Dupuis (1945) model, 3.77 is the factor used for the transformation of humidified C in the C input (1/0.265 = 3.77), 2.28 is the factor used for the transformation of the C input in crop residues (100 %/43.8 % = 2.28), and 43.8 % (e.g., 438 g kg-1 C) is the C content in
the crop residue.
Indices to calculate C balance
Data of grain yield and shoot, and root and total dry matter of the crops grown under the different soil management systems are summarized in table 4. These values were used to compute additional parameters related to the C balance.
Dynamic equilibrium
The C inputs are equivalent to the C outputs when dC/dt = 0, indicating that the system is dynamically equilibrated. However, if dC/dt ≠ 0, two scenarios are possible: a) when C inputs exceed C outputs, the system is accumulating carbon, and the balance will be positive, and b) when C inputs are lower than C outputs, the system is losing carbon, and the balance will be negative.
The conversion of organic C to soil C was calculated based on the variation in the remaining residues, according to equation 4:
C conversion = (CR + added C) - C Rem)/ Seq. C (4)
where CR = 3.77 is the factor used for the transformation of humidified C into added C (1/ 0.265= 3.77), added C = the C input, C Rem = carbon in the residues remaining from the crop prior to sampling (P1 - October 2007; P2 - September 2008), and Seq. C = dC/dt.
Sampling and determination of soil density Undisturbed soil samples were collected from the layers of 0-5, 5-10, and 10-20 cm with an Uhland sampler (Embrapa, 1997). The average results from 5-10 and 10-20 cm were used to represent the 5-20 cm layer. Ring samplers were employed to perform collections between 12.5 and 17.5 cm in the 10-20 cm layer. Therefore, nine samples were collected for each treatment, and three samples were collected from each layer (triplicates).
Disturbed samples were collected from the same layers and the total organic carbon (TOC) contents were determined using a CN TruSpec LECO analyzer, St. Joseph, MI, USA.
Statistical analysis
The results were subjected to an analysis of variance (ANOVA) using SISVAR 5.0 software (Ferreira, 2010) using Tukey’s test at the 5 %. Regression analysis was applied to identify the relationship among variables using JMP IN® software Version 3.2.1 (Sall et al., 2005) with an F test at a 5 %.
RESULTS AND DISCUSSION C Balance
The carbon sequestration rates estimated for the 0-20 cm layer (Table 5) using the unicompartmental model were 0.83 Mg ha-1 year-1 for LVTM and 0.76
Mg ha-1 year-1 for LVTA.
Sá et al. (2001) reported a C sequestration rate of 0.81 Mg ha-1 year-1 in the 0-20 cm layer in an area
with an LVTA soil (460 g kg-1 clay) near the study
area. In another study involving long-term management systems and an LVTA soil (480 to 500 g kg-1 clay), the C sequestration rate under NT was
0.99 Mg ha-1 year-1 (Sá et al., 2008).
According to the results of this study, the clay content and the C input through crop residue in particular were the primary sources of the observed variations in the C sequestration rates. This phenomenon was also discussed by Bayer et al. (2011) in a study of soil in Rio Grande do Sul and by Zinn et al. (2005) for Oxisol in the Cerrado biome region. These authors reported a correlation between C sequestration rates and the soil texture.
However, the amount and quality of crop residues have been mentioned in several studies as the major factors affecting C sequestration in tropical and subtropical soils (Sá et al., 2008; Campos et al., 2011). The crop rotation combination including legumes intercropped with winter grasses further increases this potential for C sequestration (Amado et al., 2006; Urquiaga et al., 2010). The annual carbon inputs Cropping systems Index
(1)
Carbon(2) K 1(3) Harvest RDM
g kg-1
Oat 1.00 0.23 43.8 0.265
Maize 1.10 0.25 45.5 0.265
Wheat 0.95 0.15 45.0 0.265
Soybean 0.89 0.20 39.5 0.265
Table 4. Harvest and root dry matter (RDM) indices and carbon content in the crop residues
(1)Index obtained based on results associated with maize cultivation: index values of 1.10 and 0.25 for maize cultivation indicate that 1 Mg of grain yields the equivalent of 1.1 Mg of shoot dry matter and 0.25 Mg for root dry matter; (2)Determined by dry combustion; (3)As proposed by Sá et al. (2001), K
1
reported in these studies ranged from 4.0 to 6.0 Mg ha-1, which corresponds to an annual amount of crop
residues of approximately 9.1 to 13.7 Mg ha-1 year-1.
However, the average C input in this study was 8.0 Mg ha-1, i.e., 18.3 Mg ha-1 year-1. The major C
contribution in the input came from maize residues in the LVTM soil which increased 77.12, 74.84, and 67.16 % of the C input obtained from wheat, soybean, and black oat + vetch grass crops, respectively. In contrast, in the LVTA soil, the C inputs from maize represented 74.32 and 74.80 % of the added C when compared to wheat and soybean crops, respectively (Table 2). These results indicate that maize in a crop rotation affects the amount of C input that is transformed to sequestered C. Bayer et al. (2011) reported a C accumulation rate of 0.15 Mg ha-1 year-1
when maize was included in the crop rotation. However, they reported a decrease in C accumulation of 0.27 Mg ha-1 year-1 in a soybean monoculture. The
same trend were reported by Amado et al. (2006) and Campos et al. (2011) in subtropical environments corroborating these observations, and demonstrating that the inclusion of maize in a rotation combined with legumes as preceding crop increase the C sequestration potential significantly.
According to Sá et al. (2008), crop rotation systems are C-deficient in the absence of maize crops because the C sequestration rate is related to the biomass production. Any climatic change that reduces C inputs may result in a negative balance. Therefore, rotation plans should include crops with the ability to offset a negative C balance whenever the crop succession in a given year does not provide the necessary amount of crop residues.
C stock
The C stocks in the 0-20 cm layer were 38.22 and 48.44 Mg ha-1 for LVTMand LVTA, respectively (Table
5). In the 0-5 cm layer, the C stocks were 13.35 and 13.88 Mg ha-1 for LVTMand LVTA, respectively. The
C stocks in the 5-20 cm layer were 24.87 and 34.56 Mg ha-1 for LVTMand LVTA, respectively. Therefore,
the C stock in the 0-20 cm layer was 21.1 % greater for LVTA than for LVTM. This difference between soils was primarily related to the texture (Zinn et al., 2005). In contrast, in the surface layer (0-5 cm), no significant difference was observed in the C stocks of the two soils. This result was most likely due to the addition of crop residues (Table 5), the location of the soil in the toposequence (Figure 1), or the slope (the LVTM is located 3 cm m-1 above the LVTA).
The amount of crop residue required to maintain the dynamic equilibrium
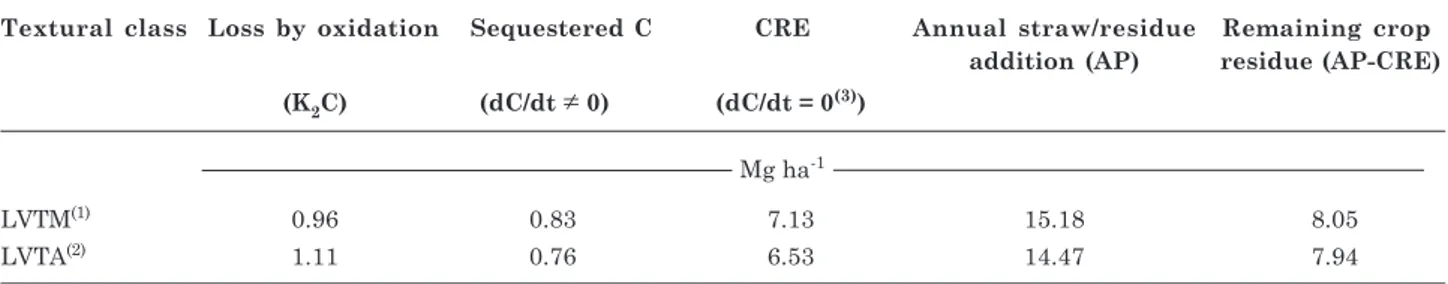
The minimum amounts of crop residues needed to maintain the dynamic C equilibrium for LVTM and LVTA were 7.13 and 6.53 Mg ha-1 year-1, respectively
(Table 6). These values are lower than those reported by Sá et al. (2006, 2008), who stated that the minimum amount of crop residues to be added to the soil surface under NT ranges from 7.0 to 8.5 Mg ha-1
year-1. This smaller amount of crop residues required
to maintain the dynamic equilibrium resulted from the greater amount of crop residues that was present and accumulated over time in this study, thereby leading to increased C addition, especially when maize was included in the rotation (Table 2).
The remaining amounts of crop residue estimated with the unicompartmental model in the present study were 8.05 and 7.94 Mg ha-1 for LVTMand
LVTA, respectively (Table 6), and the average estimated amount of remaining crop residues was 8.0 Mg ha-1 year-1, which was greater than the value
of 5.04 Mg ha-1 obtained by Sá et al. (2006). This
difference was attributed to the low C conversion rates observed in this study (12.63 % for LVTMand 14.26 % for LVTA).
Using these simple measures and a greater number of repetitions, the C sequestration rates from fields under NT systems can be estimated. Moreover, the
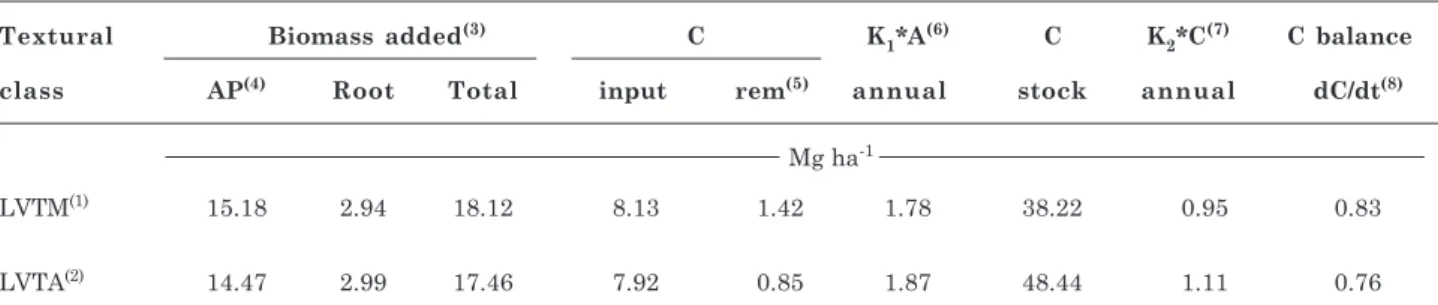
(1)Typic Hapludox (Oxisol), medium texture; (2)Typic Hapludox (Oxisol), clay texture; (3)biomass added over oneyear to LVTM (oat intercropped with common vetch + maize) and LVTA (wheat + maize); (4)AP = aerial part; (5)RemC.= carbon remaining from crop residues prior to the two samplings (P1 - October 2007; P2 - September 2008); (6)K
1*A = humidified carbon based on the coefficient
proposed by Sá et al. (2001) (K1=0.265), where A = carbon input - RemC.; (7)K2*C= C loss calculated based on the oxidation coefficient, K2 = 0.025 for LVTMand K2 = 0.023 for LVTA, proposed by Santos (2006) and Sá et al. (2006), where C = C stock; (8)dC/ dt = -K2C + K1A.
Textural Biomass added(3) C K
1*A
(6) C K
2*C
(7) C balance
class AP(4) Root Total input rem(5) annual stock annual dC/dt(8)
Mg ha-1
LVTM(1) 15.18 2.94 18.12 8.13 1.42 1.78 38.22 0.95 0.83
LVTA(2) 14.47 2.99 17.46 7.92 0.85 1.87 48.44 1.11 0.76
procedures described in this study may be a useful tool of increasing C stock inventories at a regional scale. This approach has been used in other subtropical regions (Amado et al., 2006; Bayer et al., 2006), demonstrating that knowledge of the minimum amount of crop residue to be added to NT systems is essential for the sustainability of the systems.
It is worth noting that the results of this study are only valid at a regional scale; i.e., they cannot be extrapolated to other regions of Brazil because the C balance predicted by the unicompartmental model depends directly on climatic variations, soil texture, the crop rotation system, quantity and quality of the crop residues, and the coefficients of humidification (K1) and oxidation (K2).
In the present study, a smaller amount of crop residue was required to maintain the dynamic balance of the soil with the higher clay content (LVTA) (dC/dt = 0). This result was expected because the clay content, along with that of silt, have been considered the major factors determining the ability to protect soil C from degradation (Six et al., 2002). Thus, the C protection capability of clayey soils is greater than of other soil types (Zinn et al., 2007; Bayer et al., 2011).
CONCLUSIONS
1. The estimated minimum amount of crop residues required to maintain the dynamic balance (dC/dt = 0) of the system in the studied area was 6.83 Mg ha-1.
2. LVTM required 0.6 Mg ha-1 more crop residue
than LVTA to maintain the dynamic balance of the consolidated NT system in Campos Gerais.
3. In both soils, the C conversion rate was lower than in other studies in the same region, resulting in a greater amount of crop residue remaining on the
soil surface. As a consequence, any extrapolation of results of this study to other regions of Brazil should take local factors, such as the climate variability, soil texture, and the specific characteristics of the adopted management system into consideration.
LITERATURE CITED
AMADO, T.J.; BAYER, C.; CONCEIÇÃO, P.C.; SPAGNOLLO, E.; CAMPOS, B-H.C. & VEIGA, M. Potential of C accumulation in no-till soils with intensive use and cover crops in Brazil. J. Environ. Qual., 35:1599-1607, 2006. BRUCE, J.P.; FROME, M.; HAITES, E.; JANZEN, H. & LAL,
R. Carbon sequestration in soils. J. Soil Water Conserv., 5:382-389, 1999.
BAYER, C.; MARTIN-NETO, L.; MIELNICZUK, J.; PAVINATO, A. & DIECKOW. J. Carbon sequestration in two Brazilian Cerrado soils under no-till. Soil Tillage Res., 86:237-245, 2006.
BAYER, C.; AMADO, T.J.C.; TORNQUIST, C.G.; CERRI, C.E.P.; DIECKOW, J.; ZANATTA, J.A. & NICOLOSO, R.S. Estabilização do carbono no solo e mitigação das emissões de gases de efeito estufa na agricultura conservacionista. In: KLAUBERG FILHO, O.; MAFRA, A.L. & GATIBONI, L.C., eds. Tópicos em ciência do solo. Viçosa, MG, 2011. v.7. p.55-118.
BODDEY, R.M.; JANTALIA, C.P.; CONCEIÇÃO, P.C.; ZANATTA, J.A.; BAYER, C.; MIELNICZUK, J.; DIECKOW, J.; SANTOS, H.P.; DENARDIN, J.E.; AITA, C.; GIACOMINI, S.J.; ALVES, B.J.R. & URQUIAGA, S. Carbon accumulation at depth in Ferralsols under zero-till subtropical agriculture. Global Change Biol., 16:784-795, 2010.
CAMPOS, B.C.; AMADO, T.J.C.; BAYER, C.; NICOLOSO, R . S . & F I O R I N , J . E . C a r b o n s t o c k a n d i t s compartments in a subtropical oxisol under long-term tillage and cropping systems. R. Bras. Ci. Solo, 35:805-817, 2011.
Textural class Loss by oxidation Sequestered C CRE Annual straw/residue Remaining crop addition (AP) residue (AP-CRE)
(K2C) (dC/dt 0) (dC/dt = 0(3))
Mg ha-1
LVTM(1) 0.96 0.83 7.13 15.18 8.05
LVTA(2) 1.11 0.76 6.53 14.47 7.94
Table 6. Amount of crop residues equivalent (CRE) to maintain the dynamic carbon equilibrium in a Typic Hapludox (Oxisol) with medium texture, and clay texture under a long-term no-till system
CERRI, C.E.P.; FEIGL, B. & CERRI, C.C. Dinâmica da matéria orgânica do solo na Amazônia. In: SANTOS, G.A.; SILVA, L.S.; CANELLAS, L.P. & CAMARGO, F.O., eds. Fundamentos da matéria orgânica do solo: Ecossistemas tropicais e subtropicais. 2.ed. Porto Alegre, Metrópole, 2008. p.325-358,
EMPRESA BRASILEIRA DE PESQUISA AGROPECUÁRIA -EMBRAPA. Centro Nacional de Pesquisa de Solos. Manual de métodos de análise de solos. 2.ed. Rio de Janeiro, 1997. 212p.
FERREIRA, D.F. Sisvar versão 5.3 (Biud 75). Sistemas de análises de variância para dados balanceados: Programa de análises estatísticas e planejamento de experimentos. Lavras, Universidade Federal de Lavras, 2010.
FERREIRA, A.O.; SÁ, J.C.M.; GIAROLA, N.F.B.; HARMS, M.G.; MIARA, S.; BAVOSO, M.A.; BRIEDIS, C. & QUADROS NETTO, C. Variação na resistência tênsil de agregados em função do conteúdo de carbono em dois solos na região dos Campos Gerais.R. Bras. Ci. Solo, 35:437-446, 2011.
HÉNIN, S. & DUPUIS, M. Essai de bilan de la matière organique des sols. Ann. Agron., 15:161-172, 1945. INSTITUTO AGRONÔMICO DO PARANA - IAPAR. Dados
climatológicos de Ponta Grossa - 2008. Ponta Grossa, 2008. 22p.
JANSSEN, B.H. A simple method for calculating decomposition and accumulation of “Young” soil organic matter. Plant Soil, 76:297-304, 1984.
JENKINSON, D.S. & RAYNER, J.H. The turnover of soil organic matter in some of the Rothamsted classical experiments. J. Soil Sci., 123:298-305, 1977.
LAL, R. & LOGAN, T.J. Agricultural activities and greenhouse gas emissions from soils of the tropics. In: LAL, R., KIMBLE, J.M.; LEVINE, E. & STEWART, B.A., eds. Soil management greenhouse effect. Boca Raton, CRC Press, 1995. p.293-307.
LAL, R. Soil science and the carbon civilization. Soil Sci. Soc. Am. J., 71:1425-1437, 2007.
PARTON, W.J.; SCHIMEL, D.S.; COLE, C.V. & OJIMA, D.S. Analysis of factors controlling soil organic matter levels in Great Plains grasslands. Soil Sci. Soc. Am. J., 51:1173-1179, 1987.
PAVAN, M.A.; BLOCH, M.F.; ZEMPULSKI, H.C.; MIYAZAWA, M. & ZOCOLER, P.C. Manual de análise química do solo e controle de qualidade. Campinas, Instituto Agronômico do Paraná, 1992. 38p. (Circular, 76)
REICOSKY, D.C.; KEMPER, W.D.; LANGDALE, G.W.; DOUGLAS JR., C.L. & RASMUSSEN, P.E. Soil organic matter changes resulting from tillage and biomass production. J. Soil Water Conserv., 50:253-261, 1995.
SÁ, M.M.F. Influência do material de origem, superfícies geomórficas e posição na vertente nos atributos do solo da região dos Campos Gerais, PR. Curitiba, Universidade Federal do Paraná, 1995. 205p. (Tese de Mestrado) SÁ, J.C.M.; CERRI, C.C.; DICK, W.A.; LAL, R.;
VENSKE-FILHO, S.P.; PICCOLO, M.C. & FEIGL, B.E. Organic matter dynamics and carbon sequestration rates for a tillage chronosequence in a Brazilian Oxisol. Soil Sci. Soc. Am. J., 65:1486-1499, 2001.
SÁ, J.C.M. Adubação fosfatada no sistema plantio direto. In: YAMADA, T. & ABDALLA, S.R.S., eds. SIMPÓSIO SOBRE FÓSFORO NA AGRICULTURA BRASILEIRA, Piracicaba, 2004. Trabalhos... Piracicaba, Associação Brasileira para a Pesquisa da Potassa e do Fosfato, 2004. p.201-222.
SÁ, J.C.M.; SANTOS, J.B.; CARDOSO, E.G.; JUNIOR, D.S.; FERREIRA, C.F.; OLIVEIRA, A.; SÁ, M.F.M.; SEGUY, L. & BOUZINAC, S. Usos alternativos da palhada residual da produção de sementes para pastagens. São Paulo, Embrapa, 2006. p.193-221.
SÁ, J.C.M.; SA, M.F.M.; SANTOS, J.B. & FERREIRA, A.O. Dinâmica da Matéria Orgânica nos Campos Gerais.. In: SANTOS, I.; ARAÚJO, G.; SOUZA, S.L.; PASQUALOTO, C.L. & CAMARGO, F.A.O., eds. Fundamentos da matéria orgânica do solo: Ecossistemas tropicais & subtropicais. 2.ed. Porto Alegre, Metrópole, 2008. p.443-461.
SÁ, J.C.M. & LAL, R. Stratification ratio of soil organic matter pools as an indicator of carbon sequestration in a tillage chronosequence on a Brazilian Oxisol. Soil Tillage Res., 103:46-56, 2009.
SALL, J.; CREIGHTON, L. & LEHMAN, A. JMP start statistics: a guide to statistics and data analysis using JMP and JMP IN software. 3.ed. Cary, Duxbury Press, 2005. 580p. SIX, J.; FELLER, C.; DENEF, K.; OGLE, S.M.; SÁ, J.C.A. &
ALBRECHT, A. Soil organic matter, biota and aggregation in temperate and tropical soils - effects of no-tillage. Agronomie, 22:755-775, 2002.
URQUIAGA, S.; ALVES, B.J.R.; JANTALIA, C.P. & BODDEY, R.M. Variações nos estoques de carbono e emissões de gases de efeito estufa em solos das regiões tropicais e subtropicais do Brasil: uma análise crítica. Inf. Agron., 130:12-21, 2010.
van VEEN, J.A. & PAUL, E.A. Organic carbon dynamics in grassland soil. I. Background information and computer simulation. Can. J. Soil Sci., 61:185-201, 1981.
ZINN, Y.L.; LAL, R. & RESCK, D.V.S. Changes in soil organic carbon stocks under agriculture in Brazil. Soil Tillage Res., 84:28-40, 2005.