FAVRETTO, A. P. O. ; SOUZA, L. C. L. A met a-anal ysis over geomet ric model ing simpl if icat ions in ENVI-met urban cl imat e simul at ion. Ambiente Const ruído, Port o Al egre, v. 19, n. 1, p. 143-160, j an. / mar. 2019.
143
simplifications in ENVI-met urban climate
simulation
Uma met a-anál i se sobr e si mpl i f i cações da model agem
geomét r i ca em si mul ações do cl i ma ur bano com o
sof t war e ENVI-met
Ana Paula Oliveira Favretto
Léa Cristina Lucas Souza
Abstract
nvironmental modelling requires, among other aspects, a description of the built geometry. However, the complexity of the urban tissue draws uncertainties about the building form and locations. Therefore, during the planning process generic simplified geometry models may be more appropriate than the detailed ones. This research shows a meta-analysis performed by comparing the results of detailed and simplified geometric models. The prediction deviations that may arise from using geometric simplifications on ENVI-met modelling were evaluated, considering the output data from different building typologies (one and ten-storey buildings) and urban scenarios (with and without internal squares). Three metrics were analysed: air temperature, wind speed, and sky view factor (SVF). These metrics were normalized between 0 and 1 for comparison and performance assessment. The results indicated that the most adequate simplification models are those that that have kept the building perimeter of the blocks unchanged in relation to the corresponding detailed models.
Keywords: Urban Climate Models, Simplified Geometric Models, ENVI-met.
Resumo
A modelagem do clima urbano requer a descrição da geometria do ambiente construído, entretanto a complexidade do tecido urbano traz incertezas sobre o formato e localização exata das edificações. Portanto, durante o processo de planejamento, modelos de geometria simplificada podem ser mais apropriados que modelos detalhados. Nessa pesquisa foi realizada uma meta-análise, por comparações entre os resultados obtidos através de modelagens geométricas detalhadas e simplificadas. Assim, avaliaram-se os desvios de predição provocados pelo uso de geometrias simplificadas em simulações feitas com o ENVI-met, considerando diferentes tipologias construtivas (edifícios térreos e com dez pavimentos) e cenários urbanos (com e sem quadras internas). Três métricas foram analisadas: temperatura do ar, velocidade do vento e fator de visão do céu. Essas métricas foram normalizadas entre 0 e 1 para efeito de comparação e verificação de desempenhos. Os resultados revelaram que as melhores simplificações correspondem a modelos que mantêm inalterado o perímetro construtivo das quadras em relação aos modelos detalhados.
Palavras-chave: Modelagem do clima urbano. Simplificação geométrica de modelos.
ENVI-met.
E
¹ Ana Paula Oliveira Favret to
¹ Universidade Federal de São Carlos São Carlos - SP - Brasil
² Léa Crist ina Lucas Souza
² Universidade Federal de São Carlos São Carlos - SP - Brasil
Introduction
Nowadays, a scenario of increasing urbanization is posed in which 50% of the world population already lives in urban areas, and this number is predicted to reach 66% in 2050 (UNITED…, 2015). The processes involved in the development of the built environment greatly impact the urban climate conditions, e.g. the parameters of land occupation (DUARTE; SERRA, 2003; SOUZA; SILVA; SILVA, 2016), multiple characteristics of the urban environment (DEBIAZI; SOUZA, 2017), and the urban geometry (NAKATA-OSAKI; SOUZA; RODRIGUES, 2016). Therefore, applying climatology to urban planning has become extremely important to improve citizens´ health and quality of life. Among the climatic phenomena related to urbanization, urban heat islands (UHI) are at the forefront (KALNAY; CAI, 2003). The sky view factor (SVF) (YAMASHITA et al., 1986) and
ventilation (RAJAGOPALAN; LIM; JAMEI, 2014) may be highlighted among the various factors affecting the UHI formation.
Regarding the use of climatological factors in urban planning, computational environmental simulation tools represent a great advance, as they are capable of predicting the urbanization impact of multiple urban design alternatives over the urban climate before its implementation. The ENVI-met V.4.1 software is a holistic three-dimensional non-hydrostatic model that is able to simulate the plant-surface-air interactions. It has been used for several types of urban analysis, among them, the assessment of the urban geometry impact on the thermal comfort and climate conditions by simulating hypothetical (ALI-TOUDERT; MAYER, 2006; KOCH et al., 2018) urban scenarios
or multiple design alternative (GOLDBERG; KURBJUHN; BERNHOFER, 2013; MIDDEL et al.,
2014; SOSA; CORREA; CANTÓN, 2018).
The ENVI-met modelling requires a description of the building geometry and its position in the urban tissue. However this step could be optimized because the exact definition of the building area and location may not be necessary or desirable in some analysis procedures, such as assessing hypothetical or multiple scenarios for future urban propositions or interventions, since the early stages of the urban planning process. Therefore, geometric simplifications may be applied for this kind of simulation, as long as their prediction deviation can be measured and does not interfere on the desired prediction accuracy degree. Geometric simplifications are applied to generalise the representation of 3D buildings (MENG; FORBERG, 2007) and to speed up simulation processes (KADA,
1<ht t p: / / www. envi-met . com/ >.
2005). As highlighted by Li et al. (2013), the
complexity of building models affects the efficiency of the application and still remains a challenge. Thus, to promote a practical use of environmental modelling since the early stages of the urban planning process, this research assesses the prediction deviation of applying simplified geometry models in ENVI-met simulations. For this purpose, the concept of meta-analysis is applied, i.e, an analysis in which scenarios results are cross-examined. According to Wegener (2010), “a meta-analysis is a form of scientific inquiry in which not empirical phenomena but the results of scientific research are the objects of investigation”. In this kind of analysis there is no need for actual data, because the validation is performed by comparing the sets of outputs.
In this paper, the assessment of the building simplifications is conducted by comparing the air temperature, wind speed and sky view factor (SVF) values predicted for hypothetical scenarios that were modelled not only in geometric detailed shapes, but also in simplified ways.
Method
For this meta-analysis study, in order to verify the potential of simplified ENVI-met geometric modelling to accurately represent detailed geometry models when assessing urban hypothetical scenarios, some groups of simulations were performed and their air temperature, wind speed and sky view factor (SVF) results were compared. The simulations were performed using ENVI-met software, V.4.2.0. Summer 17 (free version).
Figure 1 shows an overview of the simulated geometries. Two sets of hypothetical urban scenarios were considered (Figure 1a), namely Simulation Set 01 (with nine 100m x 100m blocks arranged in three lines and three columns) and Simulation Set 02 (with similar configuration but without the central block). For both sets, 10m width streets were arranged as an orthogonal grid. To collect the output data 16 receptors (R) were disposed aligned with the centre of the roads at 1.5m high as illustrated in the figure. Inside of each block there was a disposition of building arrangements that were divided into two groups:
the DMs considered a 5m setback regarding the block boundary; and
(b) simplified models (SM) – illustrated in Figure 1c: To represent the block comprising of the one-storey detached house DM, four geometric SMs were proposed. Moreover, to represent the ten-storey tower DM block, five other geometric SMs were proposed.
A total of 22 ENVI-met simulations were performed and their results were analysed based on the comparison between the predictions obtained from the detailed and simplified modelling. All of the simulated cases considered homogeneous scenarios, on which the building height and distribution pattern was kept constant.
Geometric modelling definitions in
ENVI-met
The model presented 68 units for the ‘x’ and ‘y’ grids, and 25 units for the ‘z’ grids, with a core domain size of 340m x 340m. The size grid cells were 5m for the ‘x’ and ‘y’ axis, and 3m for the ‘z’ axis. Six nesting grids added at each border provided enough space between the buildings and the horizontal model border. Also, sufficient space was provided between the building top and the vertical model border for all the simulated cases. Soil A and B of the nesting grids around the main area and the wall and roof materials assumed the default values, respectively the ‘Default Unseald Soil’, and the ‘Concrete slab (hollow block, default). Two soil types from the ENVI-met library were applied on the main area: Asphalt Roads for the streets and Concrete Pavement Gray for the soil inside the block boundaries. No vegetation elements were considered. These definitions were kept constant for all the simulations in order to avoid their interference on the results. The materials were defined based on hypothetical scenarios and were not meant to represent any specific urban built configuration.
Configuration of the hypothetical urban scenarios and definition of receptor positions
The house and tower DM blocks, and their respective simplified modelling versions, were organized into two sets of homogeneous blocks that comprised hypothetical urban scenarios (Figure 1a). These sets encompass orthogonal 10m width street grids, with nine 100m x 100m blocks, differing from each other due to their central block that may (Simulation Set 01) or not (Simulation Set 02) have contained buildings. Sixteen receptors collected the output data at each 30min. They were disposed aligned with the centre of the roads at 1.5m height, and their positions, kept constant through all scenarios, represented situations of crossroads and street canyons at a mid-position regarded the block perimeter.
Configuration of building geometry inside the block
For the detailed model (DM) geometries (Figure 1b), two building types were considered:
(a) 10m width, 20m depth, and 4m high one-storey detached houses, with a spacing of about 5m between them. Each block encompassed 18 houses, accounting for a building area of 3,600m2; and
(b) 20m width and depth, and 31m high ten-storey tower with a spacing of 15m between them. Each block encompassed 09 building towers, accounting for a building area of 3,600m2;
A hypothetical homogeneous building type scenario comprised the modelled blocks. Each of them contained a group of correspondent simplified models (SM) that were tested in the ENVI-met simulations (Figure 1c).
The four SM related to the one-storey detached house DM are indicated in purple in Figure 1c, and the five SM related to the ten-storey tower DM are indicated in green. The SM 01, 02, 05, 06, and 07 maintained the same building area as their correspondent DM (3,600m2), allocating it in different positions, while its setback regarding the block boundary was modified when compared to the DMs. The SM 03, 04, 08, and 09 kept the same setback of their correspondent DM, while adding a building area of 2,000m2 (SM03 and SM08) and 4,500m2 (SM04 and SM09).
Definition of ENVI-met climatic
input data
The climatic input data were kept constant through all the performed simulations, avoiding their interference on the results. Rather than performing any climatic evaluation regarding a specific city climate, the purpose of this research was to assess the prediction deviation that might arise from using geometric simplifications on ENVI-met modelling. Therefore, the model response to the climatic parameters was disregarded and there was no intention to provide a full realistic climatic input data, to calibrate the simulation outputs with measured data, or to perform any kind of climate characterisation. Also, for this kind of meta-analysis study, the concern indicated by Gusson and Duarte (2016) in relation to the convergence errors that short-wave radiation could cause when the simulation is started at the beginning of the daily heating period is was taken into account, because the interest was focused on the differences of results generated among the scenarios and at the same time of the day.
corresponded to the average data registered at the INMET station (Franca-SP (OMM:83630)) during July, 2016. The wind direction was defined based on the EPW - EnergyPlus Weather file (RORIZ, 2012) that is widely used for building performance simulations. The roughness length corresponded to the value for smooth concrete (FRANCISCO, 2012), which is the material placed right below the receptors. The specific humidity at model top corresponded to the average of the data registered during July, 2016 at the Campo de Marte Airport, which is located in the city of São Paulo and by the time of the research was the closest location with data available at the Wyoming University website2. The data input for the simple forcing module considered the hourly averages of the data registered at the INMET station during July, 2016.
ENVI-met output analysis
In order to assess the potential of the proposed simplified models to represent the detailed ones, concerning the hypothetical blocks and urban scenarios, three different metrics were considered: wind speed (m/s), air temperature (ºC), and sky view factor. These metrics were analysed for each receptor positioned according to Figure 1a. The results showed the deviation of prediction between the detailed and simplified models on the third iteration curve at 9:00pm according to Equation 1.
∆𝑀𝑀𝑀𝑀𝑀𝑀𝑆𝑆𝑆𝑆𝑆𝑆(𝑅𝑅𝑅𝑅) =𝑀𝑀𝑀𝑀𝑀𝑀𝐷𝐷𝑆𝑆𝑆𝑆′(𝑅𝑅𝑅𝑅)− 𝑀𝑀𝑀𝑀𝑀𝑀𝑆𝑆𝑆𝑆𝑆𝑆(𝑅𝑅𝑅𝑅) Eq. 1
Where:
ΔMetSMx(Rn) - is the prediction deviation - the difference between a DM and its correspondent SMx results - for an specific metric (Met) at each
receptor (Rn);
Met - is the analysed metric in their respective
unit: wind speed (m/s); wind direction (degree); air temperature (oC); and sky view factor
(dimensionless);
SMx - is the simplified model considered, that goes
from SM01 to SM09;
Rn - is the receptor positioned according to Figure
1a (from R1 to R16); and
DMx’ - is the detailed model that corresponds to
the SMx considered in the equation. For SM01 to SM04, the set of models considering the one-storey detached house were used, while for SM05 to SM09 the set of models considering the ten-storey tower were used.
A positive value indicated the tendency of the simplified model to underestimate the results,
which was predicted by the detailed model and negative values indicate the opposite.
To rank the performance of the simplified models, we calculated the average of the absolute prediction deviationvalue among all the receptors of each simplified model (SM) for all the considered metrics according to Equation 2
𝑀𝑀𝑀𝑀𝑀𝑀𝑆𝑆𝑆𝑆𝑆𝑆
����������= ∑𝑅𝑅16𝑖𝑖=𝑅𝑅1|(∆𝑆𝑆𝑀𝑀𝑀𝑀𝑆𝑆𝑆𝑆𝑆𝑆)𝑖𝑖|
16 Eq. 2
Where:
𝑀𝑀𝑀𝑀𝑀𝑀𝑆𝑆𝑆𝑆𝑆𝑆
���������� - is the average among the absolute deviation prediction value registered at the 16 receptors of the same SMx;
∑𝑖𝑖=𝑅𝑅1
𝑅𝑅16 |(∆𝑀𝑀𝑀𝑀𝑀𝑀
𝑆𝑆𝑆𝑆𝑆𝑆)𝑖𝑖| - is the sum of the 16 receptors
absolute, or modular, prediction deviation values. To evaluate whether the position of the receptors affected the magnitude of the prediction difference, we calculated (for each receptor) the average of the absolute prediction deviation between all the simplified models related to the one-storey detached house according to Equation 3. Moreover, for the simplified models related to the ten-storey building, the average was calculated according to Equation 4.
𝑀𝑀𝑀𝑀𝑀𝑀𝑅𝑅𝑅𝑅
��������=∑𝑆𝑆𝑆𝑆04𝑖𝑖=𝑆𝑆𝑆𝑆01|(∆𝑆𝑆𝑀𝑀𝑀𝑀𝑅𝑅𝑅𝑅)𝑖𝑖|
4 Eq. 3
𝑀𝑀𝑀𝑀𝑀𝑀𝑅𝑅𝑅𝑅
��������=∑𝑆𝑆𝑆𝑆09𝑖𝑖=𝑆𝑆𝑆𝑆05(∆𝑆𝑆𝑀𝑀𝑀𝑀𝑅𝑅𝑅𝑅)𝑖𝑖
5 Eq. 4
Where:
𝑀𝑀𝑀𝑀𝑀𝑀𝑅𝑅𝑅𝑅
�������� - is the average among the absolute deviation prediction value registered at each receptor for all the SMs regarding the same DM; and
∑𝑆𝑆𝑆𝑆𝑆𝑆𝑖𝑖=𝑆𝑆𝑆𝑆01|(∆𝑀𝑀𝑀𝑀𝑀𝑀𝑅𝑅𝑅𝑅)𝑖𝑖| - is the sum of the absolute
prediction deviation of a specific metric through all the SMs regarding the same DM.
Finally, to assess the one-storey detached house and the ten-storey tower simplified model overall performance, the average of the absolute differences for all the considered metrics and simulation sets were normalized between zero and one.
Results and analysis
The prediction deviations caused by the use of geometric simplifications on ENVI-met modelling were presented below. They were organized in topics according to the considered metrics, building types, and simulation sets. Also, the end of the topic presented an overall performance assessment.
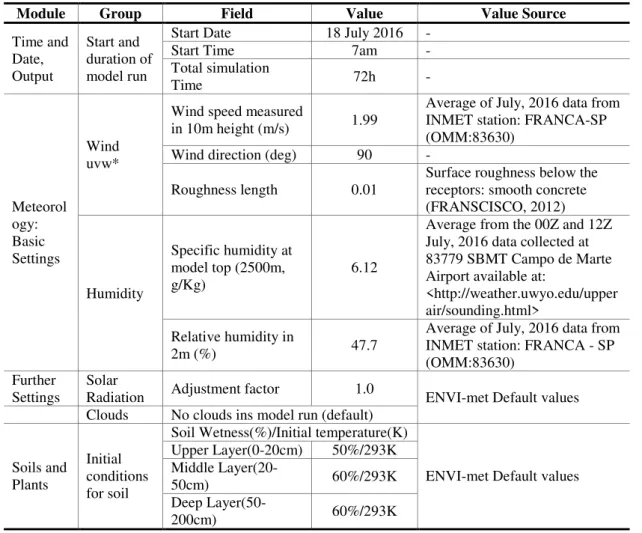
Table 1 - ENVI-met climatic input data
Module Group Field Value Value Source
Time and Date, Output Start and duration of model run
Start Date 18 July 2016 -
Start Time 7am -
Total simulation
Time 72h -
Meteorol ogy: Basic Settings Wind uvw*
Wind speed measured
in 10m height (m/s) 1.99
Average of July, 2016 data from INMET station: FRANCA-SP (OMM:83630)
Wind direction (deg) 90 -
Roughness length 0.01 Surface roughness below the receptors: smooth concrete (FRANSCISCO, 2012)
Humidity
Specific humidity at model top (2500m,
g/Kg) 6.12
Average from the 00Z and 12Z July, 2016 data collected at 83779 SBMT Campo de Marte Airport available at:
<http://weather.uwyo.edu/upper air/sounding.html>
Relative humidity in
2m (%) 47.7
Average of July, 2016 data from INMET station: FRANCA - SP (OMM:83630)
Further
Settings Solar Radiation Adjustment factor 1.0 ENVI-met Default values Clouds No clouds ins model run (default)
Soils and Plants
Initial conditions for soil
Soil Wetness(%)/Initial temperature(K)
ENVI-met Default values Upper Layer(0-20cm) 50%/293K
Middle
Layer(20-50cm) 60%/293K
Deep
Layer(50-200cm) 60%/293K
Note: *by convent ion, in wind vect or st udies, t he coordinat e syst em is cal led ‘ uvw’ where t he ‘ u’ , ‘ v’ , and ‘ w’ ref ers, respect ivel y t o t he ‘ x’ , ‘ y’ , and ‘ z’ axes.
Wind speed results
One-storey detached house
Simulat ion Set 01
Figure 2 shows the wind speed prediction deviation results between the DM and the four SMs proposed to represent the one-storey detached house blocks arranged according to Simulation Set 01.
The maximum positive and negative prediction deviation (Figure 2a) occurred on the receptors “R1”, “R2”, “R8”, “R9”, “R15” and “R16” that are located at the middle point of the blocks´ perimeter on the urban canyons that were perpendicular to the wind direction considered in the simulations. A negative deviation value was found for the SM01 at these receptors revealing the tendency of this simplified model to overestimate the wind speed predicted by the DM. Furthermore, the opposite tendency was found for the remaining SMs at the same receptors.
Regarding the wind speed average of the absolute deviation for each SM (Figure 2b), the SM01 showed the highest deviation level, around 0.2 m/s, while the remaining SMs showed similar behaviour with an average of the absolute deviation of around 0.8 m/s. Among the receptors (Figure 2c), the highest difference levels were found on the same receptors that showed the maximum positive and negative differences (R1, R2, R8, R9, R15, and R16).
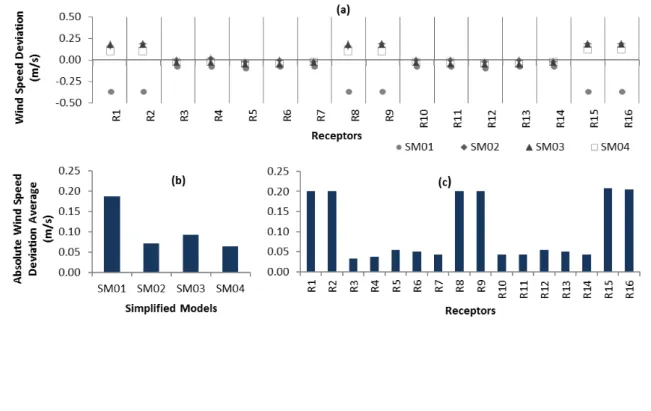
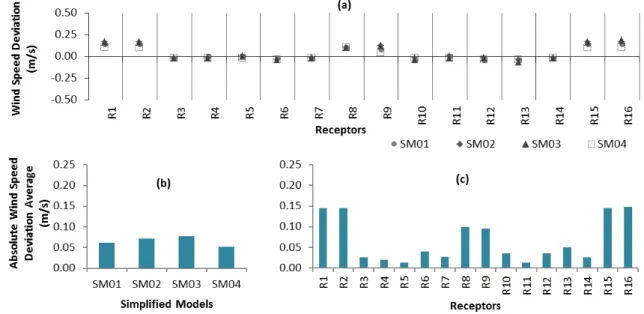
Simulat ion Set 02
difference between the outputs of the DM and the SM02, SM03 and SM04. However, SM01 underwent a major reduction of value. Figure 3c indicated that the receptors “R1”, “R2”, “R8”, “R9”, “R15” and “R16” had the highest average of the absolute deviation. Compared to the results of Simulation Set 01 the highlighted receptors were kept the same. However, for the receptors “R8” and “R9”, which were located at the streets surrounding the plaza, the deviation was mitigated.
Ten-storey tower
Simulat ion Set 01
Figure 4 shows the wind speed prediction deviation results for the ten-storey tower blocks arranged according to Simulation Set 01. Figure 4a indicates the value of -1.14m/s as the maximum deviation, which occurred in the SM01 at receptor R03. The prediction deviation was mostly negative, indicating a tendency of the SM to overestimate the wind speed prediction value obtained from the corresponding DM. Figure 4b shows that SM07 had the greater wind speed average of the absolute prediction deviation among all the receptors (0.77m/s), and SM06 had the minor (0.24m/s). Figure 4c shows that the receptors “R1”, “R2”, “R8”, “R9”, “R15” and “R16” stood out from the others as they show the minor differences. These receptors were located near to the middle point of the block boundaries at the urban canyons, which
were perpendicular to the wind direction input in the simulation setup. The prediction deviation observed between the receptors positioned near the opposite faces of the block in the urban canyons that were parallel to the wind direction showed similar values, e.g. “R3” and “R10”, “R4” and “R11”, etc.
Simulat ion Set 02
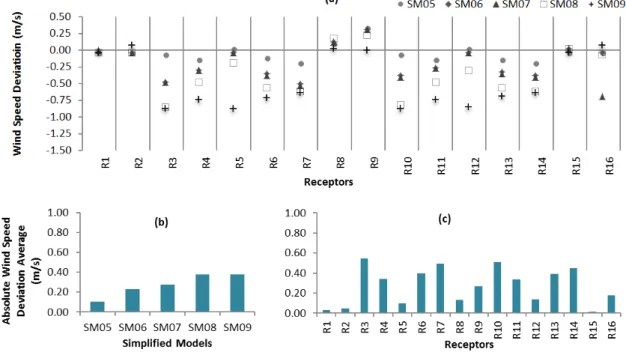
Figure 5 shows the results concerning the 10-storey tower blocks arranged according to Set 02. Figure 5a indicates that the maximum wind speed prediction deviation value was around -0.85m/s, which occurred in SM08 at receptor “R3”, and in SM09 at R10. The prediction deviation assumed mostly negative values, indicating the SM tendency to overestimate the DM values. Figure 5b shows that the simplification SM08 and SM09 has the major absolute wind speed deviation average value (0.38m/s), while SM05 had the minor (0.11m/s). Figure 5c shows that the receptor with the greater average of the absolute prediction deviation is “R3” (0.55m/s), while “R15” has the smallest average of the absolute deviation (0.01m/s).
Compared to the results of Set 01 (Figure 4), the replacement of the central block of Set 01 by a square in simulation set 02 resulted in a considerable reduction in the deviation value, mainly when it comes to the average of the absolute deviation among all the receptors of each SM (Figure 5b).
Figure 3 - (a) Wind speed prediction deviation, and Wind speed average of the absolute prediction deviation (b) for each SM and (c) for each receptor, according to Simulation Set 02 for the one-storey detached houses
Figure 5 – Wind speed prediction deviation between the DM and four SMs, according to Simulation Set 02 for the ten-storey building
Air temperature results
One-storey detached house
Simulat ion Set 01
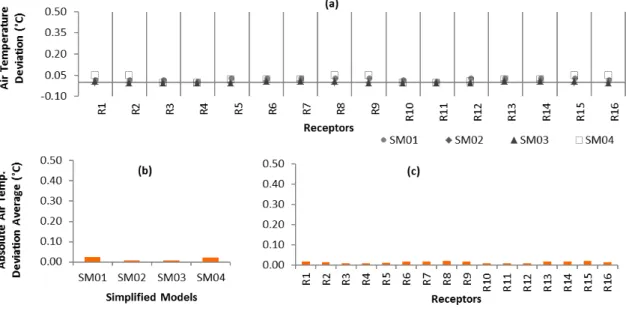
Figure 6 shows the results of air temperature deviations between the DM and the SM predictions for Simulation Set 01. Very small values were found with the maximum value of 0.04oC (a). The average air temperature deviation shows very similar values for all the SMs (b) and receptors (c).
Simulat ion Set 02
Figure 7 shows the prediction deviation results for the one-storey detached house blocks arranged according to Simulation Set 02. The maximum value occurred for the SM0l, followed by SM02 and the SMs 03 and 04 presented similar behaviours, with small deviation values (Figure 7a). Concerning the average of the absolute temperature deviation calculated among all the receptors for each SM (Figure 7b), the SM01 shows the major value, around 0.4 °C followed by SM02, around 0.2 °C. The deviation level of SM01 and SM02 was considerable increased while comparing the Simulation Sets 01 (Figure 6b), and 02 (Figure 7b). Moreover, comparing the data from Figures 6c and 7c an increase in the average of the absolute temperature deviation could be noticed for all the receptors. Despite showing an increased deviation when compared with Simulation Set 01, the results
from Simulation Set 02 still shows small averages of the absolute temperature difference.
Ten-storey tower
Simulat ion Set 01
Figure 8 shows the results of the air temperature prediction deviations for the 10-storey tower blocks arranged according to Set 01. According to the Figure 8a, except for SM06, all the SMs show very similar results around 0.00 and 0.01 oC of temperature prediction deviation between the SMs and the DM. The maximum prediction deviations (around 0.6 oC) occurred at the receptor “R8 and R9” for the SM06. Figure 8b shows the average of the absolute air temperature deviation calculated among all the receptors for each SM, and Figure 8c shows the average among all the SM for each receptor. Small prediction deviations were found for all the receptors and also for all the SMs with a maximum of 0.4 °C for SM06.
Simulat ion Set 02
The maximum deviations occurred at receptors “R1”, “R2”, and R15 for the SM07.
Figure 9b shows that the SM05, SM06, and SM07 had high levels of the average of the absolute temperature deviation, respectively 1.3 °C, 1.6 °C
and 1.7 °C. While the SM08 and SM09 maintain low levels, which are below 0.1 °C. Figure 9c shows that the major average values of the absolute prediction deviation occurred for receptors “R1”, “R2”, and “R15”.
Figure 6 – (a) Air temperature prediction deviation, and Air temperatue average of the absolute prediction deviation (b) for each SM and (c) for each receptor, according to Simulation Set 01 for the one-storey detached houses
Figure 8 – (a) Air temperature prediction deviation, and Air temperatue average of the absolute prediction deviation (b) for each SM and (c) for each receptor, according to Simulation Set 01 for the ten-storey towers
Figure 9 – (a) Air temperature prediction deviation, and Air temperatue average of the absolute prediction deviation (b) for each SM and (c) for each receptor, according to Simulation Set 01 for the ten-storey towers
Sky view factor result
One-storey detached house
Simulat ion Set 01
Regard the prediction deviation of the Sky View Factor (SVF) calculated by the DM and the SMs for
(“R4”, “R6”, “R11” and “R13”) reached a better performance than the others as they showed the smallest average of the absolute prediction deviation values (Figure 10a).
Simulat ion Set 02
In general, positive small deviations were found between the SVF calculated by the DM and the SMs for Simulation Set 02 of the one-storey detached house blocks (Figure 11a). It indicates a tendency of the SMs to underestimate the values that would be calculated by the DM. The SVF absolute deviation averages among the receptors of each SM, were very similar and always below 0.02 (Figure 11b). The receptors located at the crossroads (“R4”, “R6”, “R11”, and “R13”) showed the minimum values (close to zero), while receptors “R1”, “R2”, “R3”, “R15” and “R16” presented the highest SVF absolute deviation average (Figure 11c).
Ten-storey tower
Simulat ion Set 01
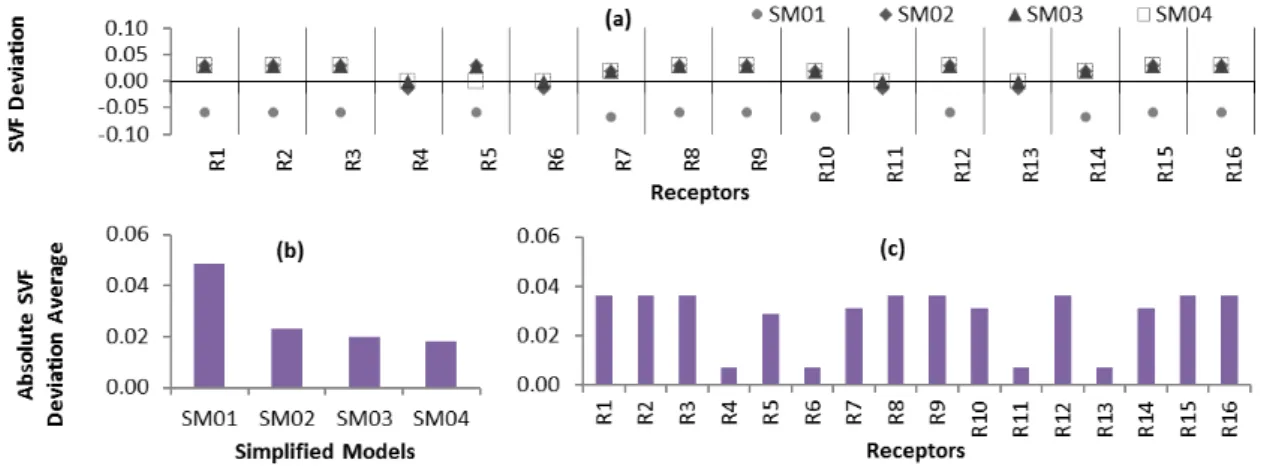
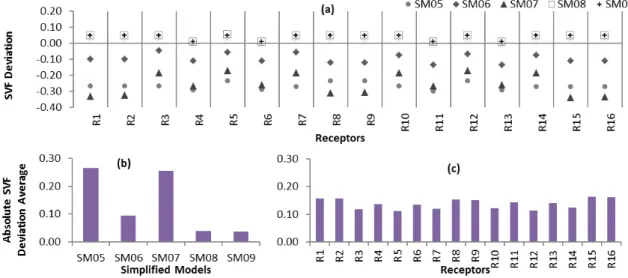
The deviation between the SVF calculated by the detailed and simplified models for Simulation Set 01 of the ten-storey tower blocks was negative for SM05 to SM07, and positive for SM08 and SM09 (Figure 12a). It indicates that the first SMs mentioned had the tendency to overestimate the SVF calculated by the DM, while the other SMs had the opposite tendency. The SFV absolute deviation average among all the receptors for each SM (Figure 12b) showed its highest values for SM05 and SM07. The absolute average SFV deviation among all the SMs for each receptor (Figure 12c), ranged around 0.1-0.15 and did not present a clear distribution trend.
Figure 10 – (a) Sky View Factor prediction deviation, and Sky View Factor average of the absolute prediction deviation (b) for each SM and (c) for each receptor, according to Simulation Set 01 for the one-storey detached houses
Figure 12 – (a) Sky View Factor prediction deviation, and Sky View Factor average of the absolute prediction deviation (b) for each SM and (c) for each receptor, according to Simulation Set 01 for the ten-storey towers
Simulat ion Set 02
Figure 13 shows the results of the SVF difference calculated by the detailed and simplified models for Simulation Set 02 of the ten-storey tower blocks. The deviation between the SVF calculated by the DM and the SMs was mostly positive for all the SMs (Figure 13a), indicating their tendency to underestimate the SFV calculated by the DM. All the SMs presented small SFV average of the absolute prediction deviation (Figure 13b). If compared to the results of Simulation Set 01 (Figure 12), a large decrease in the average of the absolute prediction deviation can be observed for SM05 to SM07, while SM08 and SM09 maintain similar values. The SFV absolute deviation averages among all the simplifications for each receptor (Figure 13c) assumed small values, especially for the receptors located at the crossroads (“R4”, “R6”, “R11” and “R13”).
Overall performance
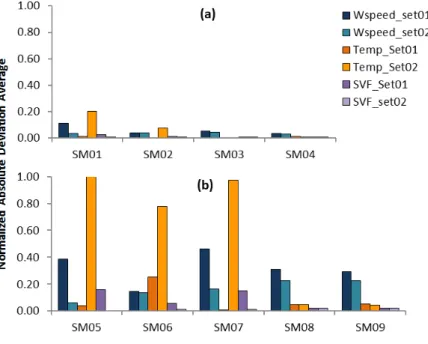
Figure 14 shows the absolute deviation average normalized between 0 and 1 to allow the assessment of the overall performance of each SM that corresponds to (a) the one-storey detached house and (b) 10-storey tower DMs. The lack of buildings in the central block had a major impact on SM01, SM05, and SM07 for all the metrics, and on SM02 and SM06 comprising only the air temperature.
Considering the two simulation sets for the one-storey detached house models, the best performance is ranked above:
(a) wind speed: SM04-Sets;
(b) air temperature: SM02-Set01, | SM3-both Sets; and
(c) SVF: SM02, SM03, and SM04-both sets. Considering the two simulation sets for the ten-storey towers models, the best performance is ranked above:
(a) wind speed: SM06-Set01, | SM05-Set02; (b) air temperature: SM07-Set 01 | SM08; SM09 - Set2; and
(c) SVF: SM08; SM09 - Set 01 | Set02: all simplified models show small values.
Figure 13 – (a) Sky View Factor prediction deviations, and Sky View Factor average of the absolute prediction deviation (b) for each SM and (c) for each receptor, according to Simulation Set 01 for the ten-storey towers
Figure 14 – Average of the absolute prediction difference for all SMs and simulation set s normalized between 0 and 1
Discussion
Table 2 summarises the results obtained in this research. It suggest, for most of the analysed cases, that using simplified geometric modelling in ENVI-met, while assessing hypothetical urban scenarios, brought low prediction deviation levels for all the considered metrics. The maximum wind speed prediction deviation and average of the absolute prediction deviation values were always below 1.2m/s, which is the minimum interval used to classify the wind intensity in the Beaufort scale. The
prediction deviations assumed the magnitude of the second decimal place for all the simulated cases except for SM05, and SM07 in Simulation Set01. This order of precision was, for instance, disregarded in the tables proposed by Stewart and Oke (2012) for the Local Climate Zone (LCZ) classification, which considered 0.2 as the minimum SVF interval.
Considering the SMs overall performance, the SM03, SM04, SM08, and SM09 are the most recommended because of their consistence in the results for all the metrics. These models have in common the fact of maintaining the building alignment along the whole perimeter of the blocks. It is possibly related to a reduction of the discrepancies between the DM and SMs geometry aspect ratio, or H/W (Height/Width) factor, since a body of research establishes a close connection between this factor and climatic phenomena such as heat islands (OKE, 1981; NAKATA-OSAKI; SOUZA; RODRIGUES, 2018).
The presented study contributes to the urban climate modelling, as it measured the deviation predictions that arose from geometric simplifications on hypothetical scenarios as, for example, disregarding the setback between buildings. This modelling simplification has already been practiced in ENVI-met models that simulate hypothetical scenarios (ALI-TOUDERT; MAYER, 2006; FAHMY; SHARPLES, 2009) but without considering its impact on the results. Also, the findings of this research point to the possibility of performing, at places where building setbacks are mandatory, assessments similar to the ones conducted where the modelling of continues building blocks are representative of the local conditions (GOLDBERG; KURBJUHN; BERNHOFER, 2013; KOCH et al., 2018; SOSA; CORREA;
CANTÓN, 2018).
Conclusion
The aim of this study was to assess the prediction deviation that may arise from using geometric simplifications on ENVI-met modelling, and verify if they could properly replace the detailed geometric models in ENVI-met simulation without significantly affecting its results. Three metrics, which are related to the occurrence of UHI, were considered: air temperature, wind speed and the sky
view factor. Comparative analyses between the simplified and detailed simulations demonstrate that small prediction deviations were found at: (a) 61% of the tested SM, considering all tested cases for the three metrics jointly;
(b) all the one-storey detached house SM; (c) all ten-storey tower SM considering the wind speed;
(d) 80% of the ten-storey tower SM considering the air temperature; and
Table 2 – Summary of the test results for all simplified models and metrics considered
Detailed Model
Simplified
Model Deviation
Set 01 Set 02
Wind Speed [m/s], [ ]
Air Temp. [°C], [ ]
SVF [ ]
Wind Speed [m/s], [ ]
Air Temp. [°C], [ ]
SVF [ ]
One-Storey Detached
House
SM01
Max. Deviation -0.37 0.03 -0.07 0.14 0.46 0.03 Abs. Deviation
Average 0.19 0.02 0.05 0.06 0.34 0.02
Normalized Abs. Deviation Average
0.11 0.01 0.03 0.04 0.20 0.01
SM02
Max Deviation 0.17 0.01 0.03 0.17 0.18 0.03
Abs. Deviation
Average 0.07 0.00 0.02 0.07 0.13 0.02
Normalized Abs. Deviation Average
0.04 0.00 0.01 0.04 0.08 0.01
SM03
Max Deviation 0.18 0.01 0.03 0.18 0.01 0.03
Abs. Deviation
Average 0.09 0.00 0.02 0.08 0.00 0.02
Normalized Abs. Deviation
Average 0.05 0.00 0.01 0.04 0.00 0.01
SM04
Max Deviation 0.11 0.04 0.03 0.10 0.04 0.03
Abs. Deviation
Average 0.07 0.02 0.02 0.05 0.02 0.02
Normalized Abs. Deviation Average
0.04 0.01 0.01 0.03 0.01 0.01
Ten-Storey
Tower SM05
Max Deviation -1.14 -0.18 -0.30 0.32 2.35 0.02 Abs. Deviation
Average 0.65 0.07 0.27 0.11 1.68 0.00
Normalized Abs. Deviation Average
0.39 0.04 0.16 0.06 1.00 0.00
SM06
Max Deviation -0.39 0.61 -0.13 -0.52 1.98 0.04 Abs. Deviation
Average 0.24 0.42 0.09 0.23 1.31 0.02
Normalized Abs. Deviation
Average 0.14 0.25 0.05 0.13 0.78 0.01
SM07
Max Deviation 0.97 +/- 0.03 -0.34 -0.69 2.73 0.04 Abs. Deviation
Average 0.77 0.01 0.25 0.28 1.64 0.02
Normalized Abs. Deviation
Average 0.46 0.01 0.15 0.16 0.98 0.01
SM 08
Max Deviation -0.97 -0.13 0.06 -0.85 0.15 0.05 Abs. Deviation
Average 0.52 0.08 0.04 0.38 0.08 0.04
Normalized Abs. Deviation Average
0.31 0.05 0.02 0.23 0.05 0.02
SM09
Max Deviation -0.88 -0.14 0.05 -0.84 -0.17 0.05 Abs. Deviation
Average 0.49 0.09 0.04 0.38 0.07 0.04
Normalized Abs. Deviation Average
References
ALI-TOUDERT, F.; MAYER, H. Numerical Study on the Effects of Aspect Ratio and
Orientation of an Urban Street Canyon on Outdoor Thermal Comfort in Hot and Dry Climate.
Building and Environment, v. 41, n. 2, p. 94– 108, 1 fev. 2006.
DEBIAZI, P. R.; SOUZA, L. C. L. de.
Contribuição de Parâmetros do Entorno Urbano Sobre o Ambiente Térmico de Um Campus Universitário. Ambiente Construído, Porto Alegre, v. 17, n. 4, p. 215–232, out./dez. 2017. DUARTE, D. H. S.; SERRA, G. G. Padrões de Ocupação do Solo e Microclimas Urbanos na Região de Clima Tropical Continental Brasileira: correlações e proposta de um indicador. Ambiente Construído, Porto Alegre, v. 3, n. 2, p. 7–20, abr./jun. 2003.
FAHMY, M.; SHARPLES, S. On the Development of an Urban Passive Thermal Comfort System in Cairo, Egypt. Building and Environment, v. 44, n. 9, p. 1907–1916, set. 2009. FRANCISCO, R. C. A. Clima Urbano: um estudo aplicado a Belo Horizonte, MG. Belo Horizonte, 2012. 122 f. Dissertação (Mestrado em ) – Escola de Arquitetura, Universidade Federal de Minas Gerais, Belo Horizonte, 2012.
GOLDBERG, V.; KURBJUHN, C.; BERNHOFER, C. How Relevant is Urban Planning For the Thermal Comfort of Pedestrians? Numerical case studies in two districts of the City of Dresden (Saxony/Germany). Meteorologische Zeitschrift, v. 22, n. 6, p. 739–751, dez. 2013. GUSSON, C. S.; DUARTE, D. H. S. Effects of Built Density and Urban Morphology on Urban Microclimate - Calibration of the Model ENVI-met V4 for the Subtropical Sao Paulo, Brazil. Procedia Engineering, v. 169, p. 2–10, jan. 2016. KADA, M. 3D Building Generalization. In: ITERNATIONAL CARTOGRAGPHIC CONFERENCE, Coruña, 2005. Proceedings... Coruña: International Cartographic Association, 2005.
KALNAY, E.; CAI, M. Impact of Urbanization and Land-Use Change on Climate. Nature, v. 423, p. 528-531, 2003.
KOCH, F. et al. Compact or Cool? The impact of
brownfield redevelopment on inner-city micro climate. Sustainable Cities and Society, v. 38, p. 31–41, abr. 2018.
LI, Q. et al. Geometric Structure Simplification of
3D Building Models. ISPRS Journal of
Photogrammetry and Remote Sensing, v. 84, p. 100–113, out. 2013.
MENG, L.; FORBERG, A. 3D Building Generalisation. In: GENERALISATION of Geographic Information. New York: Elsevier, 2007.
MIDDEL, A. et al. Impact of Urban Form and
Design on mid-Afternoon Microclimate in Phoenix Local Climate Zones. Landscape and Urban Planning, v. 122, p. 16–28, fev. 2014. NAKATA-OSAKI, C. M.; SOUZA, L. C.; RODRIGUES, D. S. Impacto da Geometria do Cânion Urbano na Intensidade de Ilha de Calor Noturna: análise através de um modelo simplificado adaptado a um SIG. Ambiente Construído, Porto Alegre, v. 16, n. 3, p. 73–87, jul./set. 2016.
NAKATA-OSAKI, C.; SOUZA, L. C. L.; RODRIGUES, D. S. THIS – Toof for Heat Island Simulation: a GIS extension model to calculate urban heat island intensity based on urban geometry. Computers, Environment and Urban Systems, v. 67, p. 157-168, 2018.
OKE, T. R. Canyon Geometry and the Nocturnal Urban Heat Island: comparison of scale model and field observations. Journal of Climatology, v. 1, p. 237-254, 1981.
RAJAGOPALAN, P.; LIM, K. C.; JAMEI, E. Urban Heat Island and Wind Flow Characteristics of a Tropical City. Solar Energy, v. 104, p. 159-170, 2014.
RORIZ, M. Arquivos Climáticos de Municípios Brasileiros. Associação Nacional de Tecnologia do Ambiente Construído. Grupo de Trabalho sobre Conforto e Eficiência Energética de Edificações. Relatório Interno, 2012. Disponível em:
<www.labeee.ufsc.br/downloads/arquivos-climaticos>. Acesso em: 26 abr. 2016.
SOSA, M. B.; CORREA, E. N.; CANTÓN, M. A. Neighborhood Designs For Low-Density Social Housing Energy Efficiency: case study of an arid city in Argentina. Energy and Buildings, v. 168, p. 137–146, jun. 2018.
UNITED NATIONS. World Urbanization Prospect: the 2014 revision final report. 2015. Disponível em:
<https://esa.un.org/unpd/wup/Publications/Files/W UP2014-Report.pdf>. Acesso em: 30 jan. 2018. WEGENER, M. Meta Analysis of Scenario Results. Technical Note S&W STEPs 03. Dortmund: Spiekermann & Wegener Urban and Regional Research, 2010. Available at:
<http://www.spikermann-wegener.de/pro/pdf/SuW_STEPs_03.pdf>. Acesso em: mai. 2018.
YAMASHITA, S. et al. On Relationships Between
Heat Island and Sky View Factor in the Cities of Tama River Basin, Japan. Atmospheric
Environment, v. 20, n. 4 p. 681-686, 1986.
Acknowledgements
The authors would like to express their gratitude to CAPES and CNPq, for their financial support in many parts of this research.
This study was financed in part by the Coordenação de Aperfeiçoamento de Pessoal de Nível Superior - Brasil (CAPES) - Finance Code 001.
Ana Paula Oliveira Favret to
Laborat ório de Conf ort o e Ef iciência Energét ica no Ambient e const ruído, Depart ament o de Engenharia Civil | Universidade Federal de São Carlos | Rodovia Washingt on Luís, SP-310, Km 235 | São Carl os - SP – Brasil | CEP 13566-590 | Tel. : (16) 3351-8111 Ramal 6586 | E-mail : ana. f avret t o@gmail. com
Léa Crist ina Lucas Souza
Cent ro de Ciências Exat as e de Tecnol ogia | Universidade Federal de São Car los | Rodovia Washingt on Lui s, km 235, Monj olinho | São Carlos - SP – Brasil | Caixa Post al 676 | CEP 13565-905 | Tel. : (16) 3351-9692 | E-mail: leacrist . uf scar@gmail . com
Revist a Ambient e Const r uído
Associação Nacional de Tecnol ogia do Ambient e Const ruído Av. Osval do Aranha, 99 - 3º andar, Cent ro
Port o Al egre – RS - Brasil CEP 90035-190 Telef one: +55 (51) 3308-4084
Fax: +55 (51) 3308-4054 www. seer. uf rgs. br/ ambient econst ruido
E-mail : ambient econst ruido@uf rgs. br