doi: 10.1590/0101-7438.2016.036.02.0355
INFERENCE OF THE MARKET VALUE OF URBAN LOTS FROM THE PERSPECTIVE OF SURVIVAL ANALYSIS. CASE STUDY: CITY OF S ˜AO CARLOS, S ˜AO PAULO, BRAZIL
Guilherme Moraes Ferraudo
1*, Francisco Louzada
2and Jos´e Fabr´ıcio Ferreira
3Received December 4, 2015 / Accepted July 13, 2016
ABSTRACT.The survival analysis was originally proposed for data analysis related to time before the occurrence of a specific event of interest and has been widely used in studies of biomedical data (survival analysis), industrial research (reliability analysis) and financial data (credit scoring). In this study, we pre-sented a new approach to modeling the market value of urban lots based on survival analysis considering the left censoring mechanism, which allows estimating the probability for sale and the hazard associated with sales at the lot market value. The modeling is made from the survival analysis that introduces greater flexibility when compared to the usual linear models as it allows including the effectively traded lots (not censored) and lots in negotiation (censored) into the process, however, it is not enough to affirm the effective improvement of models based on the survival analysis.
Keywords: urban lots, survival analysis, left censoring.
1 INTRODUCTION
Location is one of the main components in the formation of use-values and market value of a property. Land Value Maps (LVM), one of the most important elements to determine values for taxation, consists of generalizations inferred from individual sampling of observable events in local real estate markets.
In drafting LVM based on a scientific methodology, in this case, the statistical methodology, the manager (assessor) should comply with the principle of impartiality, which should guide any
*Corresponding author.
1Departamento de Estat´ıstica, Universidade Federal de S˜ao Carlos – UFSCar, 13565-905 S˜ao Carlos, SP, Brasil. E-mail: [email protected]
2Departamento de Matem´atica Aplicada e Estat´ıstica – ICMC, Universidade de S˜ao Paulo – USP, 13566-590 S˜ao Carlos, SP, Brasil. E-mail: [email protected]
decision involving the interests of citizens. Impartiality is directly associated to fundaments for the statistical methodology, that is, in the end, by questioning LVM, we indirectly question the rationale of the statistical methodology used, ranging from the sampling plan to the inference of values.
In Brazil, real state mass evaluation is of great importance to municipal governments. In addi-tion to taxaaddi-tion issues, especially LVM, its applicability widens with the advent of the “Statute of Cities”, a federal law that also rules the adoption of tax instruments by municipal urban policies. Therefore, LVM enhance efficiency of instruments for urban policy induction, such as progres-sive real estate taxes, as well as grants of land use and occupation and acquisition of land by municipalities.
Location is the main explanatory variable of market value of urban lots, however, its modeling for mass evaluation in routine of cities is rather divergent, according to a note published by the Brazilian Ministry of Cities (2005). As part of Assessments Engineering, some studies, such as Dantas (1998), location is treated as a variable of the qualitative type of various stages. In Her-mann & Haddad (2005), location is a quantitative variable, representing the distance to certain centers of influence in the city. In Zancan (1996), for example, location is treated as a series of dichotomous variables. These are examples of different encodings of distinct variables aiming to represent the same feature.
Despite the different ways in treating location, a statistical model can introduce increasing levels of complexity given by the type and number of variables involved. To estimate the market value of a vacant lot, for example, it is possible to compile a list of dozens of explanatory variables from bibliography. This creates numerous possibilities of representation, posing a problem for the researcher about which model to specify. There is a considerable amount of mathematical, statistical and computational approaches in parallel to the issue of relative partial approaches concerning urban location, analyzing this issue by critics of urban theories. In general, it is evident in LVM preparation certain remnants of the actual economicism in the speeches, the
reductively economic vision of world(Souza, 2009), promoted largely by the quantitative lines of sociology and geography, characterized by the sophistication of the instruments, but with very low ability to elucidate the reality comprehensively (Abreu, 1994).
The sampling also becomes relevant. The process of mass evaluation of real estate and LVM creation requires a duration in which it is not always possible to obtain a satisfactory amount and spatial balance in sample collections. When this occurs, the assessor is faced with the problem to infer land values in sites where it is difficult to obtain samples, based on comparison with similar sites. The question is: what are the comparison parameters among two different locations?
There is need to build boundary conditions to apply indicator variables from the location to inferential models for real estate assessment. These boundary conditions may be applicable to the universe of Brazilian urban contexts, especially non-metropolitan sites.
inhabi-tants, a population growth higher than the average in the state and the country. S˜ao Carlos is a medium-sized city whose spatial patterns of real estate valuation are not so simple, as in small municipalities, but they outline factors whose effects have maximum expression in the metropoli-tan environment. One of the most powerful processes in urban structure is segregation. It is no longer possible to explain the urban patterns of residential segregation by the model center versus periphery, as it was the situation until the mid of decade of 1980 in Brazilian cities.
This article is part of some innovative studies linking two apparently distinct knowledge fields – inferential methodologies of mass evaluation and intra-urban location studies of sociological, geographical and historical nature. The potentially common theme is the prospect of application in urban and taxation planning, which means for the municipal government the use of scientific methods to consider the city as it is, ensuring not only success in assessment formulations, but also respecting to impartiality principles that should characterize its policies.
Urban agglomerations are systems composed of several locations that have accessibility as one of their major attributes with great influence on land valuation. Intra-urban locations with feature to minimize the time required for people’s daily locomotion, such as home-to-work trips, leisure, home-to-school, home-to-commerce trips, among others, are more valued. Use-values and prices are closely related categories. According to Santos (2003), and Santos (2005), the urban econ-omy can be split into the poor and the rich, which constitute separate circuits. Thus, the most valued sites are those located near commerce centers and work places of the social strata in its various socioeconomic conditions. In this context, barriers are relevant as they devalue certain locations compared to others. These barriers are of natural order, such as conformation of re-lief and hydrography, and often, railroads, roads, highways and bridges are designed under the influence of these factors.
Focusing our attention on the vacant lot as an object of study in this article, it is worth to mention the subset of not urbanized inner lands, for instance. In the proposed model whose modeling is characterized by homogeneous regions in terms of location, the assessment of this subset can achieve contextualized dimensions in which common variables used for urbanized lots are con-sidered. It will therefore be possible to quantifying the location value implicit in these areas more clearly and evaluating more comprehensively aspects of land under-use, property speculation in connection with its social function, because these areas usually form urban voids.
model to predict the market value of lots, as the usual linear regression model does, it allows estimating the likelihood and hazard associated with the sales price of a particular lot.
The paper is organized as follows. Section 2 refers to the description of materials and meth-ods, such as data collection, covariates, survival analysis considering left censoring divided into two sub-sections, a sub-section for the non-parametric estimator of Kaplan-Meier and another sub-section for the Weibull linear model. Section 3 refers to the discussion of the results and is subdivided into three sub-sections (descriptive and exploratory analysis and Weibull linear model). Some final comments and conclusion are presented in Section 4.
2 MATERIALS AND METHODS
2.1 Data collection
In the context of this study, the term “lot” means a real estate property consisting of a land parcel, resulting from an urban developing program, parcelment or condominium fractionation. Strictly speaking, this concept is not restricted to a legal definition, but purely to the morphological aspect of the vacant lot. The universe (population in a statistical standpoint) comprised 24,975 vacant lots, almost a quarter of all real estate properties in the municipality of S˜ao Carlos (S˜ao Carlos, 2006), S˜ao Paulo State, Brazil. In this property type, the value of the location is explicit, whereas in built-up lots, the land value is implicit, due to the construction characteristics and its conservation. Although there are many interference on values of vacant lots, there are not as many as those for built-up lots.
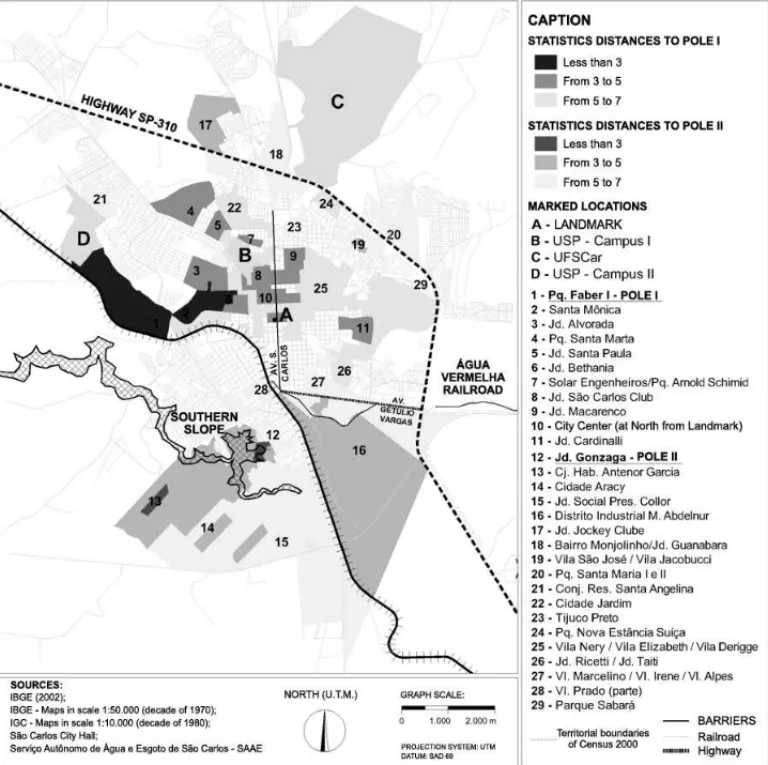
Ferreira (2007) characterized the spatial distribution of the different households of S˜ao Carlos City based on education and income data in the 2000 census (IBGE, 2002). The method used in this analysis consists in determining a statistical distance between the 241 census sectors based on the method of the multivariate analysis described in Johnson & Wichern (1998). Figure 1 shows a comprehensive configuration of the spatial distribution patterns of the residential neighborhoods of social strata with higher and lower purchasing power. Each one composes a pole.
price are the advantages offered by acquiring the property: neighborhood, accessibility, natural attractions, infrastructures accumulation, among others.
In the higher income strata, in terms of valuation, there is a strong dependence on the land value with the blue areas in Figure 1. The most valued areas, according to the samples collected coincide with the blue areas with the exception of parcels that were created after the 2000 census (Parque Faber II, Residential Condominiums Dahma and Montreal, for example).
Figure 1– Classification map of census sectors according to the value of the statistic distance to one of the social strata poles. Indication of the largest intra-urban barriers. Source: Ferreira (2007).
predomi-nance of “subnormal” standard housings. Exclusion levels are evident to justify the deployment of Programa Habitar Brasil/BID, a project funded by the Brazilian Federal Government around the year 2001.
2.2 Covariates
To treat the location concept of urban lots, the urban space was subdivided according to the criteria described above. Each hypothesis is an explanatory variable to be included in this model, in other words, in the language of regression models, each hypothesis corresponds to a covariate. The concept and the label (between parenthesis) used throughout the modeling process of each covariate are described below:
• Central Hill (PLN CENTRAL)– the relevance to these areas is a valuation factor.
• Railway (FERROVIA)– the dichotomy of this variable is useful to estimate depreciation averages resulting from the influence of the railway.
• Highway (RODOVIA)– areas with accessibility unaffected by Highway SP-310 are most valued.
• Southern Slope (ENCOSTA)– areas situated before the barrier of southern slopes are most valued.
• Closed (FECHADO)– the closing of these installments is a valuation factor.
• Condominium (CONDO)– the institution is a condominium is a valuation factor.
• Residential Use (ESTRIT RESID)– the characteristic of the allotment for strictly residen-tial use or any restrictions in this regard contribute to valuation of lots.
• City Center (NUC PRINC)– the relatively remote locations with respect to the city center separated by several watersheds are more devalued.
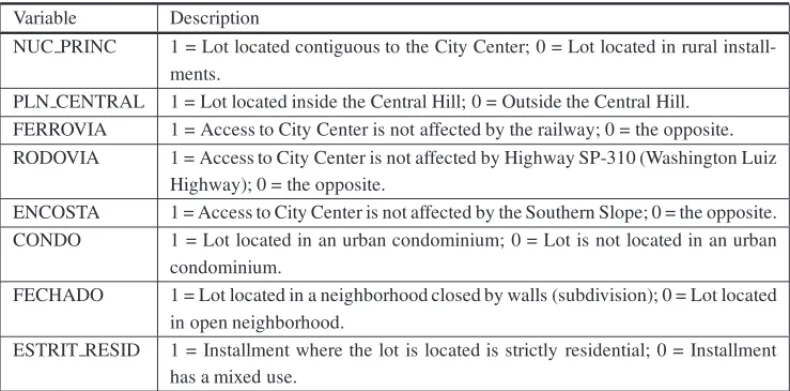
In the model proposed, the subdivision of urban lot location is expressed by eight dichotomous variables as shown below in Table 1. The unity of the response variable, Total Value of the Property(Vi), is in Real per square meter (R$/m2).
2.3 Analysis of survival considering the left censoring mechanism
Table 1– Description of dichotomous variables indicating location. Variable Description
NUC PRINC 1 = Lot located contiguous to the City Center; 0 = Lot located in rural install-ments.
PLN CENTRAL 1 = Lot located inside the Central Hill; 0 = Outside the Central Hill. FERROVIA 1 = Access to City Center is not affected by the railway; 0 = the opposite. RODOVIA 1 = Access to City Center is not affected by Highway SP-310 (Washington Luiz
Highway); 0 = the opposite.
ENCOSTA 1 = Access to City Center is not affected by the Southern Slope; 0 = the opposite. CONDO 1 = Lot located in an urban condominium; 0 = Lot is not located in an urban
condominium.
FECHADO 1 = Lot located in a neighborhood closed by walls (subdivision); 0 = Lot located in open neighborhood.
ESTRIT RESID 1 = Installment where the lot is located is strictly residential; 0 = Installment has a mixed use.
example, we may be interested in knowing the probable sale price(V), but it was offered by a price(Z), being thatV ≤ Z (a condition imposed by the left censoring mechanism). Note that the sale price(V)is non-observable (latent), requiring the use of the survival analysis to describe and interpret it.
The survival and reliability analysis becomes peculiar due to the special features inherent to data types that are typically available for the analysis. Here, we discuss only two main characteristics of the survival and reliability data: presence of censoring and presence of covariates (similar to the usual linear model).
In the databases for the survival analysis, the main feature is the presence of censoring, which is the partial observation of the response. This refers to situations where, for some reason, the unit monitoring (urban lot) was interrupted. Without censoring, the classical statistical techniques such as the regression analysis and experiment designs could be used in the analysis of this data type, probably using a transformation for the answer. Therefore, the use of survival analysis methods allows incorporating in the statistical analysis the information contained in the censored data (Colosimo & Giolo, 2006). This means that there is need to introduce an extra variable to the survival analysis, indicating whether the response of interest was observed. In this study, whether the sale of a given lot was carried out. This variable is known in the literature for the survival and reliability analysis as the indicator variable of censoring, or simply censoring.
Louzada-Neto et al. (2006) highlight the fact that though censored, all the results from a data set should be used in the statistical analysis. Two reasons justify this procedure:
(i) even incomplete, censored observations provide information on the response variable, for example, the actual value of the lot;
Censoring can occur in several ways, according to various mechanisms such as right censoring, left censoring, censoring type I, censoring type II and random censoring (Lawless, 1982).
The survival analysis usually uses the right censoring mechanism, because the occurrence time of the event of interest is to the right of the time, that is, until the end of the study, the experimental unit did not fail. The mechanisms related to censoring type I (when the study ends in a preset time and some of the survival times are not observed) and random (when a patient leaves the study without having experienced the event of interest) are observed more frequently in biomedical studies. However, in industrial experiments, censoring type II (when the study ends after a certain number of pre-established failures within the items under study) are predominant (Colosimo & Giolo, 2006).
In this study, we adopted the left censoring concept. This censoring type occurs when, for ex-ample, the time registered is greater than the failure time, meaning that the event of interest happened when the individual was observed (Colosimo & Giolo, 2006). In other words, the price of the lot offered on the market is the upper limit that the owner accepts to sell it. For example, a given lot is offered for R$ 50,000.00. It will be sold (event of interest or failure) for a maximum of R$ 50,000.00, given that it is unlikely for anyone to pay any amount above the price offered. The left censoring mechanism is shown in Figure 2.
Figure 2– Left censoring mechanism for unitary urban lot value (R$).
also observe in the data, variables that represent the existing heterogeneity in the population, that is, the covariates presented in Table 1.
2.3.1 Kaplan-Meier nonparametric estimator
The following describes how the survival and hazard functions can be estimated by using the Kaplan-Meier nonparametric estimator (Kaplan & Meier, 1958), which allows the presence of censoring observations. Consider a study involvingn lots and that the values of permanence for sale, including censorship, are ordered, that is,v1 ≤ v2K≤ vn. The empirical function of
permanence for sale is estimated by:
ˆ
SK M(v)= n1−d1
n1
n2−d2
n2
Knr −dr
nr =
r;vr≤v
ni−di
ni , (1)
wherevr is the greatest value of permanence for sale smaller than or equal tov,niis the number
of lots not sold until valuevi (which represents the value of lot for sale orderedi) anddi
rep-resents the number of lots sold at valuevi (di =0 for censored values of permanence for sale),
whereican be any round value between 1 andr. In the absence of censoring, the Kaplan-Meier estimator of the function of permanence for sale reduces to,
ˆ
S(v)=
Number of lots with permanence values for sale> v
Total number of lots . (2)
The Kaplan-Meier estimator of the cumulative hazard function within the range value(0, v]is given by
ˆ
HK M(v)= −ln{ ˆSK M(v)}, (3)
whereSˆK M(v)cannot be equal to zero.
2.3.2 Weibull linear model
The Weibull distribution (1951), mostly due to its simplicity, has been one of the most com-monly used probability distributions in biomedical and industrial data modeling. Here, its use is evaluated to model the total value of the lot in Reais (R$). Its density can be described as:
f(v)= γ α
v
α
γ−1
exp−v α
γ
, (4)
whereγ >0 andα >0 are the shape and scale parameters, respectively.
The hazard and survival functions of (permanence for sale) and Weibull distribution percentages are given, respectively, by
h(v)= γ α
v
α
γ−1
, (5)
S(v)=exp−v α
γ
, (6)
vp=α[−log(1−p)]
1
γ . (7)
The hazard function in (5) is the ratio of the probability density function and the survival function (complement to the distribution function). The function is expressed as
h(v)= f(v)
S(v), (8)
describing, therefore, the relationship between the three functions that are usually used to repre-sent the behavior of the survival time or the value of permanence for sale. Expression (8) shows that the functions of survival (permanence for sale) and hazard are inversely proportional.
The accumulated hazard function of the Weibull distribution is given by
(v)= −ln[S(v)]. (9)
Due to its interpretation, the hazard function (8) has been preferred by many authors to describe the behavior of the survival time, in this case, the value of permanence for sale. The hazard func-tion describes how the instant probability of failure (failure rate) changes over time (Colosimo & Giolo, 2006; Hosmer et al., 2008). It is also known as instantaneous failure rate, mortality force and conditional mortality rate (Cox & Oakes, 1984).
Moreover, the hazard function allows to characterize special classes of distributions of survival time (value of permanence for sale), according to its behavior as a function of the sale value. The hazard function can be constant, increasing, decreasing or even monotic. Some usual distribu-tions of survival time are, for example, exponential, Weibull, lognormal, log-logistic (Colosimo & Giolo, 2006).
The exponential distribution accommodates hazard functions, whereas if the hazard function is monotonically ascending or descending inv, we have a Weibull distribution (Lawless, 1982). The log-logistic and lognormal distributions accommodate unimodal hazard functions (Kalbfleisch & Prentice, 1980). In addition, although not very common, multimodal and hazard functions in “U” shape can also be observed. Louzada-Neto (1999) proposed a multiple hazard function that accommodates these forms of hazard functions.
According to Colosimo & Giolo (2006) and Hosmer et al. (2008), in the survival analysis, the models cited above are competing with one another. To adjust a given set of sale values of real estate (they may have different forms of hazard functions), it becomes necessary to use a method-ology to select the most appropriate model, even before any adjustment.
In many applications, there is qualitative and, in many cases, structural information about the phenomenon in question, which can be used in the empirical determination of the form of the hazard function. Structural information is directly linked to the researcher’s knowledge about the phenomenon, while qualitative information can be extracted by means of a graphical analysis. In this context, a graph known as the chart of total time on test (TTT-plot) is very useful. This chart was originally proposed by Aarset (1987) and is built from the quantities:
G(r/n)=
r
i=1 Ti:n
+(n−r)Tr:n
r
i=1 Ti:n
versus A=r/n, (10)
wherer =1, K,nandTi:n,i =1,K,nare the statistics of the sample order (Mudholkar et al.,
1996).
If there is information on covariates for each individual and a significant number of individuals in each level or combination of these covariates, the TTT-plot (10) can be constructed considering each covariate level or combination separately.
In a practical context, the survival data modeling is linked to the shape of the hazard function. At this point, justification about the choice for the Weibull distribution and the whole presen-tation of the concepts in order to model the sale value of the lots in this study is necessary. In Figure 3(a), the TTT-plot presents concavity on the curve, indicating that the shape of the haz-ard function is monotonically increasing. Thus, a candidate distribution for the adjustment is the Weibull with the shape parameter greater than one. Finding a suitable probability distribution for the data in the study is the most important step of modeling, only after finding this distribution allows to estimate and test quantities of interest (Colosimo & Giolo, 2006). In Figure 3(b) the Weibull can be confirmed such as an adequate model since there is no substantial deviation from a straight line. Since the Weibull model assumes a proportionality of hazards, in Figures 3(c), 3(d) and 3(e) this proportionality was graphically checked out stratified by covariates. There-fore, all of the three covariates (“NUC PRINC”, “PLN CENTRAL” and “RODOVIA”) present proportionality along the unitary value of urban lot (R$/m2).
The next step is the construction of the likelihood function of the linear model Weibull. We consider the situation in which we have available a random samplev1, K,vn of survival times
and the values of the indicator variableδi,δi =1, ifvi is exactly observed orδi =0 ifvi is left
censored.
Based on the information(v1, δ1), K(vn, δn)that the censoring mechanism is not informative and
thatvi is from the same probability distribution indexed by parameterθ, the likelihood function
is generally written as:
L(θ )=
δi=1
f(vi|θ )
δi=0
For the Weibull distribution with parameters αandγ, considering a random samplev1, K,vn
and the indicator variable of censoringδi,δi =1 ifvi is exactly observed or left censored, the
likelihood function, in the presence of covariates, is written as:
L(α;γ|vi;δi;xi) = n
i=1
[f((vi|xi)]δi[1−S(vi|xi)]1−δi
=
n
i=1
[f((vi|xi)]δi[F(vi|xi)]1−δi ,
(12)
wherexi is the vector of covariates for thei-th lot and the indicator variable of censoring is set
as,
δi =
1, if the urban lot was sold and
0, otherwise. (13)
Applying the natural logarithm in the likelihood function and after a few steps, we obtain the following function,
l(α;γ|vi;δi;xi) = n
i=1
δi
(γ −1)ln(vi)−γln(α)+ln(γ )− vi
α
γ
+(1−δi)ln
1−exp−vi α
γ
,
(14)
wherel(α;γ|vi;δi;xi)=log[L(α;γ|vi;δi;xi)].
Here, we opted to use a selection strategy of models derived from the proposal of Collett (1994). The steps used in the selection process are described in Colosimo & Giolo (2006). Similar to the usual linear model, the model proposed by the strategy of Collett (1994) began our modeling process, never leaving aside the opinions of specialists in this field.
All data analyses and simulation studies were conducted in the computing environment R ver-sion 3.1.1 (R Core Team, 2014). We used the basic distribution packages besides the functions “survreg” and “Surv” of the “survival” package (Therneau, 2014), intrinsic to the computing environment R. “Surv” allows specifying the censoring type, in this case, left censoring and the “survreg” function allows specifying the distribution of interest, in this case, the Weibull distribution.
For the model construction, the database was divided into two parts: 70% for model adjustment and 30% for model validation.
3 RESULTS AND DISCUSSION
3.1 Descriptive and exploratory analysis
2 3 4 5 6 7
−8
−6
−4
−2
0
2
Covariate: NUC_PRINC
log[Unitary value of urban lot (R$/m2
)]
log{−log[S
^(v)]}
NUC_PRINC=0 NUC_PRINC=1
(c)
2 3 4 5 6 7
−8
−6
−4
−2
0
2
Covariate: PLN_CENTRAL
log[Unitary value of urban lot (R$/m2
)]
log{−log[S
^(v)]}
PLN_CENTRAL=0 PLN_CENTRAL=1
(d)
2 3 4 5 6 7
−8
−6
−4
−2
0
2
Covariate: RODOVIA
log[Unitary value of urban lot (R$/m2)]
log{−log[S
^(v)]}
RODOVIA=0 RODOVIA=1
(e)
(2) and (3). In Figure 4(a), empirical function of permanence for sale is presented, estimated using the non-parametric method of Kaplan-Meier and in Figure 4(b), the cumulative empirical hazard function is shown. In Figure 4(a), we observe that as the lot value increases, the probabil-ity for the lot remain for sale decreases, that is, when the value is high, there is little probabilprobabil-ity of a lot to become available for sale. The probability of a lot to remain for sale for the minimum value 200 (R$/m2) is 0.05. Figure 4(b) presents the empirical cumulative hazard. The cumula-tive hazard is a non-decreasing function, if the cumulacumula-tive hazard is increasing it means that the hazard is larger than zero but it not means that the hazard is increasing. Moreover, from approx-imately 310 (R$/m2) the cumulative hazard is constant, meaning that from this value onward the hazard is null. When the hazard increases, the likelihood of permanence for sale decreases and vice versa.
Figure 4– (a) Curve of permanence for sale estimated by the Kaplan-Meier method; (b) empirical cumula-tive sale hazard and confidence intervals at 95%.
3.2 Weibull linear model
We considered only lots with an area smaller than or equal to 800 m2while the lots not sold in
strategy of models derived from the strategy proposed by Collett (1994). It is based on the ratio test of likelihood.
At the end of the selection strategy of covariates (Table 2), the final model is obtained:
log(Vi)=β0+β1∗NUC PRINC+β2∗PLN CENTRAL+β3∗RODOVIA (15)
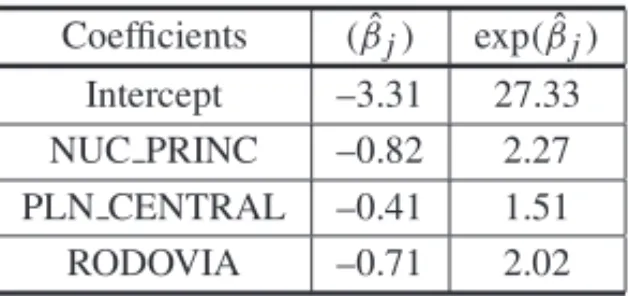
The estimates of parameters and respective sale hazards considering the Weibull model with left censoring are shown in Table 2.
Table 2– Estimation of parameters of coefficients(βˆj)and the sale hazard associated with each covariate given by exp(βˆj),j=0, . . . ,3.
Coefficients (βˆj) exp(βˆj) Intercept –3.31 27.33 NUC PRINC –0.82 2.27 PLN CENTRAL –0.41 1.51 RODOVIA –0.71 2.02
The estimated shape parameter of our final model is 2.57, greater than one, showing that the sale hazard function increases according to the information obtained through Figures 3(a), 3(b), 3(c), 3(d) and 3(e) that showed the Weibull distribution with shape parameter greater than one, a plausible distribution for the adjustment.
We observe that for the Weibull regression, the three covariates that comprise the final model increased the sale hazard of lots and can be considered valuation factors during the sale of the lots. For example, the sale hazard of a lot located adjacent to the agglomeration of the City Center was exp(0.82)=2.27 times higher compared to a lot located in rural installments. The hazard sale of a lot located within the Central Hill was, exp(0.41)=1.51 that is, for a lot inside the Central Hill there was a 51% increase in the sale hazard in relation to a lot located outside of the Central Hill. For a lot whose accessibility to the City Center is not affected by Highway SP-310 (Washington Luiz Highway), the sale hazard was around 2 times higher in relation to a lot whose accessibility to the City Center is affected by Highway SP-310. Another interesting interpretation is to compare the sale hazard of lots contiguous to the agglomeration of City Center (“NUC PRINC”) with the lots located within the Central Hill (“PLN CENTRAL”). To estimate this hazard, exp[−(−0.82+0.41)] = 1.51 is calculated. Thus, there was an increase of sale hazard of 51% for lots contiguous to agglomeration of City Center compared to lots located within the Central Hill. In other words, the lots located in the agglomeration of the City Center had an appreciation of 51% compared to lots located in within the Central Hill. More details about the discussion on implications from the perspective of urban planning are presented in Ferreira (2007).
is higher for the curves to the right. For example, the dashed blue curve (“PLN CENTRAL + RODOVIA”) referring to the lots located simultaneously within the Central Hill whose acces-sibility to the City Center is not affected by Highway SP-310 presents the highest unitary lot value compared to other curves. Lots located exclusively within the Central Hill (red curve) had the lowest unitary lot price, in R$/m2, among the curves. For lots located within the Central Hill (“PLN CENTRAL”), the value at which about 50% (median value) of these lots are sold is R$36.00/m2, while for lots whose accessibility to the City Center is not affected by Highway SP-310, this value hovers around R$50.00/m2.
0 50 100 150 200
0.0
0.2
0.4
0.6
0.8
1.0
Estimate of permanence function for sale − Weibull
Unitary value of urban lot (R$/m2)
S
^ (v
) NUC_PRINC
PLN_CENTRAL RODOVIA
PLN_CENTRAL + RODOVIA
Figure 5– Curves of permanence for sale estimated from each stratum and combinations of interest for the Weibull linear model considering the left censoring mechanism. The horizontal dotted gray lines refer to 90% and 50% (median value). The vertical dotted black line refers to the value of R$36.00/m2.
(“PLN CENTRAL”) are still available for sale above R$18.00/m2. Therefore, for lots located
within the Central Hill whose accessibility to the City Center is not affected by Highway SP-310, there is a greater likelihood of a lot to remain for sale for the minimum value of R$36.00/m2 in relation to lots located within the Central Hill. For all strata and combinations, the proba-bility is zero for a lot to remain for sale at a value greater than R$150.00/m2, according to the Weibull model.
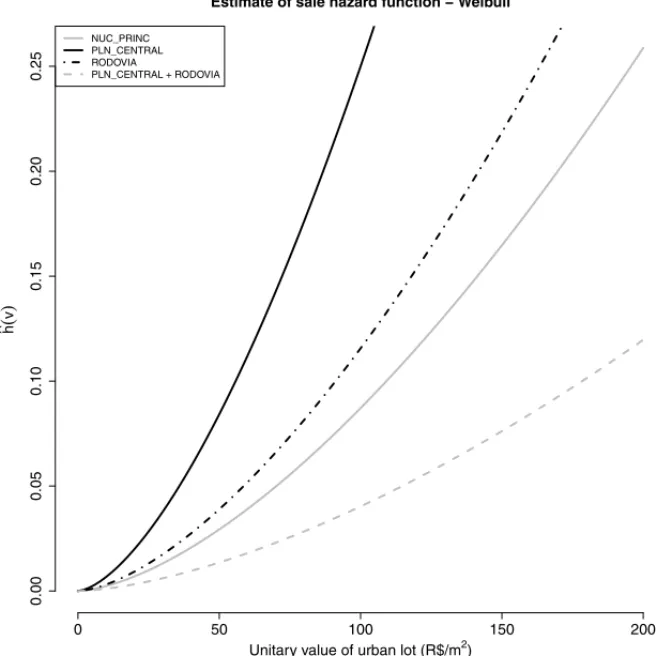
Figure 6 shows that the hazard or instant sale rate is increasing, that is, as the lot value increases, the hazard of selling it for this exact value also increases. For example, lots located within the Central Hill (“PLN CENTRAL”) show greater hazard of instant sale. While lots located simul-taneously in the Central Hill whose accessibility to the City Center is not affected by Highway SP-310, represented by the dashed blue curve, had lower hazard of instant sale.
0 50 100 150 200
0.00
0.05
0.10
0.15
0.20
0.25
Estimate of sale hazard function − Weibull
Unitary value of urban lot (R$/m2)
h
^ (v
)
NUC_PRINC PLN_CENTRAL RODOVIA
PLN_CENTRAL + RODOVIA
Figure 6– Hazard curves (instant sale rate) estimated from each stratum and combinations of interest for the Weibull linear model considering the left censoring mechanism.
example, for lots located within the Central Hill (“PLN CENTRAL”), the hazard for these lots to be sold for the exact value of R$50.00/m2is 0.08 (instant hazard), while the hazard of these lots be sold at most R$50.00/m2is 1.70 (cumulative hazard).
0 50 100 150 200
0
5
10
15
20
Estimate of sale cumulative hazard function − Weibull
Unitary value of urban lot (R$/m2)
H
^(v
)
NUC_PRINC PLN_CENTRAL RODOVIA
PLN_CENTRAL + RODOVIA
Figure 7– Cumulative hazard curves (cumulative sales rate) estimated from each stratum and combinations of interest for the Weibull linear model considering the left censoring mechanism.
4 CONCLUSION AND FURTHER STUDIES
The survival analysis is more flexible and uses all the information available in the database of real estate evaluation, because it allows including the effectively traded lots (not censored) and lots in negotiation (censored) in the modeling process. The same does not occur when the usual linear models are considered. The survival analysis allowed estimating the likelihood of a lot to remain for sale and the sale hazards associated with the market value of the lot. Moreover, it allowed the construction of a model to predict the market value of the lot.
of these “micro” variables, within homogeneous regions, and the use of statistical and computa-tional approaches, such as Generalized Linear Models and Artificial Neural Networks, could be considered in future studies.
REFERENCES
[1] AARSETMV. 1987. How to identify a bathtub hazard rate.IEEE Transactions on Reliability, 36: 106–108.
[2] ABREUMA. 1994. O estudo geogr´afico da cidade no Brasil: Evoluc¸˜ao e avaliac¸˜ao. In: CARLOS
AFA (Ed.)Os caminhos da reflex ˜ao sobre a cidade e o urbano.S˜ao Paulo: Editora da Universidade de S˜ao Paulo.
[3] ANDREEVAG, ANSELL J & CROOKJ. 2007. Modelling profitability using survival combination scores.European Journal of Operational Research,183(3): 1537–1549.
[4] COLLETTD. 1994.Modelling Survival Data in Medical Research. New York: Chapman and Hall. [5] COLOSIMOEA & GIOLOSR. 2006.An´alise de Sobrevivˆencia Aplicada.S˜ao Paulo: Edgard Bl¨ucher. [6] COXDR & OAKESD. 1984.Analysis of Survival Data. London: Chapman and Hall.
[7] COXDR. 1972. Regression models and life tables.Journal of the Royal Statistical Society, Series B,
34: 187–220.
[8] DANTASRA. 1998. Engenharia de Avaliac¸˜oes, Uma Introduc¸˜ao `a Metodologia Cient´ıfica. S˜ao Paulo: PINI. Vol. 1.
[9] DROGUETTEL & MOSLEHA. 2007. Time to failure assessment of products at service conditions from accelerated lifetime tests with stress-dependent spread in life.Pesqui. Oper.,27(2): 209–233. [10] FERREIRA JF. 2007. Proposta de tratamento da vari´avel localizac¸˜ao em modelos inferenciais
de avaliac¸˜ao imobili´aria para munic´ıpios m´edios. Dissertac¸˜ao (Mestrado em Engenharia Urbana) – Departamento de Engenharia Civil, Universidade Federal de S˜ao Carlos. Exame de defesa realiza-do em 18/12/2007.
[11] HERMANNBM & HADDADEA. 2005. Mercado imobili´ario e amenidades urbanas: a view through the window.Estudos Econˆomicos,35(2): 237–269.
[12] HOSMERD, LEMESHOWS & MAY S. 2008.Applied Survival Analysis: Regression Modeling of Time to Event Data.(2nd ed.). Wiley-Interscience.
[13] INSTITUTO BRASILEIRO DEGEOGRAFIA E ESTAT´ISTICA– IBGE. 2002.Base de Informac¸˜oes Municipais[CD-ROM]. (3rd ed.). Rio de Janeiro: IBGE.
[14] JOHNSONRA & WICHERNDW. 1998.Applied Multivariate Statistical Analysis.(4th ed.). Upper Saddle River, NJ: Prentice-Hall Inc.
[15] KALBFLEISCHJD & PRENTICERL. 1980.The Statistical Analysis of Failure Time Data. New York: John Wiley and Sons.
[16] KAPLANEL & MEIERP. 1958. Nonparametric estimation from incomplete observations.Journal of the American Statistical Association,53: 457–481.
[18] LOUZADA-NETOF. 1999. Polyhazard regression models for lifetime data.Biometrics,55: 1281– 1285.
[19] LOUZADA-NETOF, MAZUCHELIJ & ACHCARJA. 2002. An´alise de Sobrevivˆencia e Confiabili-dade. Lima, Peru: Instituto de Matematicas y Ciencias Afines, IMCA. Vol. 1.
[20] MANTELN. 1966. Evaluation of survival data and two new rank order statistics arising in its consid-eration.Cancer Chemotherapy Reports,50: 163–170.
[21] MANTEL, NE & HAENSZELW. 1959. Statistical aspects of the analysis of data from retrospective studies of disease.Journal of the National Cancer Institute,22: 719–748.
[22] MINISTERIO DAS´ CIDADES. 2005.Cadastro Multifinalit´ario como instrumento de pol´ıtica fiscal e urbana. Organizadores: Diego Alfonso Erba et al. Rio de Janeiro.
[23] MUDHOLKAR GS, SRIVASTAVA DK & KOLLIA GD. 1996. A generalization of the Weibull distribution with application to the analysis of survival data.Journal of the American Statistical Association,91(436): 1575–1583.
[24] R CORETEAM. 2014. R: A language and environment for statistical computing. R Foundation for Statistical Computing, Vienna, Austria. http://www.R-project.org.
[25] RYANTP & WOODALLWH. 2005. The Most-Cited Statistical Papers.Journal of Applied Statistics,
32(5): 461–474.
[26] SANTOS M. 2003. Economia Espacial. Cr´ıticas e Alternativas. Trad. MARIA IRENE DE Q.F. SZMRECSANYI´ . (2a ed.). S˜ao Paulo: Editora da Universidade de S˜ao Paulo. (Colec¸˜ao Milton Santos). [27] SANTOS M. 2005.Da Totalidade ao Lugar.S˜ao Paulo: Editora da Universidade de S˜ao Paulo.
(Colec¸˜ao Milton Santos).
[28] S ˜AOCARLOS. 2006. Prefeitura Municipal – Divis˜ao de Cadastro Imobili´ario.Base de dados cadas-trais.
[29] SOUZAJ. 2009.A ral´e brasileira – quem ´e e como vive.Belo Horizonte: Editora UFMG.
[30] THERNEAU T. 2014.survival: A Package for Survival Analysis in S. R package version 2.37-7. http://CRAN.R-project.org/package=survival (acesso em 12 out. 2015).
[31] WEIBULLWA. 1951. A statistical distribution of wide applicability.Journal of Applied Mechanics,
18: 293–297.

![Figure 3 – (a) TTT-plot for the unitary value of urban lots (R$/m 2 ) in S˜ao Carlos City, SP, in the year 2005; (b) Plot of the empirical log{− log[ ˆS K M (v)]} against log[Unitary value of urban lots (R$/m 2 )], and its estimated curve; (c) Plot of the](https://thumb-eu.123doks.com/thumbv2/123dok_br/18871364.420181/13.1063.199.931.134.1152/figure-unitary-value-urban-carlos-empirical-unitary-estimated.webp)