BRANDSTETTER, M. C. G. de O. ; CARASEK, H. ; SIQUEIRA, R. Analysing t he l ogist ics impact on t he cost composit ion of a mechanised spraying process of rendering mort ar. Ambiente Const ruído, Port o Al egre, v. 18, n. 2, p. 107-132, abr. / j un. 2018.
107
composition of a mechanised spraying process
of rendering mortar
Anál i se do i mpact o da l ogíst i ca na composi ção do cust o do
si st ema de pr oj eção de ar gamassas par a r evest i ment o
Maria Carolina Gomes de Oliveira Brandstetter
Helena Carasek
Rainiere Siqueira
Abstract
he process of mortar mechanical projection has been approved in terms of its performance, but industrial management knowledge should be applied to understand the economic viability of the system. The aim of this paper is to evaluate the productivity and logistics impact of the mechanised spraying process of rendering mortar on its global cost composition. On a worldwide scale, there are no studies that correlate logistics, productivity and costs for mortar rendering systems, indicating the originality of the research. A multiple case study was proposed. A comparison was made between the manual application and mechanical projection methods of internal wall plastering. The data collection included identifying logistic bottlenecks, studying productive times, lead time, productivity, material consumption and losses and cost composition. The results showed that in both systems an impact on logistics occurs around 50% in teams´ productivity indices and global costs. The impact of productivity on indirect costs that reduce execution time and economic feasibility of the projection system is possible due to strategies that translate logistics efficiency.
Keywords: Mortar. Mechanical projection. Cost. Logistics. Productivity.
Resumo
O processo de projeção mecânica de argamassa possui comprovada aprovação de seu desempenho no âmbito da qualidade, porém torna-se necessária a aplicação de conhecimentos de gestão industrial que permitam compreender a viabilidade econômica do sistema. O objetivo do trabalho é avaliar o impacto da produtividade e da logística do processo de projeção mecanizada de argamassa de revestimento em sua composição de custo. No âmbito mundial não existem trabalhos que correlacionem logística, produtividade e custos para os sistemas de revestimento de argamassa, indicando a originalidade da pesquisa. O método abrangeu um estudo de caso múltiplo. Realizou-se uma comparação entre os métodos de aplicação manual e de projeção mecânica de revestimentos em paredes internas. A coleta dos dados abrangeu a identificação de gargalos logísticos, estudo dos tempos produtivos, lead time, produtividade, consumo de materiais e perdas e composição dos custos. Os resultados apontaram que em ambos os sistemas o impacto da logística ocorre em torno de 50% sobre os índices de produtividade das equipes e sobre os custos globais. O impacto da
produtividade sobre os custos indiretos que permitem a diminuição do prazo de execução e a viabilização econômica do sistema de projeção, torna-se possível somente a partir das estratégias que traduzem a eficiência logística.
Palavras-chave: Argamassa. Projeção mecânica. Custo. Logística. Produtividade.
T
Maria Carolina Gomes de Oliveira Brandstetter
Universidade Federal de Goi ás Goiânia - GO - Brasil
Helena Carasek
Universidade Federal de Goi ás Goiânia - GO - Brasil
Rainiere Siqueira
Universidade Federal de Goi ás Goiânia - GO - Brasil
Introduction
Plastering and rendering represent a significant portion of the building construction cost and may reach 10-30% of a company´s total cost, depending on the type of construction and its standard (PARAVISI, 2008).
Despite the importance, mortar rendering systems still have low levels of rationalisation and industrialisation, as well as high variability in both product quality and productivity indices and losses. This system still represents a bottleneck for construction works, causing cost increase and expansion in building production periods. According to Ceotto, Banduk and Nakamura (2005), mortar-based renderings did not follow the technological development of other building subsystems. This happens due to the lack of integration in the production chain and knowledge improvement regarding rendering behaviour considering the whole system. One of the steps in this process, which remains highly dependent on labour is the mortar application. The mortar spraying equipment could be an alternative to solve these deficiencies, however it still has a great potential for improvement.
Studies regarding applied materials behaviour and construction techniques intend to prove higher performance of mortar renderings accomplished using a mechanical spraying method and dry-mix mortar, indicating that this solution, from a materials technology point of view is already well consolidated (CARASEK, 2012; ZANELATTO et al., 2013). However, its viability may not be considered only in terms of quality, but also applying industrial management knowledge in rendering execution processes by means of planning mechanisms, production control, flow of values and, of course, logistics.
Concerning rendering performance quality, a large body of research has shown that the bond strength achieved with mechanised spraying mortar is better than that using a manual application (SOUZA, 2004; DUAILIBE; CAVANI; OLIVEIRA, 2005; CARASEK, 2012; ZANELATTO et al., 2013). In addition, the great advantage of a mechanised spraying method, besides increasing the adherence average value, is the reduction in the variability of this property, causing smaller variation coefficients (CARASEK, 2012).
Paravisi (2008) succeeded in comparing facade
production and reductions in time execution compared to manual processes, although results regarding the final applied product technical quality were indeed better. These results corroborate the need to evolve studies in logistics and costs as the projection is considered a technological advance that requires preparing the team for a new technology.
Mortar projection methods began in the seventies, however even after so much time and considering the advances due to this technology for mortar rendering applications, until today only a few companies use this technology. That is why it is extremely necessary to understand the real impact and main difficulties of using them. The lack of interest in this subject is unfortunately also found in the academic environment due to the lack of research for mortar rendering systems that correlates logistics, productivity and costs, showing a gap in scientific knowledge.
Therefore, in this context, the present research is based on the assumption that using mechanised spraying of cement mortars for plastering represents a way of rationalising the system. However, its economic viability depends on the integrated management of logistics and production.
This study aims to evaluate the impact on productivity and logistics for the mechanised spraying process of rendering mortar in its global cost composition.
Theoretical foundation
The theoretical foundation is based on the synthesis of the main concepts: logistics, productivity and costs within the construction field, as well as the systematic mapping review focusing on costs related to the mortar rendering process.
Main concepts
Common adversities for constructions include planning and controlling materials and people, a flow of materials and services, correct information in workstations, defining suitable technologies, as well as the most convenient location for equipment and so on. The negative impacts of these issues may be minimised through studies on logistics.
suppliers; operative logistics related to internal operations and the clients-related distribution logistics.
Concerning construction, site logistics deals with physical flow management and information related to executing these activities. Planning and organising construction site logistics affect workers’ displacement time and the cost of transporting materials, and therefore hinders the activities carried out, as well as the global productivity of construction work and services (NIU et al., 2017). For activities on the construction site, focus will be on operative logistics.
According to Koskela (2000), the reduction in cycle time may be related to reducing the share of non-value-adding activities such as waiting, inspection and moving. Thus, when changing the activity times, especially those that do not add value to the process, as a major part of the logistics activities, process costs can be minimised by lead time reduction.
Managing activities related to logistics causes a strong impact on companies´ costs, especially the delivery of materials, which may impact up to 25% of the time due to delays in productive cycles (NIU et al., 2017).
Moreover, materials, equipment and labour are traditionally seen as elements that structure the cost composition of construction services. Nevertheless, it is worth mentioning that these compositions are arranged based on indices that represent the coefficient of utilisation of each one of these inputs. Therefore, improvement of these indices will affect the final cost composition of each process.
Among these input utilisation indices, labour productivity is strongly affected by logistic decisions, which should define the productive cycle time.
Labour productivity can be physically expressed as the efficiency in the transformation of workers' efforts into products, in the case of construction, in the work or parts thereof (SOUZA, 2006).
Due to the lower stability of the construction industry compared to the serial industry, variations in characteristics that lead to variations in productivity may be even more complex to measure. According to Thomas and Yakoumis (1987), these characteristics are factors that may be connected to the content of the service studied, such as the project and the materials, as well as the service context, for instance environmental and management aspects.
When executing renderings, some examples of factors related to content are the quantity of edges
and corners, and render thickness. Concerning context-related factors, the type of application (mechanical or manual), the way to access the coated area, the way of supplying and transporting materials and the place of mortar production, among others may be cited (SILVA, 2002).
Furthermore, productivity may be affected by some abnormalities, such as equipment breakage, lack of water and energy, delay in the materials supply, among others.
It is understood, therefore, that the decisions related to the logistics have an impact on the productivity of the teams involved in the process, and can change the cycle time and, consequently, they impact the overall cost of the productive process.
Cost and rendering mortar studies
In order to better understand the extension of the proposed theme, a Systematic Mapping Review (SMR) was conducted, focusing on English language journals.
By combining search strings related as main inputs: "cost" and "rendering mortar", no studies regarding costs were found for the mortar coating process. This search result may be due to the fact that in most countries, especially in Europe, building constructive processes are quite different from those in Brazil, such as using mortar rendering in multi-store buildings. The string “mortar” was combined with the strings “cost”, “economic benefits” and “cost-benefit assessment”. From the 577 studies initially found with the last strings, and after snowball sampling, the scope was decreased to 54 studies to be totally read.
The final filter reached a total of 14 articles related to the topic of economic benefit. It is worth mentioning that there was no study relating cost composition of mortar coating execution processes concerning different technologies.
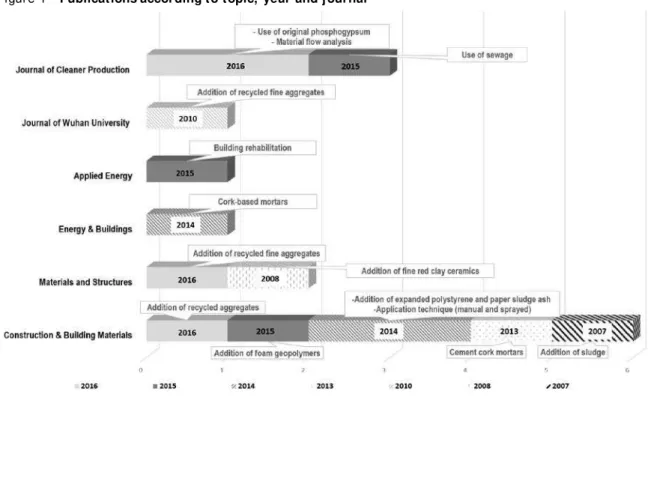
Figure 1 illustrates the amount of publications according to the study´s main object, year and journal, considering the last ten years of publications.
(NOOR-UL-AMIN, 2012); recycled aggregates (SILVA; BRITO; DHIR, 2016; BRAGA; BRITO; VEIGA, 2012; POON; KOU, 2010; FERRÁNDIZ-MAS et al., 2014; SILVA; BRITO; VEIGA, 2008); biomass ash from the cocoa industry (SILVA et al., 2015); phosphogypsum (YANG; ZHANG; YAN, 2016); fine sanitary ware aggregates (FARINHA et al., 2016).
Some studies dealt with the mortar’s economic benefits related to other aspects. Ibrahim et al. (2015) studied the economical aspects of the mortar composition in building rehabilitations. Wang et al. (2016) proposed a systematic model of material flow that integrates production, use and waste management, as well as emissions monitoring cement industries in China. The economic benefits are related to the improvement of the industry’s eco-efficiency.
The only study found in the SMR which is directly related to the topic of this research was carried out by Bernat-Maso et al. (2014). In this case, the authors emphasised productivity aspects, but did not quantify the costs involved in the process.
Therefore, no research was found relating costs, productivity and logistics in mortar coating
execution which leads us to infer that the present research has an important originality.
Research method
This research has a methodological development applied in two main axes in order to achieve the results:
(a) logistics impact on productivity;
(b) productivity impact on global costs of the mortar mechanical spraying system;
(c) the need to conduct a qualitative research is characterised in the first method axis, aiming to approach questions related to logistics bottlenecks; and
(d) in the second axis, the need is emphasised to conduct a quantitative study with data collection of times, movements, consumption of materials and production reached. This quantitative approach shows productivity results provided by logistics management and their consequences on direct, indirect and global costs of the mortar spraying system.
A multiple case study comprising 3 cases was proposed.
In order to scientifically validate the comparison of cost results between both methods of manual application and mechanical projection on plastering internal walls, a case study with an identical research basis was sought, i.e. a case where this approach of comparative results would be obtained in the same construction work (Company A), with the same project’s characteristics, learning effects, management and logistics. Three teams were considered: two from projection rendering and one from manual rendering.
In addition to this case study for comparing costs, two other studies (Companies B and C) were conducted to evaluate the remaining parameters of logistics, productivity and consumption, which comprised the process cost evaluations.
It is worth clarifying the flow considered in this research, which considers only activities inside the construction site, i.e. the logistics from the moment the material comes into the construction site. The activities from the department of planning, procurement and transportation of the supplier to the site were not addressed.
The multiple case study comprised three companies located in Goiás State, in the Central-West region of Brazil. Company A: a high standard residential building with a basement, ground floor and 19 floors of standard apartments, and one floor of duplex apartments. Data collection covered rendering execution from the 14th floor.
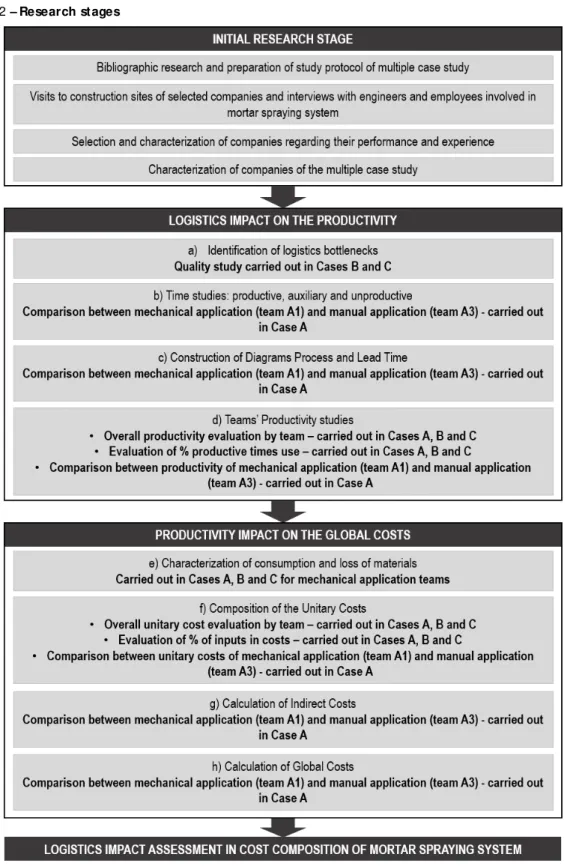
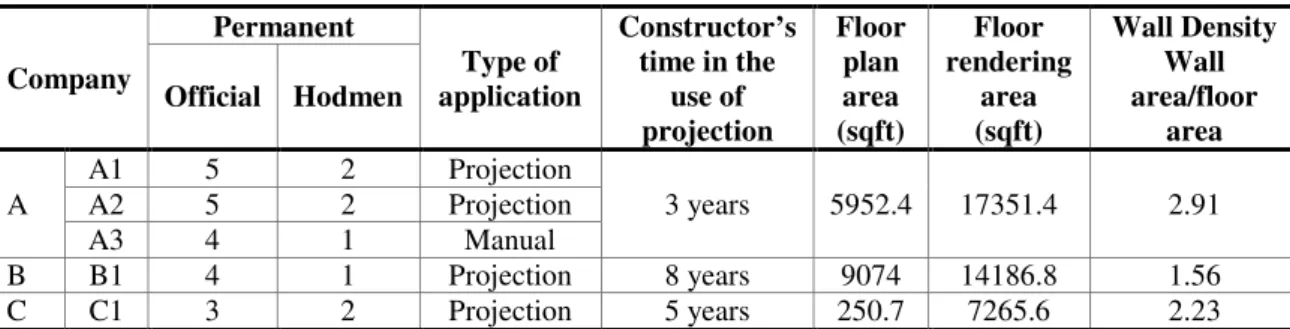
Company B: mixed commercial and residential character aimed at a high standard of economic class with 2 basements, ground floor and 3 garage floors, 17 commercial floors and 11 more floors of residential apartments. Data collection covered rendering execution from the 23rd floor. Company C: a residential building, aimed at a medium-high standard economic class, with 3 basements, ground floor and 37 standard floors. Data collection covered rendering execution from the 20th floor. Figure 2 illustrates the overview of the method and the research stages. Companies (A, B, and C), as well as their execution teams of internal mortar coatings, are characterised in Table 1.
The projects´ characteristics, which influence the mortar coating system, may be evaluated mainly by the wall density index taken from the relationship between 2 areas: plaster and floor. This relationship reveals a higher or lower complexity of these systems because as the index increases, the amount of “larger rendering areas” decreases, requiring greater displacement of the teams to apply mortar, which may lead to a reduction in productivity.
The study aimed to identify the percentage of productive, auxiliary and unproductive times for the execution process of the cement mortar projection system used for rendering – one-coat render, and therefore to correlate productivity indices to the applied logistics, the impact on unit cost service composition, the construction work deadline and the reduction in the indirect costs and global costs of the coating system.
Hereafter, the way the data was collected is presented, according to stages proposed in the flowchart illustrated in Figure 2.
Logistics bottlenecks
The problems faced in the whole coating system chain with mechanical applications were raised from the arrival of the dry-mix mortar on the construction site to its technical characteristics, recommendations for dosages, unloading, stocks, transports, spraying equipment, application, edges and corners and cleaning. This qualitative character study was conducted to collect the solutions adopted in cases B and C.
Time studies
A sampling work technique based on probability was used, considering that time spent on a construction site may be placed in a dichotomized way, similarly to the binary response processes (BARNES, 1977; SANTOS, 1995). This technique enabled us to check the times studied, that were divided into productive (time effectively applied for the task execution), auxiliary (activities necessary for the work execution, such as transporting, cleaning, unloading, measuring, and so on) and unproductive times (those that do not add any value to the final product, including the idle times). Data were collected by instantaneous observations from the work team. The calculation is based on the probability of the occurrence of a particular phenomenon, aiming at a confidence level of 95%. The number of observations necessary may be estimated by the following equation from Barnes (1977) observed in Equation 1:
𝑆𝑆𝑆𝑆= 2 .�𝑝𝑝 (1−𝑝𝑝)
𝑁𝑁 Eq. 1 Where:
Sp is the relative error desired, expressed in decimals;
p is the activity occurrence percentage, related to the total amount of observations, expressed in decimals; and
This time study was conducted in Case Study A, considering a manual rendering team and another that uses a mechanical projection process. A total of 3,840 observations were conducted considering
twelve workers (7 from Team A1 and 5 from Team A3). This research stage was conducted to set up the process diagrams and lead times quantification.
Table 1 – Characteristics of multiple case st udy Company Permanent Type of application Constructor’s time in the
use of projection Floor plan area (sqft) Floor rendering area (sqft) Wall Density Wall area/floor area Official Hodmen
A
A1 5 2 Projection
3 years 5952.4 17351.4 2.91
A2 5 2 Projection
A3 4 1 Manual
B B1 4 1 Projection 8 years 9074 14186.8 1.56
C C1 3 2 Projection 5 years 250.7 7265.6 2.23
Diagram processes and Lead Time
Charts and symbols were used in this stage to show how the process is developed (LAGO, 2000). To do so, layouts of construction sites were studied in order to have a better understanding of the materials´ physical flows. Aiming at full coverage and a better comprehension of the process, besides the graph mapping of the flows, the times consumed were measured in each activity developed in the process, totalising the lead times.
In addition to the productive times measured in the mortar application, whether manual or projection, there was a concern about the time spent on auxiliary activities and on unproductive times. The auxiliary activities involved receiving and unloading the dry-mix mortar, cement, sand and lime; the mortar production on the construction site; the horizontal and vertical transport; installation of corner-beds and metal reinforcement meshes, as well as the cleaning. For unproductive times, the breaks waiting for the material and maintenance of equipment were also measured.
Teams´ productivity
In order to study the teams´ productivity involved in the processes of internal mortar coatings, the Factor Model (THOMAS; YIAKOUMIS, 1987; SOUZA, 2006) was used. It establishes a daily measurement of productivity related to human effort, evaluated in Men x Hour (Hh), to the amount of service performed, from the UPR (Unitary Production Ratio) indicator established on a daily, cumulative and potential bases. Mathematically UPR potential is calculated as the median value of daily UPR which is below the UPR cumulative value at the end of the study period. The data analysis also considered the loss in productivity of labour, which is an indicator for the analysis of factors associated with management, calculated by the percentage difference between cumulative UPR and the potential UPR per team, related to the data collection period.
The productivity indices were achieved by making labour appropriation cards, which consist of registering the time worked for each function of the team, the equipment and their production on the coating area. On the same card, the amount of mortar spent on producing the coating is also registered in a period of a production cycle, i.e. per floors.
Team productivity was collected for all teams in the 3 cases. There was no variation in the amount of workers in any of the teams in both processes evaluated during the whole data collection time. In Case Study A, Teams A1, A2 and A3 worked on different floors with the same floor rendering area.
Consumption and loss of materials
The consumption and loss of mortar were calculated using the amount of material that is theoretically planned for the execution of an “area” of coating by means of survey in loco and, then the amount of material effectively consumed to accomplish the same “area” is registered. Sampling considered all floors in which labour productivity data collection occurred. The mortar loss index is shown in Equation 2 (SOUZA, 2005; PALIARI, 2008).
𝐿𝐿𝐿𝐿𝐿𝐿𝐿𝐿 (%) =�𝐶𝐶𝐶𝐶𝐶𝐶𝐶𝐶𝐶𝐶−𝐶𝐶𝐶𝐶𝐶𝐶𝐶𝐶
𝐶𝐶𝐶𝐶𝐶𝐶𝐶𝐶 �× 100(%) Eq. 2 Where:
Loss (%) is the percentage index of loss of dry-mix mortar;
Creal is the consumption of mortar effectively used; and
Cteo is the consumption of material theoretically necessary – planned.
The loss of material was calculated according to the consumption of mortar per team and then compared to the loss index related to that indicated by the manufacturer.
Composition of the Unitary Costs
of each input. The consumption indices are, in the case of materials, the dry-mix mortar consumption or job-site mortar and, in the case of labour, the UPRs are expressed in mh/sq ft. Table 2 illustrates the inputs considered in this research.
Indirect costs
This calculation, related to the rendering system, was carried out using the direct ratio between rendering labour and total labour. Establishing the plastering execution deadline results in multiplying the total area of plastering by the global UPR for each team, and then dividing it by the effective plastering.
By establishing the execution deadline, the indirect costs will be calculated by the sum of the expenses of the construction site and services, administration, consumption and equipment proportionally for this period.
Global costs
This is the sum, per team, of the total direct and indirect costs. These global costs achieved and their comparison with two teams with different application methods, manual and projection, was the basis for comparison between the logistics reflexes on the productivity and global costs. Therefore, the fundamental question of this research was answered, which addresses the economic viability of the mortar spraying method for the internal wall plastering execution.
Results and discussion
The results of this research correlate logistics performance to the indices of productivity, consumption, losses, unitary costs and global costs of mortar rendering systems. The results and discussions follow the steps established by the overview of the method.
Logistic Bottlenecks
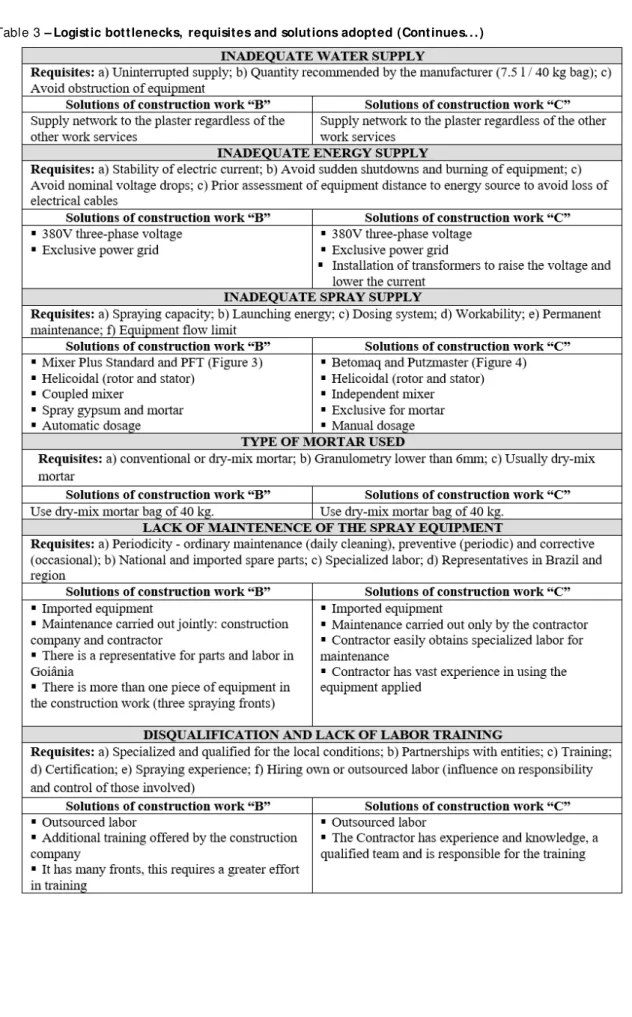
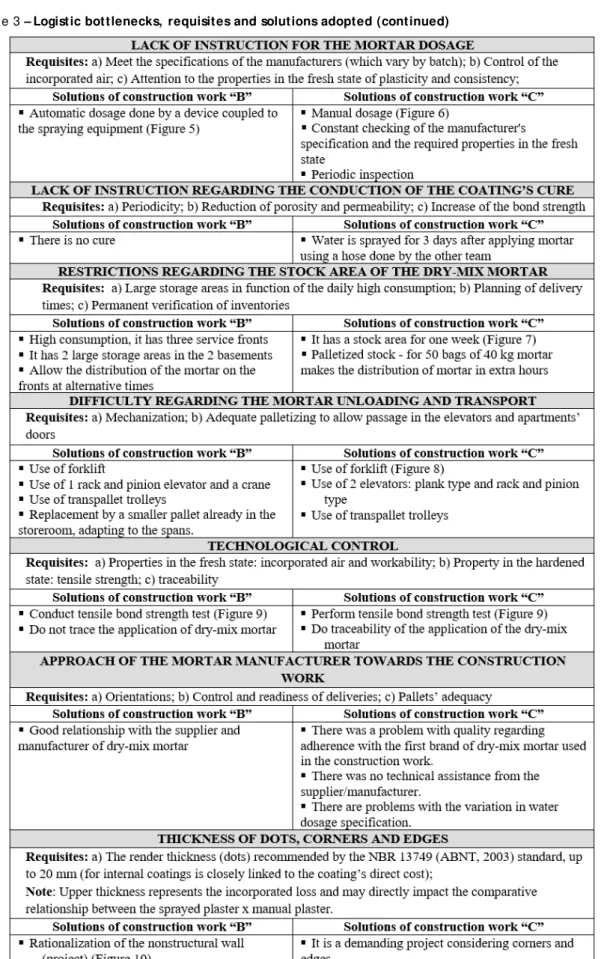
Table 3 illustrates logistic bottlenecks, requisites and solutions adopted in cases B and C. Figures 3 to 11 illustrate different steps of the mortar spraying process.
Construction of the process
diagrams and lead time
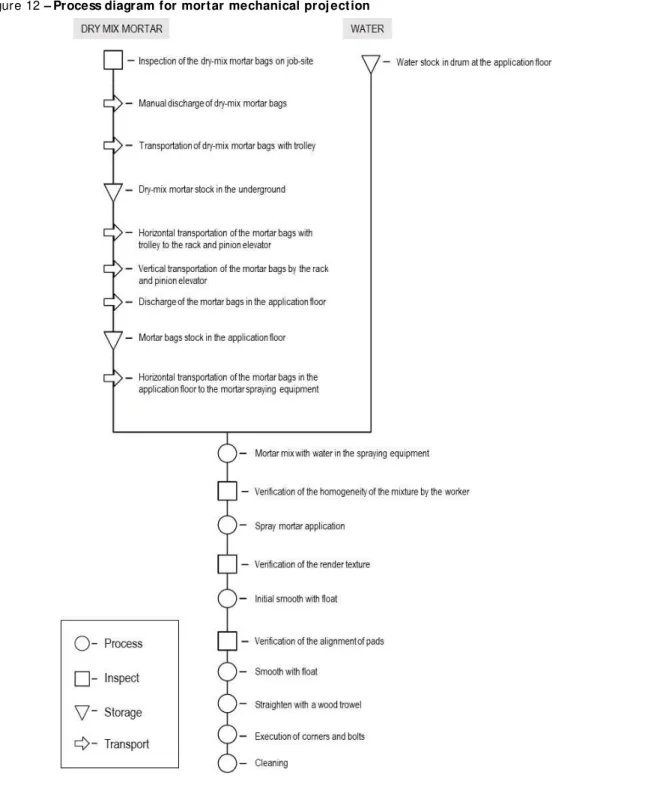
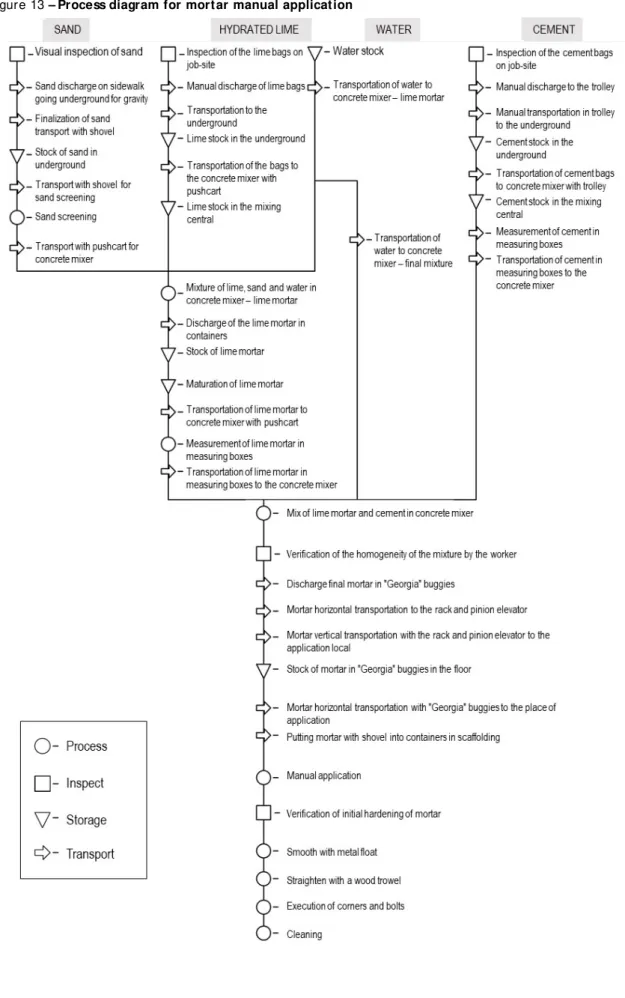
Figures 12 and 13 illustrate the process diagrams for mortar mechanical projection and mortar manual application. Table 4 presents the comparison of the productive times for two work teams A – A1 for mortar mechanical projection and A3 for mortar manual application.
The mortar mechanical projection process has shown 49% fewer activities than the manual application process. From all activities, those related to transportation were the ones with the greatest reduction, corresponding to 63% fewer activities than the manual system.
The total lead time, considering productive, auxiliary and unproductive activities was calculated for each application method. For 10.764 sqft of rendering, the following times shown in Figure 14 were reached.
A loss of 193.42 hours was observed in the total execution time in 10.764 sqft of wall rendering when a manual application of job-site mortar is used to compare the mechanised projection of dry-mix mortar. The mechanised system achieved a more favorable distribution related to the productive and auxiliary times compared to the manual system, but with a slightly higher percentage of idle unproductive times.
The lead time of the mechanised process is 18% shorter than the manual process.
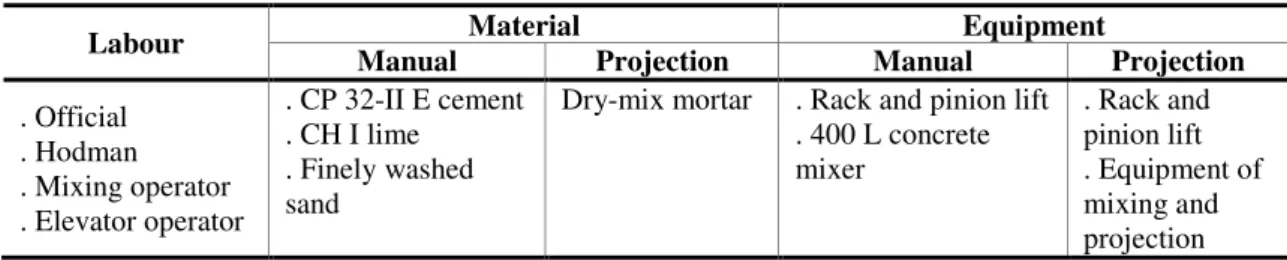
Table 2 – Inputs considered in the composition of unitary costs
Labour Manual Material Projection Manual Equipment Projection
. Official . Hodman . Mixing operator . Elevator operator
. CP 32-II E cement . CH I lime
. Finely washed sand
Dry-mix mortar . Rack and pinion lift . 400 L concrete mixer
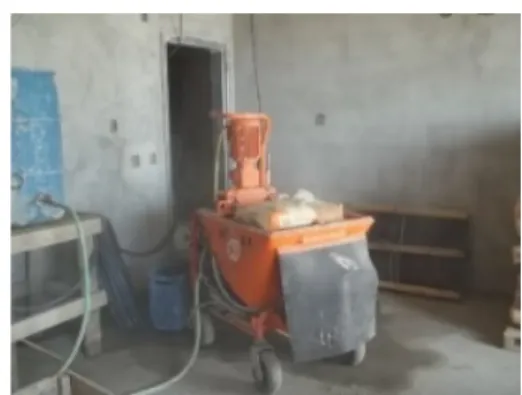
Figure 3 – Sprayer Equipment PFT G4 – construction work B
Figure 4 – Sprayer Equipment BETOMAQ – construction work C
Figure 5 – Water dosage in the mortar – construction work B
Figure 7 – Stock of the dry-mix mortar in the basement
Figure 8 –Unloading mortar with forklift
Figure 9 – Tensile bond test site
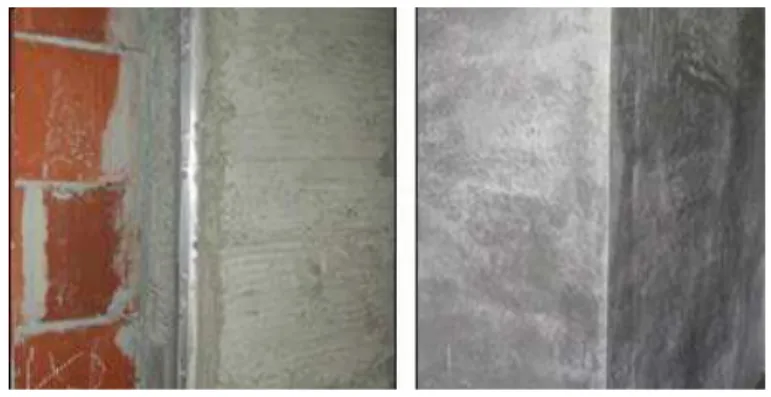
Figure 11 – Thickness of the coating layer
Table 4 - comparison of productive times
Step Manual application Spray system
Operation 10 8
Transportation 24 9
Inspection 6 5
Storage 11 4
Total 51 26
Figure 14 - Lead time and productive time
Productivity of the teams
Figure 15 shows the comparison of productive times for the teams of the three cases studied. The best global productivities can be attributed to the mechanised projection teams B1 and C1. However, in terms of the relation between the UPR of the productive time and the global UPR per team, the A2 team, also from projection, has the best relation - 63%, even presenting one of the worst global UPR values.
Although the team has the best performance in terms of productive times, its composition with 7 employees affected its global productivity as the increase of the team did not increase the rendering area produced in the same proportion. These relationships can be seen in Figure 16.
The relationship between cumulative and potential UPR indicates a percentage loss of team productivity.
The best relation between cumulative and the potential UPR occurs in team C1, where a loss percentage of 12% is observed, showing the best management over the productivity uniformity. Considering only the teams from Company A, which were under the same content and context factors, it is inferred that projection team A1 has the best productivity and the lowest loss percentage in relation to its potential productivity.
These values of potential productivity loss of teams demonstrate the existence of an opportunity to increase the competitiveness of companies in which losses reached values up to 21%.
Consumption of materials and losses
The losses related to materials in the mechanical spraying process are shown in Figure 17, where losses regarding the consumption of dry-mix mortar in relation to two parameters are expressed: the first one is the index recommended by the Brazilian standard NBR 13749 (ABNT, 2003), that is 20 mm for the thickness of mortar internal plastering, and the second is the loss index indicated by the mortar manufacturer of 17 kg/10.7 sqft /cm.
Regarding render thicknesses, teams from Company A did not include losses as their values were below the index recommended by the standards. Team A3, using a manual system, also had a render thicknesses similar to teams A1 and A2. Although the teams from Companies B and C achieved the lowest loss indices in relation to the consumption of mortar indicated by the manufacturer, both teams achieved the highest values of incorporated loss due to the excessive thickness of the rendering layers.
could be even smaller in relation to the consumption indicated by the manufacturer.
Composition of unit costs
To compose the unitary costs, three input groups that form all the cost compositions used in construction services were considered: 1 - Labour, that considered the productivity indices of officers, hodmen, concrete mixer and elevator operators. 2 - Material, that considered the index of real consumption of dry-mix mortar for the mechanical spraying process and the real consumption index of cement, lime and sand for the manual application
process. 3 - Equipment, that includes the rack and pinion lift, besides the mixing and projection equipment or the concrete mixer.
Figure 18 illustrates the comparison of global unit costs per team.
Teams B1 and C1 had the lowest overall unit costs per team, compared to the teams from Company A. This result is directly related to the better labour productivity of the teams from these companies. However, the relation between the inputs (labour, material and equipment) differs among the teams and can be better observed in Figure 19.
Figure 15 – Comparison of the UPRs per team
Figure 17 – Losses related to mortar consumption for the mechanical spraying system teams
Figure 19 - Comparison of the input percentage in the composition of global unit cost s per team
Although teams from Companies B and C had the lowest overall unit cost per team, it can be observed that the material item has a greater weight in their composition of unit cost when compared to the weight of the same input in the compositions from Company A. On average, the material item affects around 26% of the global unit cost of the process per team. The costs related to materials in the compositions of teams B1 and C1 are higher than this level and reach 35%.
On the other hand, even though the teams from Company A had the highest global unit costs per team, their costs were not affected by material, but rather by the labour item. On average, for the projection teams, the labour item affects about 63% of the team’s global unit costs. In the case of the teams from Company A, this item affected above this average, which may be explained by the lower productivity of team A in relation to teams B1 and C1.
Considering only the teams of case study A, which makes a comparison among the teams, it is noted that direct costs are higher than those of mechanised spraying process in relation to the manual application process. This statement is directly related to the dry-mix mortar cost, used for mechanised systems, to be higher than the cost of
Indirect costs
Calculated indirect costs consider activities of construction sites, administration, auxiliary to the administration and consumption of water, energy and telephone. These activities are direct functions of time, i.e. period to complete the construction work. Therefore, indirect costs are related to the production rhythm, as gains or losses of productivity will cause a decrease or increase in the execution of the service, respectively.
of terms and indirect costs considering the productive UPR and the global UPR from teams A1 and A3.
Team productivity directly impacts the time spent on performing the rendering, and consequently, changes the indirect costs. This productivity impact is observed when the productive UPR is used instead of global UPR.
The global UPR includes the times related to logistics and aspects of management that also
generate unproductive times. The productive UPR covers the productive times of the team.
Figure 21 shows the difference in indirect costs due to changes in productivity indicators.
The indirect costs for the mortar spraying system are approximately 50% lower when compared to the manual mortar application system. As indirect costs are proportional to productivity gain, this 50% relation is also noted in the difference between the use of global UPR for the teams´ productive UPR.
Figure 20 – Parameters of the indirect costs analysis
This economy comes from the reduction of the service lead time that has an impact on the total indirect cost of the company.
Global costs
The global costs are the sum of the direct and indirect costs for each rendering system.
To calculate these costs, a sensitivity analysis was performed considering the relation among the parameters: productivity of the team, number of
teams, deadline for the execution of the entire rendering according to productivity, direct and indirect costs related to the deadline and global costs.
Team productivity and the number of teams change the execution time of rendering. By changing the deadline, the indirect and direct costs are also changed, and therefore, the global costs.
For a better understanding of the correlation between these parameters, this sensitivity analysis is shown in Figures 22 and 23.
Figure 22 - Comparison of direct, indirect and global costs per number of teams (Team A1 - spray)
Although the direct cost of team A3 (manual) is lower for any quantity of teams, the indirect cost of team A1 (spray) is lower for any of the simulated situations in terms of the number of teams.
The global costs of the mechanical spraying system remains lower than the manual application system, up to the limit of using 3 teams for the parameters analysed in construction work A. This economy comes from the reduction of the deadline for the service of execution of the plastering, although the direct cost of team A3 (manual) is lower due to the reduced price of the job-site mortar. The productivity is increased due to the projection leading to a reduction of this deadline and, consequently, the indirect costs.
For a single team, the mechanised process saves about 21% compared to the manual process. This difference decreases with the increase of the number of teams that allows a greater production in the construction site and the deadline reduction. The mechanised process remains more viable up to three simultaneous teams, which is a number currently practiced by construction company A for internal mortar plastering.
Analysis of the impacts of logistics
and productivity on costs
Figure 24 and Table 5 show the impact of logistics on productivity using the parameters evaluated in this research.
Figure 24 - Graphical analysis of the relation between logistics and productivity
Table 5 – Summary of the parameters evaluated in this research
Team
URP Global (mh/sf)
Wor-kers Productive UPR Auxiliary UPR Unproduc-tivity
Loss
Produc-tivity
Mortar waste
(rate producer)
Mortar waste (standard
rate) Team A1
Spray 0.0830 7 51.7% 35.5% 12.8% 16 11% -
Team A2
Spray 0.0952 7 62.9% 28.3% 8.8% 19% 26% -
Team A3
Spray 0.1010 5 49.5% 40.6% 9.9% 21% - -
Team B1
Spray 0.0608 5 48.1% 32.9% 19.0% 18% 10% 15%
Team C1
The area highlighted in this chart indicates the productivity improvement potential of the teams, which is around 50% of the global productivity. This potential is related to the auxiliary and unproductive times that are directly impacted by logistic decisions.
The manual application system achieved a lower global productivity among the teams, however the impact of logistics on productivity was similar to the other teams, affecting around 50% of the productivity.
The material and productivity losses reflect different strategies among the cases studied for the projection teams. The projection teams of construction works B and C had better global productivities, however there was a visible loss of material in the excessive thickness of each rendering layer. In projection teams of construction work A there was no incorporated loss of mortar in rendering, however their potential for improvement could be associated with a possible decrease in the number of employees per team.
In order to expand the productivity impact analysis (which reflects the impact of logistics) on costs, the global costs of two processes were compared considering global UPR and the productive UPR. Figure 25 shows an analysis of productivity impact on costs.
When productive UPR was used to compose the global costs of two processes, it was observed how
important logistics impact may affect costs. The productive UPR considers the productive time of the teams, eliminating auxiliary and unproductive times.
In cost simulations of the cases studied, the economic viability of the spray system is plausible when indirect costs are affected up to the limit of 8% of global costs.
When process global cost is calculated based on the productive UPR for both systems, economic viability of the spray system is only possible up to two teams. The production achieved by two teams with a better productivity causes a reduction in the company´s deadline and, consequently, in part of the indirect costs that makes it possible for the mechanised spray system to decrease more quickly over time.
Using productive UPR instead of the global UPR, there was a 50% increase in teams productivity for both systems. This improvement also impacts the deadline around 50% to make the spray system viable.
Considering the use of the global UPR, the spray system remains viable for the production of one team (which reflects an execution period for the rendering of 24 months for case A) up to the limit of three teams (who perform the entire rendering in 8 months). With the incorporation of one more team, the total production reduces the deadline and makes the spray system unfeasible compared to the manual system.
Using the productive UPR, the spray system becomes viable for the production of only one team (which reflects an execution period for the rendering of 12 months for company A) up to the limit of two teams (who will perform the rendering in 6 months). The production of three teams with the productive UPR does not allow the spray system viability compared to the manual system, which also obtains the same 50% increase in its productive UPR compared to the global UPR.
It should be noted that in the case of teams with a productivity lower than that analysed, such as Team A2, whose global productivity is less than 13% and productive UPR below 28% in relation to Team A1, the viability of the mechanised projection system would be affected at this same proportion.
The increase in productivity reflects the impact of logistics on the costs of both systems.
Conclusions
This study aimed to help understand the economic viability of the mortar mechanical projection process, which has proven approval of its performance in the scope of the quality of renderings achieved.
No research that studied the correlations among logistics, productivity and costs for the mortar rendering systems was found, corroborating the originality of the present research.
The logistic bottlenecks study related several influence factors to evaluate the execution process of mortar by mechanical projection, however other factors that may influence this evaluation are: the cost of mortars, choice of horizontal and vertical transport equipment, hiring the service with own or outsourced labour, labour costs, costs of mixing and transport equipment, among others.
From the analyses carried out in case A, which made a direct comparison between the two mortar application systems, performed under the same context conditions (management and environmental aspects) and content (same project and same previous services as masonry, for example), the following conclusions could be inferred:
(a) there is a direct relation between lead time and the global productivity indices among both systems. The lead time of the mechanised process is 18% lower than the manual process and the global productivity of the mechanised system is about 18% higher than the global productivity for the manual process;
(b) regarding logistics, the mechanised spraying process of the mortar achieved 49% fewer activities than the manual application process, and
the transportation activities were the ones with the greatest reduction, corresponding to 63% fewer activities if compared to the manual system; (c) a portion of 35% of the total time corresponds to auxiliary activities, directly linked to logistics. Compared to the manual application system, in which the portion of auxiliary times is about 41%, the MECHANISED system is leaner, including fewer activities related to process inspection and storage; and
(d) the productive UPR/global UPR ratio, which reaches around 50% shows a potential of
utilisation of approximately half of the productive cycle time, which is related to unproductive and auxiliary times.
The study of the mechanised process in the other two cases, B and C, enabled us to understand other aspects concerning logistics impact on the productive process.
Teams B1 and C1, who have 5 employees each, were more efficient in terms of global productivity. As the percentage of productive UPR in relation to the global UPR was similar to the relation from team A1 (around 50%), it is inferred that the better productivity of teams B1 and C1 is possibly due to better management in logistics bottlenecks, such as adequate supply of water and energy, technological control and planning of unloading activities, stock, and mortar distribution, probably due to the vast experience of these companies using this technology.
The greater efficiency of teams B1 and C1 reflected lower global unit costs. However, these costs could be even lower as the material item accounted for 36% of the global cost, which may be associated to the incorporated loss due to excessive thickness of rendering applied (15 to 25% higher than the maximum thickness established by standards). In case of projects with greater density of walls and corners, these losses may affect the viability of the system even more as the cost of dry-mix mortar is higher than the cost of job-site mortar.
While companies B and C had a potential to minimise their costs related to quality control in the execution of walls and control of rendering thicknesses, company A had the potential to improve the adjustment of logistics bottlenecks that may lead to longer unproductive times and up to 21% of labour productivity loss.
corroborates the percentage of productive times in relation to the total time of the productive cycle. This logistics impact on productivity will promote a similar impact on the deadline for the execution of mortar rendering. The deadline reduction allows the indirect costs of the company to decrease and promote the economic viability of mechanised spraying system compared to manual application. Nevertheless, for the cases studied, there was a limit of global costs commitment with the indirect costs up to 8%, which still allows the viability of the spray system. This limit will vary according to the period of the rendering execution.
The viability of mechanised spraying systems, compared to traditional manual application systems, is possible when planning and control strategies are combined that include masonry quality control allowing minimisation of incorporated losses, the choice of the best balance of size of teams, as well as decisions involving transport, supply and distribution of mortar capable of minimising the unproductive times, which are translated into logistics efficiency.
References
ABDOLLAHNEJAD, Z. et al. Mix Design, Properties and Cost Analysis of Fly Ash-Based Geopolymer Foam. Construction and Building Materials, v. 80, n. 1, p.18-30, 2015.
ASSOCIAÇÃO BRASILEIRA DE NORMAS TÉCNICAS. NBR 13749: revestimentos de paredes e tetos de argamassa inorgânicas: especificação. Rio de Janeiro, 2003.
BALLOU, R. H. The Evolution and Future of Logistics and Supply Chain Management. Production, v. 16, n. 3, p. 375-386, 2006. BARNES, R. M. Estudo de Movimentos e Tempos: projeto e medida do trabalho. São Paulo: Edgard Blucher, 1977.
BERNAT-MASO, E. et al. Experimental
Assessment of Textile Reinforced Sprayed Mortar Strengthening System For Brickwork Wallettes. Construction and Building Materials, v. 50, p. 226-236, 2014.
BRAGA, M.; BRITO, J.; VEIGA, R. Incorporation of Fine Concrete Aggregates in Mortars. Construction and Building Materials, v. 36, p. 960-968, 2012.
BRÁS, A.; LEAL, M.; FARIA, P. Cement-Cork Mortars for Thermal Bridges Correction: comparison with cement-EPS mortars performance. Construction and Building Materials, v. 49, p. 315-327, 2013.
CARASEK, H. Avaliação de Resultados do Ensaio de Resistência de Aderência de Revestimentos de Argamassa. Téchne, v. 185, p. 64-69, 2012. CEOTTO, L. H; BANDUK, R. C.; NAKAMURA, E. H. Revestimentos de Argamassas: boas práticas em projeto, execução e avaliação. Porto Alegre: ANTAC, 2005.
DUAILIBE, R. P.; CAVANI, G. de R.; OLIVEIRA, M. C. B. Influência do Tipo de Projeção de Argamassa na Resistência de Aderência a Tração e Permeabilidade à Água. In: SIMPÓSIO BRASILEIRO DE TECNOLOGIA DE ARGAMASSAS, 6., Florianópolis, 2005. Anais ... Florianópolis: UFSC, ANTAC, 2005. FARINHA, C. et al. Reduction of Cement Content in Renderings With Fine Sanitary Ware
Aggregates. Materials and Structures, v. 49, n. 5, p.1605-1618, 2016.
FERRÁNDIZ-MAS, V. et al. Lightweight Mortars Containing Expanded Polystyrene and Paper Sludge Ash. Construction and Building Materials, v. 61, p. 285-292, 2014.
IBRAHIM, M. et al. Building Envelope With a New Aerogel-Based Insulating Rendering: experimental and numerical study, cost analysis, and thickness optimization. Applied Energy, v. 159, p. 490-501, 2015.
KOSKELA, L. An Exploration Towards a Production Theory and Its Application to Construction. Espoo 2000. Technical Research Centre of Finland, VTT Publications 408, 2000. LAGO, T. C. Diretrizes Para a Gestão dos Fluxos Físicos em Canteiros de Obras Proposta Baseada em Estudos de Caso. Porto Alegre. 2000. 152 f. Dissertação (Mestrado em Engenharia Civil) – Escola de Engenharia, Universidade Federal do Rio Grande do Sul, Porto Alegre, 2000. NIU, Y. et al. An SCO-Enabled Logistics and Supply Chain–Management System in Construction. Journal of Construction Engineering and Management, v. 143, n. 3, 2017.
PALIARI, J. C. Método Para Prognóstico da Produtividade da Mão de Obra e Consumo Unitário de Materiais: sistemas prediais hidráulicos. São Paulo, 2008. 661 f. Tese
(Doutorado em Engenharia) – Escola Politécnica, Universidade de São Paulo, São Paulo, 2008. PARAVISI, S. Avaliação de Sistemas de Produção de Revestimentos de Fachada com Aplicação Mecânica e Manual de Argamassa. Porto Alegre. 2008. Dissertação (Mestrado em Engenharia Civil) – Programa de Pós-Graduação em Engenharia Civil, Universidade Federal do Rio Grande do Sul, Porto Alegre, 2008.
POON, C.; KOU, S. Properties of Cementitious Rendering Mortar Prepared With Recycled Fine Aggregates. Journal of Wuhan University of Technology-Materials Science Edition, v. 25, n. 6, p. 1053-1056, 2010.
RAUPP-PEREIRA, F. et al. Potable Water Filtration Sludge: use as set retarder in one-coat plastering mortars. Construction and Building Materials, v. 21, n. 3, p. 646-653, 2007.
SANTOS, A. Método de Intervenção em Obras de Edificações Enfocando o Sistema de
Movimentação e Armazenamento de Materiais: um estudo de caso. Porto Alegre, 1995. 140 f. Dissertação (Mestrado em Engenharia) – Escola de Engenharia, Universidade Federal do Rio Grande do Sul, Porto Alegre, 1995.
SILVA, J.; BRITO, J.; VEIGA, R. Fine Ceramics Replacing Cement in Mortars Partial Replacement of Cement With Fine Ceramics in Rendering Mortars. Materials and Structures, v. 41, n. 8, p. 1333-1344, 2008.
SILVA, L. L. R. Método de Intervenção Para a Melhoria da Eficiência na Execução de Revestimentos de Argamassa de Fachada. São Paulo, 2002. 222f. Dissertação (Mestrado em Engenharia Civil) – Escola Politécnica, Universidade de São Paulo, São Paulo, 2002. SILVA, R. B. et al. Cinzas de Biomassa Geradas na Agroindústria do Cacau: caracterização e uso em substituição ao cimento. Ambiente
Construído, Porto Alegre, v. 15, n. 4, p. 321-334, out./dez. 2015.
SILVA, R. V.; BRITO, J.; DHIR, R. K. Performance of Cementitious Renderings and Masonry Mortars Containing Recycled Aggregates From Construction and Demolition Wastes. Construction and Building Materials, v. 105, p. 400-415, 2016.
SOUZA, A.C. Avaliação em Obra da
Permeabilidade e da Resistência de Aderência de Revestimentos de Argamassa Aplicados em Estruturas de Concreto Armado. Goiânia, 2004. Dissertação (Mestrado em Engenharia Civil) – Escola de Engenharia, Universidade Federal de Goiás, Goiânia, 2004.
SOUZA, U. E. L. Como Aumentar a Eficiência da Mão de Obra: manual de gestão da
produtividade na construção civil. São Paulo: Pini, 2006.
SOUZA, U. E. L. Como Reduzir Perdas nos Canteiros de Obras: manual de gestão do consumo de materiais na construção civil. São Paulo: Pini, 2005.
THOMAS, H. R.; YIAKOUMIS, I. Factor Model of Construction Productivity. Journal of
Construction Engineering and Management, v. 113, n. 4, p. 623-638, 1987.
WANG, W. et al. A Material Flow Analysis (MFA)-Based Potential Analysis of Ecoefficiency Indicators of China's Cement and Cement-Based Materials Industry. Journal of Cleaner
Production, v. 112, p. 787-796, 2016.
YANG, L.; ZHANG, Y.; YAN, Y. Utilization of Original Phosphogypsum as Raw Material for the Preparation of Self-Leveling Mortar. Journal of Cleaner Production, v. 127, p. 204-213, 2016. ZANELATTO, K. C. et al. Avaliação da Influência da Técnica de Execução no
Maria Carolina Gomes de Oliveira Brandstet ter
Escol a de Engenharia Civil e Ambient al | Universidade Feder al de Goiás | Av. Universit ária, 1488, Bloco A, Sal a 12, Set or Universit ário | Goiânia - GO – Brasil | CEP 74605-220 | Tel. : (62) 3209-6543 | E-mail: mariacarolina. brands@gmail . com
Helena Carasek
Escol a de Engenharia Civil e Ambient al | Universidade Feder al de Goiás | Av. Universit ária, 1488, LABITECC, 20 Andar, Set or Universit ário
| Goiânia - GO – Br asil | CEP 74605-220 | Tel . : (62) 3209-6262 | E-mail: hcar asek@gmail. com
Rainiere Siqueira
Escol a de Engenharia Civil e Ambient al | Universidade Feder al de Goiás | Av. Universit ária, 1488, Set or Universit ári o | Goiânia - GO – Brasil | CEP 74605-220 | E-mail : engr ainiere@hot mail. com
Revist a Ambient e Const r uído
Associação Nacional de Tecnol ogia do Ambient e Const ruído Av. Osval do Aranha, 99 - 3º andar, Cent ro