ABSTRACT: Cultivars have to be evaluated under different crop management systems across agro-ecosystems and years using multi-environment trials (MET) before releasing them to the market. Frequently, data collected in METs are arranged according to cultivar (G), manage-ment (M), location, (L) and year (Y) combinations in a four-way G x M x L x Y data table that is highly unbalanced for cultivars across locations and time. Therefore, we present the restricted maximum likelihood method (REML) for linear mixed models (LMM) with a factor analytic var-iance-covariance matrix for assessing cultivar adaptation to crop management systems and environments based on unbalanced datasets. Such a multi-environmental trial system has been in operation in Poland for winter wheat (Triticum aestivum L.) in the form of the Post-registration Variety Testing System (PVTS). This study aimed to illustrate the use of LMM in the analysis of unbalanced four-way G x M x L x Y data. LMM analysis provided adjusted means of grain yield for 51 winter wheat cultivars bred in different regions in Europe, tested across 18 trial locations and seven consecutive cropping seasons in two crop management intensities. The application of the four-way LMM with a factor analytic variance-covariance matrix is a complementary and effective tool for evaluating the unbalanced G x M x L x Y table. Cultivars tested had different adaptive responses to the Polish agro-ecosystems separately for each of the crop management intensities. Wide adaptation in both crop management systems was exhibited by cultivars Mulan and Jenga bred in Germany.
Keywords: crop management, restricted maximum likelihood methods, unbalanced data, winter wheat
There are no proposals of methodology, based on an LMM with more complex variance–covariance matrices for the statistical analysis of an unbalanced G x M x L x Y data table from METs.
This study aimed to illustrate the use of LMM with a complex variance-covariance matrix in the analysis of unbalanced four-way G x M x L x Y data on winter wheat yields from the PVTS. Such a procedure is necessary to properly and comprehensively evaluate adaptive respons-es of cultivars to both environments and crop manage-ment systems based on MET databases containing typi-cally unbalanced, though very valuable, four-way data.
Materials and Methods
Trials and data description
Data on grain yield used in this study came from the PVTS. The entire dataset included up to 139 winter wheat (Triticum aestivum L.) cultivars evaluated in (at most) 18 Cultivar Testing Stations (trial locations) over seven growing seasons from 2004/2005 to 2010/2011. We excluded cultivars tested for time periods shorter than three years and those tested only in one location to provide a sufficiently representative sample of years as a random factor and a reasonable level of location as a fixed factor. As a result of this data preparation, we obtained a four-way G x M x L x Y dataset for the grain yield of 51 cultivars. Cultivars shown in Table 1 repre-sent a genetic variation of agronomic attributes of an advanced winter wheat germplasm in Europe. The culti-vars come from various breeding programs and breeding Warsaw University of Life Sciences/SGGW – Dept. of
Experimental Design and Bioinformatics, Nowoursynowska 159 − 02-776 – Warsaw – Poland.
*Corresponding author <[email protected]>
Edited by: Thomas Kumke
Four-way data analysis within the linear mixed modelling framework
Marcin Studnicki*, Wiesław Mądry, Adriana Derejko, Kinga Noras, Elżbieta Wójcik-Gront
Received September 23, 2014 Accepted April 09, 2015
Introduction
Multi-environment trials (MET) are conducted to investigate cultivar adaptation patterns of cultivars (An-nicchiarico et al., 2010). To deliver essential informa-tion for flexible and cultivar-specific management and environment recommendations, released cultivars have to be evaluated under different crop management sys-tems across locations and years (Loyce et al., 2012). A similar system has been operating in Poland, called the Post-registration Variety Testing System (PVTS). The raw plot data is collected and arranged according to cultivar (G), management (M), location (L), and year (Y) combi-nations in a complex four-way G x M x L x Y data table that is highly unbalanced for cultivars.
Frequently, comparisons among cultivars from unbalanced METs datasets are based on distinguished balanced data subsets (So and Edwards, 2009). Although this approach to cultivar evaluation enables the use of classic statistical methods, it results in a loss of useful information on cultivars. Therefore, linear mixed mod-els (LMM) appear to better handle the unbalanced data. (Piepho, 1998; Smith et al., 2001, 2005).
Table 1 − Description of 51 winter wheat cultivars with the number of trial locations in Polish Post-Registration Variety Testing System across growing seasons (years of harvest) 2005 – 2011.
Culivars registration Year of Country of origin Breeding Company Number of locations by year
2005 2006 2007 2008 2009 2010 2011
Bogatka 2004 PL DANKO Hodowla Roślin sp. z o.o. 18 18 18 18 18 18 18
Finezja 2002 PL DANKO Hodowla Roślin sp. z o.o. 18 18 18 18 18 18 18
Nutka 2001 PL Hodowla Roślin Strzelce sp. z o.o. Grupa IHAR 18 18 18 18 18 18 18
Rapsodia 2003 UK RAGT Seeds Ltd. 18 18 18 18 18 18 18
Smuga 2004 PL DANKO Hodowla Roślin sp. z o.o. 18 18 18 18 18 18 18
Tonacja 2001 PL Hodowla Roślin Strzelce sp. z o.o. Grupa IHAR 18 18 18 18 18 18 18
Fregata 2004 PL Hodowla Roślin Strzelce sp. z o.o. Grupa IHAR 18 18 18 18 3 2 2
Nadobna 2003 PL Poznańska Hodowla Roślin sp. z o.o. 18 18 18 18 18 18 X
Satyna 2004 PL Małopolska Hodowla Roślin-HBP sp. z o.o. 18 18 18 18 18 18 X
Trend 2003 DE KWS Lochow GmbH 18 18 18 18 18 18 X
Dorota 2004 FR RAGT 2n 18 18 18 18 18 X X
Flair 2001 DK Syngenta Seeds B.V. 18 18 18 18 18 X X
Kobiera 2003 PL Małopolska Hodowla Roślin-HBP sp. z o.o. 18 18 18 18 18 X X
Kris 2000 FR RAGT 2n 18 18 18 18 18 X X
Mewa 1998 PL DANKO Hodowla Roślin sp. z o.o. 18 18 18 18 18 X X
Rywalka 2003 PL Hodowla Roślin Strzelce sp. z o.o. Grupa IHAR 18 18 18 18 18 X X
Sukces 2001 PL Hodowla Roślin Strzelce sp. z o.o. Grupa IHAR 18 18 18 18 18 X X
Turnia 2001 PL Małopolska Hodowla Roślin-HBP sp. z o.o. 18 18 18 18 18 X X
Zyta 1999 PL Hodowla Roślin Strzelce sp. z o.o. Grupa IHAR 18 18 18 18 18 X X
Muza 2004 PL Małopolska Hodowla Roślin-HBP sp. z o.o. 18 18 18 18 X X X
Zawisza 2004 PL Hodowla Roślin Smolice sp. z o.o. Grupa IHAR 18 18 18 18 X X X
Kobra Plus 1992 PL Małopolska Hodowla Roślin-HBP sp. z o.o. 18 18 18 2 X X X
Aristos 2004 FR Limagrain Verneuil Holding 18 18 18 X X X X
Kaja 1997 PL Poznańska Hodowla Roślin sp. z o.o. 18 18 18 X X X X
Olivin 2004 FR RAGT 2n 18 18 18 X X X X
Pegassos 2001 DE ILVO Plant Toegepaste Genetica en Veredeling 18 18 18 X X X X
Rubens 2000 DE KWS Lochow GmbH 18 18 18 X X X X
Sława 2001 PL Poznańska Hodowla Roślin sp. z o.o. 18 18 18 X X X X
Soraja 2000 PL Hodowla Roślin Strzelce sp. z o.o. Grupa IHAR 18 18 18 X X X X
Symfonia 1999 PL Hodowla Roślin Strzelce sp. z o.o. Grupa IHAR 18 18 18 X X X X
Sakwa 1996 PL Hodowla Roślin Strzelce sp. z o.o. Grupa IHAR 17 18 18 18 X X X
Legenda 2005 PL Poznańska Hodowla Roślin sp. z o.o. X 18 18 18 18 18 18
Wydma 2005 PL Hodowla Roślin Smolice sp. z o.o. Grupa IHAR X 18 18 18 18 18 18
Alcazar 2006 FR Secobra Recherches X X 18 18 18 18 18
Batuta 2006 PL DANKO Hodowla Roślin sp. z o.o. X X 18 18 18 18 18
Boomer 2006 FR RAGT 2n X X 18 18 18 18 18
Ludwig 2006 AT Saatzucht Donau Ges.m.b.H. & CoKG X X 18 18 18 18 18
Naridana 2006 PL Poznańska Hodowla Roślin sp. z o.o. X X 18 18 18 18 18
Turkis 2006 DE Lantmännen SW Seed Hadmersleben GmbH X X 18 18 18 18 18
Anthus 2006 DE KWS Lochow GmbH X X 18 18 18 18 X
Akteur 2007 DE Deutsche Saatveredelung AG X X X 18 18 18 18
Figura 2007 PL DANKO Hodowla Roślin sp. z o.o. X X X 18 18 18 18
Garantus 2007 FR RAGT 2n X X X 18 18 18 18
Markiza 2007 PL Hodowla Roślin Strzelce sp. z o.o. Grupa IHAR X X X 18 18 18 18
Meteor 2007 DE Lantmännen SW Seed Hadmersleben GmbH X X X 18 18 18 18
Nateja 2007 PL DANKO Hodowla Roślin sp. z o.o. X X X 18 18 18 18
Jenga 2008 DE Nordsaat Saatzucht GmbH Saatzucht Langenstein X X X X 18 18 18
Kohelia 2008 PL Małopolska Hodowla Roślin-HBP sp. z o.o. X X X X 18 18 18
Mulan 2008 DE Nordsaat Saatzucht GmbH Saatzucht Langenstein X X X X 18 18 18
Muszelka 2008 PL DANKO Hodowla Roślin sp. z o.o. X X X X 18 18 18
Ostroga 2008 PL DANKO Hodowla Roślin sp. z o.o. X X X X 18 18 18
companies. A geographical distribution of the 18 Cultivar Testing Stations is presented in Figure 1. These locations were chosen to represent agro-ecological conditions for winter wheat across all regions of Poland.
Winter wheat cultivars were evaluated at two levels of crop management intensity, a moderate-input (MIM) and conventional management (HIM) (Table 2). MIM did not include plant protection treatments and standard fertilization was applied according to the soil needs of a given location. HIM was a high-input treatment designed to maximize yield. It included high nitrogen fertilization combined with frequent fungicide use, foliar fertilization and the application of a growth regulator (trinexapac-eth-yl). This crop management corresponds to the crop man-agement system commonly used in commercial winter wheat production in Poland.
The four-way G x M x L x Y dataset (51 cultivars, 2 managements, 18 locations and 7 years) was unbalanced (Table 1). Only seven cultivars were tested during the en-tire trial period (Table 1). The rest of the cultivars were tested for shorter durations, but the durations were longer than three growing seasons (Piepho et al., 2014). This
out-come was the result of favouring popular cultivars over poorly performing ones. Cultivars included in our dataset were usually assessed at all of the 18 trial locations for a given year. Only a few cultivars (Fregata, Kobra Plus and Sakwa) were not tested in all locations. In the G x M x L x Y data, 8400 combinations (cells) were filled, represent-ing 65 % of all the combinations possible in the balanced classification.
In each location and year, individual trials were established as a two-factor strip-plot (split-block) design with two replications (Mintenko et al., 2002). Within the blocks, the cultivars were arranged in sub-blocks, and the two crop managements in the other sub-blocks were ar-ranged perpendicularly to the sub-blocks with the culti-vars. The plot size (planted) was 16.5 m2 (11 m × 1.5 m) and the plot size harvested was 15 m2 (10 m × 1.5 m).
Statistical methods
For the statistical analysis of the unbalanced grain yield derived from raw G x M x L x Y data, we used a two-stage combined analysis, commonly recommended and practiced in METs (Smith et al., 2005; Möhring and Piepho, 2009). During the first stage, we analysed the data per trial (location-year combination) using a mixed-model ANOVA approach for a strip-plot design, modelling culti-var and management effects as fixed and block and error effects as random (Möhring and Piepho, 2009). The least squares (LS) means for cultivar and management combi-nations were estimated in the routine analyses conducted by the Polish Research Centre for Cultivar Testing (CO-BORU). Then, the LS means were combined across trials and years to obtain an unbalanced G x M x L x Y mean data table.
In the second stage of the combined analysis of the G x M x L x Y data, we used two models utilized for various purposes (Burgueño et al., 2011; Liu et al., 2013). First, the analysis of the LS means was conducted to test the significance of the effects of G, M, L, Y and their in-teractions. Then, an analysis was performed based on LMM as shown below:
Xijkl = m + Yi + Lj + YLij + Gk + GYik + GLjk + GLYijk+
Ml + MYil + MLil + MLYijl + GMkl+ GMYikl + GMLljk +
GMLYijkl (1)
Figure 1 − Trial locations of the PVTS used in seven growing seasons from 2004/2005 to 2010/2011 for winter wheat cultivars.
Table 2 − Characteristics of two crop management intensities, MIM and HIM, included in the winter wheat PVTS.
Crop managements treatments Crop management intensity
MIM HIM
Nitrogen fertilization rate (kg N ha−1) + x N rate for MIM + 40 kg N ha−1
Fungicide use: the first treatment (protection against stalk and leaves diseases) - + Fungicide use: the second treatment (protection against leaves and spike diseases) - +
Growth regulator - +
Foliar compound fertilization - +
the residual, comprising both the interaction between the i-th year l-th crop management intensity and effect of the k-th cultivar at the j-th environment location, the l-th crop management intensity and the i-th year as well as the error term associated with a mean Xijkl; other abbreviations were compatible with equation (1).
For the random effects of cultivars at locations G(L)ki in equation (2), we assumed a factor analytic (FA) structure of the genetic variance-covariance matrix (Smith et al., 2001; Kelly et al., 2007). This variance-covariance structure is a parsimonious form of the fully unstructured variance-covariance matrix (Kelly et al., 2007). It is as flex-ible as the unstructured matrix, but with a smaller number of parameters. The FA models have been considered as giv-ing the best fit for many different datasets, and superior in terms of selection of the best adapted cultivars (Kelly et al., 2007; Burgueño et al., 2011). The factor analytic structure is a decomposition of the unstructured variance-covariance matrix, based on a factor analysis with Cholesky factor-ization (So and Edwards, 2009). For equation (2), we used a factor analytic structure with six components. Piepho (1998) and Kelly et al. (2007) suggested using two compo-nents for the FA model, but their studies were based on GxE datasets with fewer trail locations than in our data.
The best linear unbiased estimators (BLUEs) for the fixed effects of equation (2) and the best linear unbiased predictors (BLUPs) of the random effects in the model were calculated using the REML procedure. These esti-mates were used to calculate the adjusted means for the considered combinations of factors, using the algorithm described by Welham et al. (2004). Traditional methods of pairwise comparisons of means in unbalanced data and a large number of levels of factors are not useful. Decision, where adjusted means differed, was based on confidence intervals, calculated as two times the standard error of the means (Piepho, 2000).
Due to the number of cultivars evaluated in the PVTS, as in other METs, it is difficult to effectively inter-pret and distinguish various adaptive response patterns of these entries. Therefore, the cultivars tested in this study were classified based on their yield response to environ-ments (adjusted means for the G x L combinations). The 51 cultivars were grouped based on adjusted means for grain yield at each location separately for the two crop manage-ment intensities (Curti et al., 2014). Cultivars with simi-lar patterns of response to location were included in the same group. The Ward’s cluster analysis method with the squared Euclidean distance was used for grouping cultivar response to environments (Ward, 1963). The dendrogram was cut when the fusion of groups explained at least 0.8 of the total sum of squares.
For equations (1) and (2), in the second stage of the combined analysis, we assumed homogeneous residual error variances across locations and years. These assump-tions are rather restrictive and may be unrealistic in many MET datasets (Möhring and Piepho, 2009; Hu et al., 2013). However, these assumptions simplify the LMMs and al-low an unweighted two-stage analysis of the considered In which: Xijkl is the LS mean of yield for the
4-fac-torial combination of the i-th year, the j-th (j=1,2, …, J) location, the k-th cultivar and the l-th crop management intensity; m is the general mean; Yi is the random main effect of the i-th year; Lj is the fixed main effect of the j-th location; Gk is the random main effect of the k-th cultivar; Ml is the fixed main effect of the l-th crop management in-tensity; YLij is the random interaction effect of the i-th year and the j-th location; GYki is the random interaction effect of the k-th cultivar and the i-th year; GLkj is the random interaction effect of the k-th cultivar and the j-th location; MYli is the random interaction effect of the l-th crop man-agement intensity and the i-th year; MLlj is the fixed inter-action effect of the l-th crop management intensity and the j-th location; GMkl is the random interaction effect of the k-th cultivar and the l-th crop management intensity; GLYkji is the random interaction effect of the k-th cultivar, the j-th location and the i-th year; GMYkliis the random interaction effect of the k-th cultivar, the l-th crop management inten-sity and the i-th year; GMLklj is the random interaction ef-fect of the k-th cultivar, the l-th crop management intensity and the j-th location; MLYljiis the random interaction effect of the l-th crop management intensity, the j-th location and the i-th year; and GMLYklji is a random residual comprising both the interaction effect of the k-th cultivar, the l-th crop management intensity, the j-th location, the i-th year, and the error term associated with a mean Xijkl.
In this stage of the analysis, the cultivar effects were considered to be random because the cultivars evaluated were considered to be a representative sample of the wide range of genetic and phenotypic diversity in cultivars (germ-plasm population) released recently in Poland and other European countries (Smith et al., 2005; Curti et al., 2014). The locations were assumed to be fixed because they are not truly random samples from a target region and they have a repeatable nature (Virk et al., 2009). The significance of fixed effects in equation (1) was tested with the Wald F test (An-derson et al., 2011). The variance components for random effects were estimated using the restricted maximum likeli-hood (REML) method (Patterson and Thompson, 1971). The likelihood ratio test was used to evaluate the significance of the random effects in equation (1).
Secondly, an analysis of the LS means in the G x M x L x Y table was also conducted to assess cultivar adapta-tion to environment and crop management (estimates of adjusted means for the considered combinations), based on an LMM with some nested effects as follows:
Xijkl = m + Yi + Lj + YLij + G(L)kj + G(L)Ykji + Ml + MYil
+ MLil + MLYijl + G(L)Mkjl+ G(L)MYijkl (2)
data. Two-stage analyses without weighting produced ac-ceptable results in comparison to weighted ones, and, in most cases, performed better (Möhring and Piepho, 2009). Caliński et al. (2005) also advocate using an unweighted approach, based on the randomization theory for analysing METs data. Although the unweighted two-stage analysis will be approximated and can decrease the predictive accu-racy in cultivar evaluation (Möhring and Piepho, 2009; Hu et al., 2013), it is very practical for large sets of four-way data within the mixed modelling framework. Therefore, this analysis can deliver information that is sufficiently ac-curate for making recommendations on released cultivars across agro-ecosystems and crop managements.
The use of LMM for large and unbalanced METs data can be challenging to compute. Equations (1) and (2) were fit using ASReml 3.0, implemented in the R package (ASReml-R). The cluster analysis was performed using the CLUSTER procedure in SAS (Statistical Analysis System, version 9.4).
Results and Discussion
The Wald F test for the fixed effects in equation (1) indicated a statistically significant main effect of crop man-agement (Table 3). Mean yields of genotypes for the two crop management intensities, MIM and HIM, were differ-ent (p < 0.01) and varied from 7.65 t ha−1 and 8.72 t ha−1, respectively. The HIM resulted in an average increase in grain yield of 1.07 t ha−1. This result contrasts to previous studies where no significant yield response to crop man-agement was detected (Liu et al., 2013).
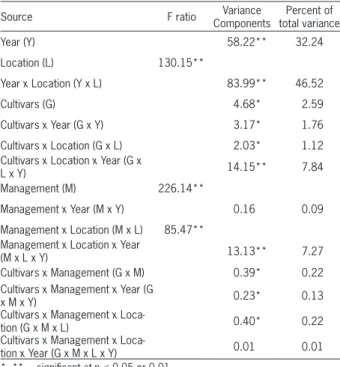
The variance components of the yield for the year and the interaction between year and location were dif-ferent (p < 0.01) from zero and accounted for 79 % of the total yield variation. Similar results were obtained in the study by Anderson et al. (2011) and De Vita et al. (2010). We identified a location effect (p < 0.01) and large variance components for the year and interaction between year and location, suggesting that the agro-ecological conditions in the trials were extremely varied and accounted for most of the yield variation. In our study, similar to Shrestha et al. (2012), grain yield was mainly influenced by the environ-ment. The yield of 51 winter wheat cultivars was highly influenced by environmental factors (location, year and location × year interaction). Burgueño et al. (2011) and Tapley et al. (2013) also observed a much higher value for variance components for environmental effects than for genotypes in their wheat METs. This could be because the environmental effects (location and year) dominated the expression of the interactions between cultivars and man-agement, and the cultivar effects (Anderson et al., 2011).
The interaction between location and crop manage-ment was significant (p < 0.01), and this result indicates a variable response of cultivar yield to the increased intensity of crop management across the test locations. This interac-tion for winter wheat was also observed by Annicchiarico et al. (2010). Figure 2 presents mean yields for the combi-nations of crop managements and locations and illustrates the yield-enhancing effects of increased crop management intensity. Response of cultivars to crop management was significant at 18 locations (significant G x M interaction - Table 3). However, the yield response was not always the same. In most locations, we observed an increase in mean yield when using HIM. At Głębokie, Marianowo, Masłowice, Nowa Wieś Ujska, Pałowice, Świebodzin and Tomaszów, the locations with the lowest mean yield and the one with highest mean yield - Węgrzce, there was no difference (p > 0.05) in yield between the MIM and the HIM crop management intensities. The highest increase in yield was observed for Głupczyce, where the difference be-tween MIM and the HIM was equal to 2.38 t ha−1.
The genotypic differences for grain yield explained only 3 % of the total variation (Table 3). The low varia-tion in cultivar effects may be explained by the fact that the cultivars evaluated in this study are elite and top-yielding genotypes. De Vita et al. (2010) showed that the main genotype effects in a set of durum wheat landraces and advanced breeding lines explained 14 % of the total variation in grain yield. The comparison of grain yield means across years, locations and managements for 51 wheat genotypes is presented in Figure 3. These cultivar means varied from 7.81 t ha−1 for the Fregata cultivar, bred in Poland, to 8.69 t ha−1 for the Mulan cultivar, bred in Germany (an approximately 0.9 t ha−1 difference). The cultivars Jenga and Mulan (marked in dark grey in Figure 3) had higher mean yields (p < 0.05) compared to Fregata, Kobra Plus, Muza, and Olivin cultivars (marked in white in Figure 3). The cultivars marked in grey did not differ from one another.
Table 3 – F ratio for fixed effect and variance components with percentage of total variation for random effects in the linear mixed model (1) from PVTS data set.
Source F ratio Variance
Components
Percent of total variance
Year (Y) 58.22** 32.24
Location (L) 130.15**
Year x Location (Y x L) 83.99** 46.52
Cultivars (G) 4.68* 2.59
Cultivars x Year (G x Y) 3.17* 1.76
Cultivars x Location (G x L) 2.03* 1.12 Cultivars x Location x Year (G x
L x Y) 14.15** 7.84
Management (M) 226.14**
Management x Year (M x Y) 0.16 0.09
Management x Location (M x L) 85.47** Management x Location x Year
(M x L x Y) 13.13** 7.27
Cultivars x Management (G x M) 0.39* 0.22 Cultivars x Management x Year (G
x M x Y) 0.23* 0.13
Cultivars x Management x
Loca-tion (G x M x L) 0.40* 0.22
Cultivars x Management x
The fraction of G x M interaction in the total varia-tion was similar to that of the G x M x Y. Figure 4 shows the positive association between cultivars and crop manage-ment intensities. We found significant G x M interactions (p < 0.05), which is consistent with the finding of Tapley et al. (2013). A small percentage of the total variation for G x M and G x M x Y interactions were detected (Table 3). Thus, this interaction effect was the least important for explain-ing grain yield variation. The G x M interaction indicates that all examined winter wheat cultivars were character-ized by higher mean yields under the more intensive crop management. The differences in mean grain yield among cultivars was 0.76 t ha−1 (from 7.29 to 8.05 t ha−1) for the MIM level and approximately 0.8 t ha−1 (from 8.33 to 9.13 t ha−1) for the HIM level. Fan et al. (2007) also observed a positive response of grain yield in each of the cultivars tested to increased intensity of management.
The variance component for the cultivar × loca-tion interacloca-tion, which is the varialoca-tion in cultivar yield response to the locations tested, was significantly differ-ent from zero. This interaction explained 1 % of the grain yield variation for winter wheat cultivars. Because of the significant variance components for the G x M and G x M x L interactions (Table 3), the adaptive responses of the 51 cultivars to agro-ecosystems are presented separately for both levels of crop management intensity. These in-teractions led to different rankings of cultivars across the environments between cultivars grown under MIM and HIM. To interpret the adaptive responses within the 51 cultivars and to distinguish them based on yield in each location tested, clustering was performed (Loyce et al., 2012). For clustering based on cultivar yield across all locations, we used Ward’s criterion (Ward, 1963). The number (six) of cultivar groups was decided based on the sum of squares (SS) obtained from the G x L adjusted yield mean matrix.
The division of cultivars for both levels of manage-ment intensity is shown in Table 4 and dendrograms are presented in Figures 5A and 5B. The six group yields and their adjusted means across 18 locations for the two levels of management intensity are presented in Figures 6A and 6B. Each group presents similar yield respons-es across all agricultural environments trespons-ested. Overall, there were no apparent indications that environment was strongly associated with the significance of interac-tions between cultivars and crop management. The six groups earmarked for MIM explained 83 % of the total sum of squares for the yield response of cultivars (Fig-ure 5A). Jenga and Mulan from group 1 had the high-est yields in all thigh-ested environments for the MIM level. These cultivars were identified as being well adapted to lower, medium and higher yielding locations. These ad-aptations were consistent under both crop management intensities.
Figure 3 – Grain yield of winter wheat cultivars averaged across two levels of crop management intensity, 18 locations and seven growing seasons (bars show the confidence interval of adjusted means).
Cultivars included in group 2 were the second high-est yielding for the MIM level. Group 3 included 16 culti-vars and their yields were nearly the same as the environ-mental means and were stable in different environments. Group 4 contained 12 cultivars from various countries and breeding companies. Their yields were lower than the en-vironmental means in most of the agro-ecosystems tested. Seven cultivars belonging to group 5 showed a stable per-formance of yield in different agro-ecosystems and lack of adaptation for all of them. Their yields were the lowest in 10 of the 18 locations. The two wheat cultivars from group
6 (Fregata bred in Poland and Olivin bred in France) exhib-ited a lack of adaptation for all locations and an unstable yield in different agricultural environments of Poland.
There were also six groups of cultivars distinguished for the higher intensity of agricultural management. The cultivar groups accounted for 81 % of the SS of the GxL adjusted mean yield matrix (Figure 5B). The content of al-most all groups was similar to that corresponding to the MIM level. Group 1 included two cultivars that had yields which were stable and widely adapted to Polish agro-eco-systems. Their yields were the highest at all locations
stud-Figure 4 –Yield response of 51 winter wheat cultivars to two crop management intensities averaged across 18 environments and seven growing seasons (bars show the confidence interval of adjusted means).
Table 4 –Groups of winter wheat cultivars with a similar grain yield response across 18 environments in Poland for MIM and HIM crop management intensities.
Group 1 Group 2 Group 3 Group 4 Group 5 Group 6
MIM HIM MIM HIM MIM HIM MIM HIM MIM HIM MIM HIM
Jenga Jenga Batuta Alcazar Akteur Akteur Dorota Dorota Kobiera Batuta Fregata Fregata
Mulan Mulan Bogatka Anthus Alcazar Aristos Finezja Kaja Kobraplus Bogatka Olivin Kobiera
Boomer Finezja Anthus Figura Kaja Mewa Muza Boomer Kobraplus
Garantus Legenda Aristos Flair Mewa Sakwa Rubens Garantus Muza
Ludwig Naridana Figura Kris Sakwa Soraja Rywalka Kohelia Olivin
Markiza Nateja Flair Meteor Smuga Sukces Slawa Ludwig Rubens
Meteor Pegassos Kohelia Ostroga Soraja Symfonia Zyta Markiza Rywalka
Muszelka Satyna Kris Sukces Turnia Muszelka Slawa
Nutka Smuga Legenda Symfonia Wydma Nadobna Zyta
Ostroga Tonacja Nadobna Turnia Zawisza Nutka
Rapsodia Turkis Naridana Wydma Rapsodia
Trend Nateja Zawisza Trend
Pegassos
Satyna
Tonacja
Turkis
ied. This group’s content was the same as in the case of group 1 for MIM management. Cultivars Mulan and Jenga, bred in Germany and Poland, exhibited a wide adaptation to Polish agro-ecosystems under both crop managements.
Unstable yields were demonstrated by group 2, which contained 11 winter wheat cultivars. Cultivars in-cluded in this group had the second highest yields in almost all tested environments, but had relatively yields in Nowa Wieś Ujska and Wyczechy (lower yielding environments). The seven cultivars from group 3 were characterized by unstable yield performance. Five cultivars were the same in group 3 for both MIM and HIM levels. Group 3, for the MIM level, contained cultivars with very stable grain yields, in contrast to those for the HIM level. Group 4 contained 10 winter wheat cultivars and the group yield was the same as the average yield in all environments studied. Cultivars included in group 4 for MIM and HIM levels were almost identical, but their adaptive response was different.
Group 5, containing 12 cultivars, showed a lack of adaptation to agricultural environments of Poland. This group had the second lowest yield in comparison with other groups. Nine cultivars included in group 6 had an unstable performance for yield and a lack of adaptation for each test-ed Polish agro-ecosystem. This group had lower grain yields than any other group. Two of the cultivars from group 6 for the HIM level belonged to group 6 for the MIM level, and the rest to 5. A comparison of the mean-group yield (Figure 6A and 6B) between the two crop management intensities suggested that there can be a selection of cultivar lines with broad adaptation to both management intensities (Cooper et al., 2001). Based on G x M and G x M x L interactions, there was a different ranking of the cultivars belonging to group 1 than those belonging to the other groups.
The application of the four-way LMM with a factor analytic variance-covariance matrix, methods of pairwise comparisons and cluster analysis are complementary and effective tools for evaluating an unbalanced G x M x L x Y table. The analysis of experiments designed to examine combinations of Y, L, G and M can also provide evidence of the relative importance of each of these factors for grain yield. ASReml 3.0 proved to be an effective tool for computing the LMM with a factor analytic variance-cova-riance matrix for an unbalanced G x M x L x Y dataset.
Figure 5 –Dendrogram based on the yield response of 51 winter wheat cultivars to 18 environments for A) MIM crop management intensity, and B) HIM crop management intensity.
The winter wheat cultivars evaluated from the PVTS dataset yielded similar results for both crop man-agements. The range of the cultivar grain yield means var-ied from 8.37 to 9.13 t ha−1. During the growing seasons studied, the 51 wheat cultivar yields tested responded differently to different agro-ecosystems in Poland. Their adaptive responses depended on the crop management intensity. Wide adaptation for both crop management systems was exhibited by Mulan and Jenga in all environ-ments; they had the highest yield.
Acknowledgements
To the Polish Research Centre for Cultivar Testing (COBORU) and to Prof. E. Gacek, for providing winter wheat yield observations from the PVTS.
References
Anderson, W.K.; Burgel, A.J. van; Sharma, D.L.; Shackley, B.J.; Zaicou-Kunesch, C.M.; Miyan, M.S.; Amjad, M. 2011. Assessing specific agronomic responses of wheat cultivars in a winter rainfall environment. Crop and Pasture Sciences62: 115–124. Annicchiarico, P.; Chiapparino, E.; Perenzin, M. 2010. Response
of common wheat varieties to organic and conventional production systems across Italian locations, and implications for selection. Field Crops Research 116: 230–238.
Burgueño, J.; Crossa, J.; Cotes, J.M.; Vicente, F.S.; Das, B. 2011. Prediction assessment of linear mixed models for multi environment trials. Crop Science 51: 944–954.
Caliński, T.; Czajka, S.; Kaczmarek, Z.; Krajewski, P.; Pilarczyk, W. 2005. Analyzing multi-environment variety trials using randomization-derived mixed models. Biometrics 61: 448–455. Cooper, M.; Woodruff, D.R.; Phillips, I.G.; Basford, K.E.; Gilmour,
A.R. 2001. Genotype-by-management interactions for grain yield and grain protein concentration of wheat. Field Crops Research 69: 47–67.
Curti, R.N.; Vega, A.J. de la; Andrade, A.J.; Bramardi, S.J.; Bertero, H.D. 2014. Multi-environmental evaluation for grain yield and its physiological determinants of quinoa genotypes across Northwest Argentina. Field Crops Research 166: 46–57. De Vita, P.; Mastrangelo, A.M.; Matteu, L.; Mazzucotelli, E.; Virzi,
N.; Palumbo, M.; Lo Storto, M.; Rizza, F.; Cattivelli, L. 2010. Genetic improvement effects on yield stability in durum wheat genotypes grown in Italy. Field Crops Research 119: 68–77. Fan, X.M.; Kang, M.S.; Chen, H.; Zhang, Y.; Tan, J.; Xu, C. 2007.
Yield stability of maize hybrids evaluated in multi-environment trials in Yunnan, China. Agronomy Journal 99: 220–228. Hu, X.; Yan, S.; Shen, K. 2013. Heterogeneity of error variance
and its influence on genotype comparison in multi-location trials. Field Crops Research 149: 322–328.
Kelly, A.M.; Smith, A.B.; Eccleston, J.A.; Cullis, B.R. 2007. The accuracy of varietal selection using factor analytic models for multi-environment plant breeding trials. Crop Science 47: 1063–1070. Liu, S.M.; Constable, G.A.; Reid, P.E.; Stiller, W.N.; Cullis, B.R.
2013. The interaction between breeding and crop management in improved cotton yield. Field Crops Research 148: 49–60.
Loyce, C.; Meynard, J.M.; Bouchard, C.; Rolland, B.; Lonnet, P.; Bataillon, P.; Bernicot, M.H.; Bonnefoy, M.; Charrier, X.; Debote, B.; Demarquet, T.; Duperrier, B.; Felix, I.; Hedddadj, D.; Leblanc, O.; Leleu, M.; Mangin, P.; Meausoone, M.; Doussinault, G. 2012. Growing winter wheat cultivars under different management intensities in France: a multi-criteria assessment based on economic, energetic and environmental indicators. Field Crops Research 125: 167–178.
Mintenko, A.S.; Smith, S.R.; Cattani, D.J. 2002. Turfgrass evaluation of native grasses for the Northern Great Plains Region. Crop Science 42: 2018–2024.
Möhring, J.; Piepho, H.P. 2009. Comparison of weighting in two-stage analyses of series of experiments. Crop Science 49: 1977–1988.
Patterson, H.D.; Thompson, R. 1971. Recovery of inter-block information when block sizes are unequal. Biometrika 58: 545–554.
Piepho, H.P. 1998. Empirical best linear unbiased prediction in cultivar trials using factor analytic variance-covariance structures. Theoretical and Applied Genetics 97: 195–201. Piepho, H.P. 2000. Multiple treatment comparisons in linear
models when the standard error of a difference is not constant. Biometrical Journal 42: 823–835.
Piepho, H.P.; Laidig, F.; Drobek, T.; Meyer, U. 2014. Dissecting genetic and non-genetic sources of long-term yield trend in German official variety trials. Theoretical and Applied Genetics 127: 1009–1018.
Shrestha, S.; Asch, F.; Dusserre, J.; Ramanantsoanirina, A.; Brueck, H. 2012. Climate effects on yield components as affected by genotypic responses to variable environmental conditions in upland rice systems at different altitudes. Field Crops Research 134: 216–228.
Smith, A.B.; Cullis, B.R.; Thompson, R. 2001. Analyzing variety by environment data using multiplicative mixed models and adjustments for spatial field trend. Biometrics 57: 1138–1147. Smith, A.B.; Cullis, B.R.; Thompson, R. 2005. The analysis of crop
cultivar breeding and evaluation trials: an overview of current mixed model approaches. Journal of Agricultural Science 143: 1–14.
So, Y.; Edwards, J. 2009. A comparison of mixed-model analyses of the Iowa Crop Performance Test for Corn. Crop Science 49: 1593–1601.
Tapley, M.; Ortiz, B.V.; Santen, E. van; Balkcom, K.S.; Mask, P.; Weaver, D.B. 2013. Location, seeding date, and variety interactions on winter wheat yield in Southeastern United States. Agronomy Journal 105: 509–518.
Virk, D.S.; Pandit, D.B.; Sufian, M.A.; Ahmed, F.; Siddique, M.A.; Samad, M.A.; Rahman, M.M.; Islam, M.M.; Ortiz-Ferrara, G.; Joshi, K.D.; Witcombe, J.R. 2009. REML is an effective analysis for mixed modelling of unbalanced on-farm varietal trials. Experimental Agriculture 45: 77–91.
Ward, J.H. 1963. Hierarchical grouping to optimize an objective function. Journal of the American Statistical Association 58:236–244.