Tuberculosis in t he t went iet h cent ury:
t ime-series mort alit y in São Paulo,
Brazil, 1900-97
A tub e rc ulo se atravé s d o sé c ulo :
sé rie s te mp o rais p ara a mo rtalid ad e
e m São Paulo , Brasil, 1900-97
1 Faculdade de Odontologia, Universidade de São Paulo. Av. Prof. Lineu Prestes 2227, São Paulo, SP
05508-900, Brasil. [email protected] 2 Faculdade de Saúde Pública, Universidade de São Paulo. Av. Dr. Arnaldo 715, São Paulo, SP 01246-904, Brasil. [email protected]
José Leopoldo Ferreira Antunes 1 Eliseu Alves Waldman 2
Abst ract The objective of this study was to characterize tuberculosis mortality trends in the Municipality of São Paulo, Brazil, from 1900 to 1997. Standardized tuberculosis mortality rates and proportional mortality ratios were calculated and stratified by gender and age group based on data provided by government agencies. These measures were submitted to time-series analy-sis. We verified distinct trends: high mortality and a stationary trend from 1900 to 1945, a heavy reduction in mortality (7.41% per year) from 1945 to 1985, and a resumption of increased mor-tality (4.08% per year) from 1985 to 1995. In 1996 and 1997 we observed a drop in tuberculosis mortality rates, which may be indicating a new downward trend for the disease. The period from 1945 to 1985 witnessed a real reduction in tuberculosis, brought about by social improvements, the introduction of therapeutic resources, and expansion of health services. Recrudescence of tu-berculosis mortality from 1985 to 1995 may reflect the increasing prevalence of Mycobacterium
and HIV co-infection, besides loss of quality in specific health programs.
Key words Tuberculosis; Mortality; Time Series; Epidemiology
Resumo Com o objetivo de caracterizar tendências da mortalidade por tuberculose no Municí-pio de São Paulo, Brasil, 1900-1997, foram calculados e estratificados por gênero e grupo etário os coeficientes padronizados de mortalidade e as razões de mortalidade proporcional, por inter-médio de dados providos por agências governamentais. Esxas medidas foram ainda submetidas à análise de séries temporais. Foram verificadas diferentes tendências: de 1900 a 1945, alta mor-talidade e tendência estacionária; de 1945 a 1985, forte redução na mormor-talidade (7,41% por ano); e de 1985 a 1995, retomada do crescimento da mortalidade (4,08% por ano). Em 1996 e 1997, a redução observada nos coeficientes de mortalidade pode estar indicando um novo perfil descen-dente para a enfermidade. Os anos de 1945 a 1985 marcaram período de acentuada queda para a tuberculose, produzida por melhorias sociais, pela introdução de recursos terapêuticos e pela ampliação da cobertura dos serviços de saúde. O recrudescimento da tuberculose, de 1985 a 1995, pode estar refletindo a crescente prevalência da co-infecção por Mycobacteriume por HIV, além da virtual perda de qualidade em programas específicos de controle da endemia.
Introduction
“Brazilians are spitting less, I would say. As for our women, they don’t even spit at all. However, in the days of cutaway coats and corsets, people in the city expectorated much more. I remember the old bronchitis, the coughing of long ago, the nostalgic asthma. In Belle Époque drawing rooms there was an obligatory ornamental fig-ure – the porcelain spittoon decorated with
flow-ers in relief (and colored petals)”(Rodrigues,
1995:17).
The quote emphasizes an almost forgotten cultural aspect of the ubiquitous presence of tuberculosis in the larger Brazilian towns in the early 20th century. The presence of spittoons in public places harks to a time when the risk of contagion was so great that everyone worried about the transmission of bacilli through freely eliminated sputum. Furthermore, the chroni-cler reflects the great change in the profile of urban dissemination of tuberculosis in Brazil, with a heavy reduction of indicators for the dis-ease from the mid-century onward, as con-firmed by the mortality rates calculated in the present study.
Since the early 1980s the increased dis-semination of tuberculosis, especially in Asia and Africa, led the World Health Organization (WHO, 1993) to declare the disease a global emergency. Folley & Miller (1993) stated that the white plague was on the rise and were the first to record its association with AIDS in Eu-rope. In the United States, since 1989, the Advi-sory Committee for the Elimination of Tuber-culosis has recommended that HIV-infected individuals be screened for tuberculosis and la-tent tuberculosis infection. In addition, indi-viduals with tuberculosis or a positive tuber-culin skin test should be evaluated for HIV in-fection to allow for appropriate counseling and treatment (CDC, 1993). At present, as deaths from tuberculosis continues to increase world-wide, the WHO (1996, 1997) has emphasized the importance of local studies and measures in the global fight against the disease. Howev-er, in most developing countries there are no studies drawing on available data to evaluate the disease’s magnitude.
São Paulo was the first city in Latin America to develop an industrial base, subsidized by the State’s affluent coffee-growing market. Concen-tration on single cash-crop agriculture fueled urban growth: people were forced to move to the cities to survive, since foodstuffs were no longer produced on the farms. Booming indus-try and trade attracted two major migratory waves to the cities in search of better living
con-ditions. Europeans and Asians made up the first wave, from the late 19th century to the mid-1930s; the second wave, after the late 1920s, brought people from poorer areas of the coun-try, mainly the Northeast. Civil registries and censuses from these periods recorded such de-mographic shifts in a reasonably regular and re-liable manner. Moreover, these data files have not yet been sufficiently explored for public health studies.
We contend that the data generated by recording and interpreting demographic trends associated with tuberculosis can help control the disease and its recent recrudescence in Brazil. We are confident that such information can also help prevent the revival of the social fears that used to be associated with the use of spittoons in large Brazilian cities.
The purpose of this study was to character-ize trends in tuberculosis mortality in order to reconstitute the history of the disease in the municipality of São Paulo, Brazil, for the period from 1900 to 1997. Another objective was to highlight the usefulness of applying time-se-ries methodology to relevant measures in the health field.
M et hods and dat a sources
a) Dat a sources
We surveyed the General Population Censuses from 1890, 1900, 1920, 1940, 1950, 1960, 1970, 1980, and 1991, published by the Brazilian In-stitute of Geography and Statistics (IBGE), as well as the 1934 São Paulo State Census and the 1996 Population Count. Based on these data, we estimated the population of the municipal-ity of São Paulo year by year, adjusted to the middle of each period ( July 1), in order to cal-culate the relevant population rates. Mortality data were collected from the Statistical Year-books. However, due to the irregular publica-tion of this informapublica-tion, we were forced to re-trieve original registers kept on file at the São Paulo State Data Analysis and Statistics System. When working with civil registries, a critical examination of sources is necessary, since sev-eral types of errors can be associated as factors in mortality statistics in the study period.
of error, Mascarenhas (1949a, 1949b, 1950) pro-posed using the proportion of deaths due to ill-defined causes as an indicator of quality in the death registration service. Observation of this indicator’s temporal evolution suggests three different consecutive periods. The first, from 1900 to 1930, with higher proportions, showed a mean ratio close to 6%, with higher values at times, reaching 10% for the first years of the century. The second, from 1930 to 1960, showed a sharp drop in this indicator, with a mean of about 0.7%. In contrast, the third period, from 1960 onward, indicated a slight rise in the mean parameter to about 2%, with lower val-ues for the more recent period.
Second, the occurrence of a sharp “mortali-ty invasion” is posited, whereby the State Capi-tal, with its greater supply of medical care facil-ities, attracted tuberculosis patients from near-by municipalities. As a quantitative indication of this “mortality invasion”, Nussenzveig & Certain (1953) observed that 11.62% of deaths from tuberculosis in the municipality of São Paulo in 1946 were non-residents. This ratio was estimated at 11.27% in 1947 and 10.14% in 1948. However, beginning in the 1970s this source of error became irrelevant, since the system began recording deaths by place of res-idence.
Third, population growth in the city was not progressive during the inter-census peri-ods, as one would be led to believe by the pop-ulation estimates employed for analysis, since large neighboring townships were either incor-porated into the city over the course of the years, (e.g., Santo Amaro in 1934) or split off (e.g., Osasco in 1958).
Despite the above provisos, this study at-tempts to systematically arrange existing data while it is still available, emphasizing the effort made each year to gather it and keeping in mind that the natural deterioration of printed matter may prevent further similar surveys in the near future. The study is thus based on the premise that despite the above-mentioned limitations, existing data help identify general trends in the study measures. Moreover, records kept in the past allow for a dialogue with the specialized literature devoted to this topic over the course of this century.
b) M et hods
The time-series for pulmonary tuberculosis mortality rates and ratios were delineated, as were the time-series for extrapulmonary tuber-culosis mortality rates. Mortality rates were stratified by both gender and four age groups
(under 5 years, 5-19 years, 20-49 years, and 50 years or older) in order to better characterize the disease’s epidemiological profile. Mortality rates and ratios were calculated and standard-ized by conventional biostatistical methods, as described by Daniel (1995) and Zar (1996). In-dividuals aged 5 to 19 years were not highlight-ed in this study because of their heterogeneous death profile, with low measures for the group aged 5 to 14 years and intermediately high val-ues for individuals aged 15 to 19 years.
Statistical processing of time-series was performed using the SPSS 8.0–1997 software. Measurements were first plotted for a visual determination of their time behavior and then log transformed to reduce the heteroscedastic-ity (non-uniform pattern of variation) present in the original series. For local determination of the stationary, increasing, or decreasing trend of the measures we performed general-ized least squares regression analysis. We also delineated the correlogram of the time-series studied, which both confirmed its structural trend and helped to determine the intensity of the autoregressive movement present in each sequence.
To estimate the regression parameters with control of first-order autocorrelation, we used the Cochrane-Orcutt procedure, according to the methodology described by Johnston (1991). For configuration of the time-series models with control of higher order autocorrelation, we used generalized least squares regression analysis, as described by Hamilton (1994). For the tuberculosis death rate forecast we used the method of Box and Jenkins, Autoregressive Integrated Moving Average – ARIMA (1,1,1) model – as described by several authors, such as Hamilton (1994), Gaynor & Kirkpatrick (1994), and Harvey (1993).
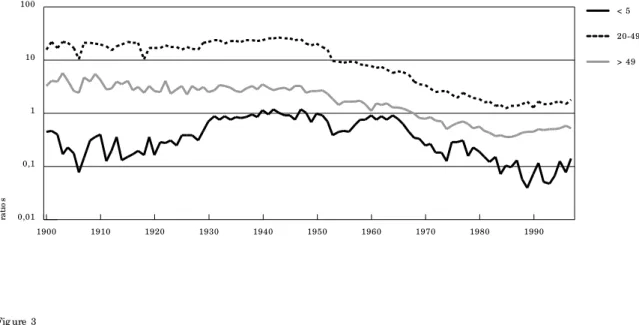
Figure 2 shows the time-series for the pro-portional mortality ratio due to pulmonary tu-berculosis, stratified by age group. Figure 3 shows the shifting age structure of pulmonary tuberculosis deaths in São Paulo throughout the century.
Visual inspection of the trends highlights the increasing participation of the oldest age group in tuberculosis deaths after the 1930s. In contrast, the 20-49-year age group only de-creased until the early 1980s, when it rebound-ed to an increasing share in tuberculosis deaths. As for the youngest age group, graphic display indicates increasing shares in the 1950s and 60s, with a later decrease. We also verified a suggestive acceleration of the descending trend in mortality for this age group, a fact that may be interpreted as a favorable indica-tor of intradermal BCG vaccination. From 1964 to 1976, the ratio of yearly decrease reached -9.463% (95% CI: -16.912/-1.346), while during the following period, from 1976 to 1985, it was -18.159% (95% CI: -20.423/-15.831).
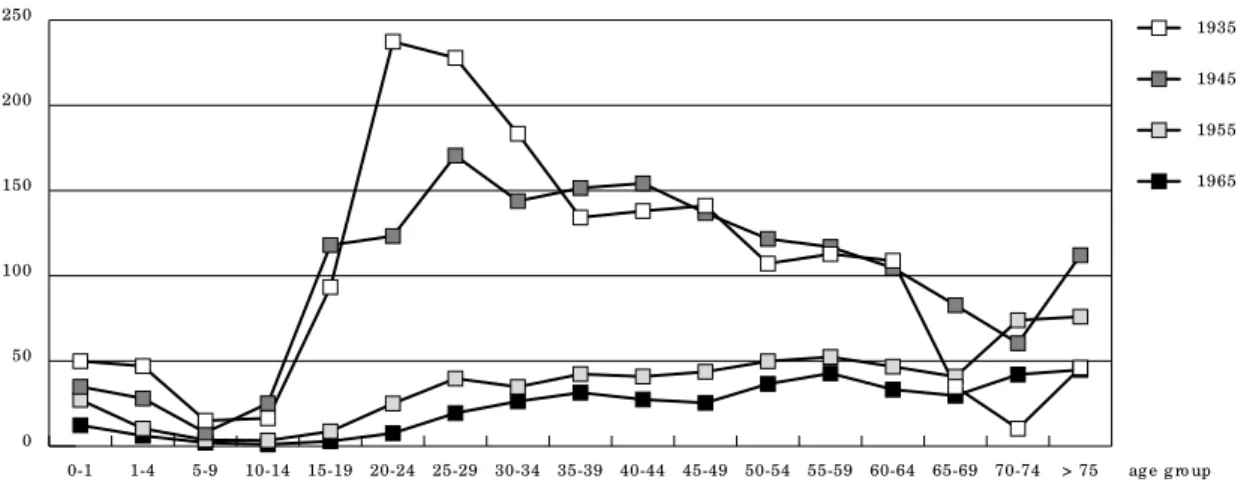
Figures 4a and 4b show age-specific pul-monary tuberculosis mortality rates for select-ed years: 1935, 1945, 1955, 1965, 1975, 1985, and 1995. The graph illustrates the high social cost of tuberculosis mortality, since rates for the adult age group remained almost as high as those for elderly people over time. It should al-so be emphasized that in 1995, rates for the 20-49-year age group were greater than those recorded in 1985, once again reflecting the im-pact of HIV co-infection.
Finally, Table 5 shows the time-series analy-sis for pulmonary tuberculoanaly-sis mortality rates, with measures stratified by gender and age group to elucidate the disease’s epidemiologi-cal profile. For each period, gender, and age group, the table indicates the ratios of yearly increase or decrease in tuberculosis mortality, as estimated by the Cochrane-Orcutt proce-dure of generalized least squares regression analysis. It also states in table form the mean, minimum and maximum values for each time-series segment.
Discussion
Log transformation of original measures is a conventional tool used to reduce heteroscedas-ticity in the decimal linear scaled series, as shown in the upper right in Figure 1 (the for-mer period, with higher values, also displays greater variance in the measure). Besides, us-ing this data transformation, one can easily de-duce ratios of yearly increase or decrease for
Result s
Tuberculosis mortality followed three reason-ably uniform patterns over the course of the century in the municipality of São Paulo: ex-cessively high mortality and a stationary trend between 1900 and 1945, a marked decline of 7.41% per year from 1945 to 1985, and a strong inflection of this tendency between 1985 and 1995, with an exponential growth of 4.08% per year. In the last two years (1996 and 1997), the observed decline in tuberculosis mortality rates may indicate a new downward trend for the disease in the city.
Figure 1 shows the time-series for all forms of tuberculosis mortality rates (in decimal and log linear scales) in the municipality of São Paulo from 1900 to 1997, after standardization of the age distribution recorded in the 1996 Population Count. Figure 1 also shows the trend forecast for 1998-2002 (ex anteforecast) and the trend forecast before the reverse of the de-creasing trend in the mid-century (1986-97 ex postforecast) obtained by ARIMA in an effort to visually emphasize the excess tuberculosis mortality in recent years.
Tables 1 and 2 show the estimates of gener-alized least squares regression analysis for the time-series delineated, before and after log transformation of original values for each peri-od shown by the partial trends indicated.
Forecast analysis of standardized tubercu-losis mortality rates was performed by diagno-sis of an ARIMA (1,1,1) model, whose estimates and closeness-of-fit indicators are shown in Table 3. Reliability of prognosis can also be ver-ified on the basis of forecasts made for the ex postperiod (Table 4). As indicated by visual in-spection of the time-series, one may state, rely-ing upon the computed forecasts, that tuber-culosis mortality will acquire a new profile of declining rates (-4.07% per year) or at least sta-bilize in the immediate future, although at a significantly higher level than in the early 1980s.
0
ra
te
s
10 100 1000
me asure s
e x p o st fo re cast
e x ante fo re cast
2000 1990 1980 1970 1960 1950 1940 1930 1920 1910 1900 0 50 100 150
200 me asure s
1990 1975
1960 1945
1930 1915
1900 Fig ure 1
Time -se rie s fo r stand ard ize d tub e rc ulo sis mo rtality rate (all fo rms, lo g sc ale , p e r 100,000 inhab itants) in São Paulo ,
Brazil: 1900-97, ARIMA (0,1,1)-e x p o st rate fo re c ast (1986-97) and ARIMA (1,1,1) e x ante rate fo re c ast (1998-2002).
At to p , me asure s in a line ar sc ale (1900-97).
the respective mortality values, as presented in Tables 2 and 5. Log transformation also im-proves visual characterization of the stationary trend of values throughout the former period (1900-45). As for the period with a downward trend, from 1945 to 1985, which appeared to be divided into two linear stages (1945-53, with a major decrease, and 1954-85, with less marked reduction of values), log transformation shows that this is a model of exponential decrease with remarkably better indicators of goodness-of-fit to the generalized least squares regres-sion analysis. Finally, for 1985 to 1995, log transformation improves visual
characteriza-tion of the local trend of a strong and exponen-tial increase in the rates.
correlo-Tab le 1
Time -se rie s analysis fo r stand ard ize d tub e rc ulo sis mo rtality rate s (all fo rms, line ar sc ale , p e r 100,000 inhab itants)
in São Paulo , Brazil, 1900-97. G e ne ralize d le ast sq uare s re g re ssio n e stimate s.
Period 1900-20 1921-45 1900-45 1945-53 1953-85 1985-97
Tre nd statio nary statio nary statio nary d e c re ase d e c re ase inc re ase
b1(ye ar-1900) -1.256 0.040 -0.121 -10.239 -0.832 0.238
stand ard e rro r b1 0.900 0.224 0.231 1.250 0.209 0.039
p b1 p = 0.181 p = 0.860 p = 0.603 p < 0.001 p < 0.001 p < 0.001
b0(inte rc e p t) 152.296 136.135 140.289 589.801 73.570 -15.464
stand ard e rro r b0 11.326 7.683 6.273 61.917 16.152 3.540
p b0 p < 0.001 p < 0.001 p < 0.001 p < 0.001 p < 0.001 p < 0.01
R2 0.103 0.002 0.007 0.818 0.354 0.841
R2ad juste d -0.003 -0.094 -0.041 0.801 0.309 0.795
F 1.449 13.907 11.469 65.443 184.851 86.241
Stand ard e rro r 13.727 7.062 10.485 8.098 1.307 0.401
Durb in-Watso n 1.611 1.915 1.714 1.632 1.887 1.847
Tab le 2
Time -se rie s fo r stand ard ize d tub e rc ulo sis mo rtality rate s (all fo rms, natural lo g sc ale , p e r 100,000 inhab itants),
São Paulo , Brazil, 1900-97, and ARIMA (1,1,1) e x ante fo re c ast, 1998-2002. Ratio s o f ye arly inc re ase (p e rc e ntag e )
and 95% c o nfid e nc e inte rvals we re e stimate d b y the Co c hrane -O rc utt re g re ssio n analysis p ro c e d ure , with me an,
maximum, and minimum rate s (d e c imal line ar sc ale ) fo r e ac h p e rio d .
Period 1900–1945 1945–1985 1985–1995 1995–2002*
Tre nd statio nary d e c re ase inc re ase d e c re ase
b1(ye ar-1900) 7.722x10⁻⁴ -7.703x10⁻² 3.994x10⁻² -4.152x10⁻²
stand ard e rro r b1 1.600x10⁻³ 5.446x10⁻³ 8.094x10⁻³ 7.857x10⁻³
p b1 p = 0.632 p < 0.001 p < 0.01 p < 0.01
b0(inte rc e p t) 4.939 8.004 -1.819 5.888
stand ard e rro r b0 4.348x10⁻² 3.789x10⁻¹ 7.332x10⁻¹ 7.742x10⁻¹
p b0 p < 0.001 p < 0.001 p < 0.05 p < 0.01
Ratio o f e arly inc re ase + 0.077% -7.414% + 4.075% -4.067%
95% c o nfid e nc e inte rval -0.245/ + 0.400 -8.429/ -6.388 + 2.187/ + 5.998 -5.894/ -2.205
Me an 139.896 32.808 5.920 6.037
Maximum and minimum 192.59/ 116.05 127.36/ 4.42 7.23/ 4.42 7.23/ 5.36
R2 5.516x10⁻³ 0.844 0.777 0.848
R2ad juste d -4.184x10⁻³ 0.835 0.713 0.787
F 11.779 321.042 77.754 46.940
stand ard e rro r 7.440x10⁻² 9.670x10⁻² 8.094x10⁻² 3.872x10⁻²
Durb in-Watso n 1.747 1.567 1.826 1.391
Tab le 4
Fo re c ast e valuatio n fo r stand ard ize d tub e rc ulo sis mo rtality rate s (all fo rms, line ar sc ale , p e r 100,000 inhab itants)
b y the ARIMA (1,1,1) mo d e l, in São Paulo , Brazil, 1993-97 and 1998-2002.
Period Forecast Confidence M easured Absolut e
t uberculosis int erval (95%) t uberculosis percent age
mort alit y rat es mort alit y rat es error
Ex Po st 1993 5.673 4.611-6.979 6.587 13,88%
1994 6.367 5.175-7.833 6.656 4,34%
1995 6.512 5.293-8.012 7.233 9,97%
1996 7.186 5.841-8.841 6.862 4,72%
1997 6.817 5.541-8.387 6.036 12,94%
Ex Ante 1998 5,911 4.805-7.272
1999 5,781 4.244-7.874
2000 5,647 3.796-8.400
2001 5,511 3.414-8,897
2002 5,373 3.078-9.379
cases previously classified as tuberculosis were reallocated to the mortality rates from indeter-minate causes.
The precariousness of this hypothesis has been pointed out by Almeida (1990), who de-duced it from the social characterization of the period, but without justifying it from a statisti-cal perspective. Indeed, the source of this error was the application of ordinary least squares regression analysis to an autocorrelated time-series segment (Durbin-Watson = 0.928). gram and the generalized least squares
regres-sion analysis (p = 0.181) suggest the indicator’s stationary nature. On this basis, the explanato-ry power of the hypothesis mentioned by this author to explain the virtual decrease of tuber-culosis mortality during that period is reduced. According to this researcher, the increasing supply of medical professionals in the city of São Paulo probably accounted for the more ac-curate diagnosis of the disease, with a conse-quent reduction in “occasional diagnoses”, i.e., Tab le 3
ARIMA (1,1,1) e stimate s and c lo se ne ss o f fit ind ic ato rs fo r stand ard ize d tub e rc ulo sis mo rtality rate s (all fo rms,
lo g sc ale , p e r 100,000 inhab itants) in São Paulo , Brazil, 1900-97.
Est imat e St andard Error t p
auto re g re ssive te rm 8.881x10⁻¹ 1.511x10⁻² 5.878 p < 0.001
mo ving ave rag e te rm 7.887x10⁻¹ 2.022x10⁻² 3.899 p < 0.001
c o nstant -1.440x10⁻² 8.295x10⁻³ -1.736 p < 0.1
re sid ual me an 4.740x10⁻⁴ 1.055x10⁻² 4.494x10⁻² p > 0.45
R2 > 0.999
Bo x-Pie rc e lag s 6, 12, 18, 24 p > 0.17
Ljung -Bo x lag s 6, 12, 18, 24 p > 0.12
Akaike info rmatio n c rite rio n -322.719
Sc hwartz Baye sian c rite rio n -314.994
me an ab so lute p e rc e nt e rro r 5.534%
lo g like liho o d 164,359
With regard to the 1920-1945 period, as well as the overall 1900-1945 period, the time-series showed a stationary trend, supporting the “sta-bility of the epidemic” hypothesis proposed by Nussenzveig & Certain (1953), who observed that the disease persisted at a considerably high level.
Throughout this initial period, the city re-ceived an intense flow of immigrants consist-ing of Europeans and Asians attracted by the
expansion of coffee-growing in the interior and the city’s early industrialization. Morse (1970) points out that half the foreigners returned to their home countries after some time. Thus, the migratory process was peculiarly heteroge-neous, with more affluent population contin-gents being replaced by less privileged ones, since arriving immigrants needed financial backing for the trip, while those who returned home did so at their own expense. This had a Fig ure 2
Time -se rie s fo r p ro p o rtio nal tub e rc ulo sis mo rtality ratio (p ulmo nary fo rm, lo g sc ale , p e r 100 d e aths in the same ag e
g ro up ), stratifie d b y ag e g ro up , in São Paulo , Brazil: 1900-97.
0,01
ra
ti
o
s
0,1 1 10 100
> 49 20-49 < 5
1990 1980
1970 1960
1950 1940
1930 1920
1910 1900
Fig ure 3
Shifting ag e struc ture o f tub e rc ulo sis d e aths (p ulmo nary fo rm) in São Paulo , Brazil: 1900-97.
0 %
15 30 45 60 75
> 49 20-49 < 5
1990 1980
1970 1960
1950 1940
1930 1920
definite impact on the persistently high mor-tality rates throughout the first half of the cen-tury (Antunes, 1998).
However, beginning in the mid-1930s this process was virtually interrupted when govern-ment subsidized immigration stopped. With the international financial crisis following the crash on the New York stock exchange, coffee prices plummeted at a time when Brazil al-ready had huge coffee bean reserves to regulate
prices. Still, the population flow into the city of São Paulo continued, especially with the arrival of contingents from the Northeast, driven off the land by drought and dire living conditions. The relevance of this rural exodus for main-taining high tuberculosis rates in the city of São Paulo was also the subject of some controversy among scholars at the time. In a comparative analysis of counties from the interior of the State receiving migrants and others that did Fig ure 4a
Ag e -sp e c ific tub e rc ulo sis mo rtality rate s (p ulmo nary fo rm), São Paulo , Brazil, fo r se le c te d ye ars (1935, 1945, 1955
and 1965).
0 50 100 150 200 250
1935
1945
1955
1965
> 75 ag e g ro up 70-74
65-69 60-64 55-59 50-54 45-49 40-44 35-39 30-34 25-29 20-24 15-19 10-14 5-9 1-4 0-1
ra
te
s
Fig ure 4b
Ag e -sp e c ific tub e rc ulo sis mo rtality rate s (p ulmo nary fo rm), São Paulo , Brazil, fo r se le c te d ye ars (1975, 1985 and 1995).
0
ra
te
s
10 20 30
1975
1985
1995
> 75 ag e g ro up 70-74
not, Mascarenhas (1949a, 1949b,1950) showed that domestic migration was not related to the evolution of mortality due to tuberculosis. Al-meida (1990), however, pointed out that even without importing new infectious foci, migrants were more susceptible to tuberculosis, since most of them came from rural areas, and even in the city they faced severe food and housing problems and unhealthy working conditions. Thus, each new wave of migrants contributed to the overall mortality, maintaining the stabil-ity of the tuberculosis curve at a high level.
A sharp decline in tuberculosis mortality occurred from 1945 to 1985 (-7.41% per year). This trend partly reflects the overall drop in
mortality in the city of São Paulo resulting from the demographic transition phenome-non. However, it also indicates the disease’s re-duced case fatality, resulting from the intro-duction of preventive and therapeutic mea-sures. Authors agree in ascribing this trend mainly to the effect of streptomycin use in clin-ical practice, but the creation of medclin-ical and social care facilities also played a role in the city’s declining tuberculosis rates. Another pos-sible factor in this reduction was reported by Sant’Anna & Bethlem (1988): by the middle of the century, extension of milk pasteurization had virtually eliminated Mycobacterium bovis
transmission to humans in cities (a problem Tab le 5
Time -se rie s fo r tub e rc ulo sis mo rtality rate s (p ulmo nary fo rm, p e r 100,000 inhab itants) stratifie d b y g e nd e r and ag e
g ro up , São Paulo , Brazil, 1900-97. Ratio s o f ye arly inc re ase (p e rc e ntag e ) and 95% c o nfid e nc e inte rvals we re e stimate d
b y the Co c hrane -O rc utt re g re ssio n analysis p ro c e d ure fo r e ac h p e rio d .
Age group Period Females M ales Tot al
und e r 5 ye ars o ld
1900-42 + 3.693% + 4.136% + 4.060%
+ 2.059 / + 5.352 + 2.437 / + 5.863 + 2.363 / + 5.785
1942-53 -10.613% -6.582% -8.224%
-18.328 / -2.169 -13.677 / + 1.096 -14.844 / -1.089
1953-64 + 5.805% + 4.526% + 5.162%
+ 3.016 / + 8.670 + 2.468 / + 6.625 + 3.523 / + 6.827
1964-85 -11.320% -11.636% -11.393%
-13.846 / -8.720 -14.883 / -8.264 -14.248 / -8.442
1985-97 Statio nary tre nd -10.467% Statio nary tre nd
-14.240 / -2.197
20 to 49 ye ars o ld
1900-46 Statio nary tre nd Statio nary tre nd Statio nary tre nd
1946-85 -9.189% -8.260% -8.294%
-10.040 / -8.331 -9.396 / -7.111 -9.352 / -7.224
1985-95 + 5.835% + 5.148% + 4.686%
+ 1.323 / + 11.863 + 3.219 / + 7.113 + 2.848 / + 6.557
50 o r mo re ye ars o ld
1900-46 -0.768% Statio nary tre nd Statio nary tre nd
-1.455 / -0.076
1946-85 -6.054% -5.599% -5.717%
-6.401 / -5.706 -6.384 / -4.843 -6.343 / -5.087
1985-97 + 7.462% + 2.083% + 2.708%
emphasized by bacteriologists since the begin-ning of the century) (Antunes et al., 1992).
The highly uniform trend towards an expo-nential decline throughout this period can be appreciated based on the high indicator of goodness-of-fit in the regression analysis for the log transformed series (R2adjusted = 0.835; F = 321.042). However, this contrasted with the graphic and analytical arrangement of the time-series on a decimal linear scale, which suggested a division of this period into two stages, 1945-1953 and 1954-1985, the former showing a much more marked downward trend than the latter. Interestingly, this interpreta-tion, proposed by Almeida (1990), allows one to associate the period of highest decline in mortality with that immediately following the adoption of streptomycin in clinical practice in 1947 (Wünsch-Filho, 1985). Still, this is not the most satisfactory model, since it yields two time-series segments with worse indicators of goodness-of-fit for generalized least squares regression analysis (Tables 1 and 2).
In contrast, during the period from 1985 to 1995, there was a marked upward trend in the series, a factor partly attributable to the associ-ation of tuberculosis with HIV. However, new studies are needed to quantify this association as to the possible reduced effectiveness of ther-apeutic and preventive resources for tubercu-losis in Brazil. This concern is shared by Surdre (1992), highlighting the global magnitude of tuberculosis as reflecting the inadequacy of tu-berculosis control programs worldwide.
Dolin (1994) proposes a ratio of 10% for both morbidity and mortality due to tubercu-losis associated with AIDS worldwide. He also states that by the year 2000, HIV-attributable cases of tuberculosis will account for almost 15% of all tuberculosis deaths. In a preliminary estimate, Ruffino-Netto (1995) quotes an even higher figure, i.e., that 17.7% of tuberculosis morbidity in Brazil in 1992 involved HIV-attrib-utable cases. Such figures become even more striking when one considers the persuasive ev-idence reported by Murray (1997), that in the presence of HIV infection, recent tuberculosis infection will progress rapidly to clinically sig-nificant disease. According to the same author, the probability of reactivation of latent tuber-culosis infection in such cases increases enor-mously. He also points out that the accelerat-ing and expandaccelerat-ing influence of HIV infection also contributes to the increasing incidence of disease involving multidrug-resistant strains of
Mycobacterium tuberculosis.
Such researchers as Guimarães (1978) and Wünsch-Filho (1985) ascribe the strong decline
in tuberculosis mortality mainly to the dis-ease’s reduced case fatality, resulting from new therapeutic and social assistance resources. Thus, the study of mortality would be of less in-terest after this period, indicating only the ef-fectiveness of the programs directed against the disease. Nevertheless, these same investi-gators did not take into account precisely the analysis of this more recent period, which ap-pears to renew interest in the study of tubercu-losis mortality in various cities and countries, where the emergence of AIDS radically altered the disease’s overall epidemiological profile (Bernardo, 1991; Brawn et al., 1993; Raviglione et al., 1993; Watson et al., 1993; Dolin et al., 1994; Liard et al., 1994; WHO, 1996).
A forecast analysis of standardized tubercu-losis mortality rates using an ARIMA (1,1,1) model indicated a virtual downward trend from 1995 to 2002 (-4.07% per year). This hypothesis also includes stabilization of rates at a higher level than in the early 1980s. In fact, both pos-sibilities hinge on a drop in tuberculosis mor-tality rates for 1996 and 1997 and may be inter-preted as compatible with the sharp decrease in AIDS deaths in São Paulo since 1995, as re-ported by Waldvogel & Morais (1998).
The present study appears to support Re-ichman’s proposal of a U-shaped curve de-scribing the history of tuberculosis in the 20th century (Reichman, 1991). However, the pre-diction and early quantification of the upward trend in tuberculosis in Brazil may help to re-verse the latest stage in this U-shaped curve, requiring a decisive revitalization of tuberculo-sis control programs.
Visual inspection of the time-series related to the pulmonary tuberculosis proportional mortality ratio, stratified by age group (Figure 2), supports the conviction that children under 5 years of age suffered the highest rise in tuber-culosis mortality over time, a phenomenon that persisted until the mid-1960s. This may be ex-plained by the increasing ability of health care facilities to detect the disease in this age group, although the observed trend in proportional tu-berculosis mortality ratios may only be reflect-ing variations in deaths due to other causes.
stable, although with a high variance in the measures, which may reflect the small number of pulmonary tuberculosis deaths in this age group. Despite this last observation, the accel-erating downward trend should be considered a favorable indicator of intradermal BCG vacci-nation and its impact on tuberculosis mortality in this age group.
In the remaining age groups there was a de-cline in proportional mortality rates beginning in the 1950s, with a less marked trend than for those recorded in the time-series for mortality rates. The decrease in tuberculosis mortality during this period thus appears to have accom-panied, at least in part, the decline in overall mortality, a factor ascribed to the demographic transition occurring during the same period in the city of São Paulo.
Several comments are at hand on the study of time-series related to tuberculosis mortality rates, stratified by gender and age group, as quantified in Table 5. The general feature of the time-series for overall rates is maintained in al-most all the new series. The downward trend in the intermediate period was more marked for the 20-49-year age group than for the over-50 group for both sexes, as noted previously by Vranjac (1980), using other graphic devices. Re-porting of tuberculosis deaths remained higher for males in the adult and older age groups, and to a lesser extent among children under 5 years. This observation may be tempered by studies reporting greater under-reporting of the disease among females (Connolly & Nunn, 1996), although there are no such observations on record for Brazil.
Women aged 20 to 49 years experienced a sharper downward trend in tuberculosis death rates than men of the same age in the interme-diate period. The same was true for women over 50 years, but with a less marked contrast. Tuber-culosis mortality rates were highest among peo-ple over 50 years throughout almost the entire century. In recent years this contrast has be-come even sharper. Thus, this is the age group most susceptible to the disease, despite having lower proportional tuberculosis mortality rates than adults aged 20 to 49 years throughout the century, as shown in Figure 2. This observation does not contradict the realization that tuber-culosis mortality still remains high among adults aged 20 to 49 years, involving a high so-cial cost, as indicated in Figures 4a and 4b.
There is still an intriguing observation about the period of decreased tuberculosis mortality in children under 5 years. From 1940 to 1953 and from 1964 to 1985, mortality rates for pulmonary tuberculosis dropped more in
this age group than in others, with a regular in-tensity, i.e., -8.22 and -11.39% a year, respec-tively. However, from 1953 to 1964 this trend stopped, with a sharp inflection in the mortali-ty curve, which began to display a local ten-dency towards an annual growth of +5.16%. As an additional indication of social instability during this period, these records should moti-vate new studies specifically focused on this phenomenon, especially to clarify its relation to the increased migratory process in the 1950s and the increase in infant mortality rates in the 1960s (Leser, 1975; Zuñiga & Monteiro, 1995).
The upward trend in tuberculosis mortality after the early 1980s was more marked for peo-ple aged 20 to 49, paralleling the trend in the Aids epidemic, an observation calling for fur-ther research on the association between tu-berculosis and the Aids epidemic, the declin-ing quality of public health programs for tuber-culosis control and treatment, and the aggra-vation of social inequality in Brazil, as the main causes of resurgent tuberculosis mortality.
Final comment s
Tuberculosis was one of the main causes of death in São Paulo throughout the first half of the 20th century, accounting for over 10% of all deaths in the city in the 1930s and 40s. In the historical health records, mortality from tuber-culosis greatly exceeded that caused by ty-phoid fever, measles, diphtheria, and syphilis, other traditional health problems highly preva-lent in the city. The high tuberculosis rates led researchers to characterize the disease as be-ing in the “epidemic phase, in the stage of sta-bilization” (Nussenzveig & Certain, 1953). Dur-ing the same period, the city of Rio de Janeiro displayed even more dramatic tuberculosis mortality rates, ranging from 300 to 500 annual deaths per 100,000 inhabitants (Penna, 1988).
Beginning in the mid-1940s, mortality from tuberculosis declined sharply in a relatively regular trend that lasted until the early 80s. This phenomenon resulted from the introduc-tion of preventive and therapeutic measures, the creation of health services focused specifi-cally on the disease, and social improvements and other factors related to the demographic and epidemiological transition in the city, which also had repercussions on overall changes in health and social development indicators (An-tunes, 1998).
Tuber-culosis is still the leading cause of death attrib-utable to a single pathogen, and its incidence is feared to continue to increase worldwide be-cause of the interaction between the disease and the HIV epidemic. Still, at the local level one cannot overlook either the declining quali-ty of health programs for the treatment and control of this disease or the deepening social differences in recent years, as leading causes of the renewed expansion of tuberculosis.
Time-series analysis of epidemiological in-dicators has proven to be efficient in many ways: improving the use of statistical method-ology in the health sciences; bypassing the dif-ficulties inherent to the characteristics of these values (autocorrelation, heteroscedasticity, collinearity, and non-normality of forecast er-ror distribution); integrating quantitative
analy-sis with the historical interpretation of the study phenomena; projecting estimates of fu-ture trends in the behavior of variables; and systematizing methodology for application in future social research.
Use of time-series methodology allowed for the development of an interesting analysis of the epidemiological profile of tuberculosis in the city of São Paulo. In addition to provid-ing a description and quantification of the up-ward and downup-ward trends in the disease’s so-cial indicators, this analytical tool fostered a discussion of various hypotheses concerning the disease’s behavior in each population seg-ment studied. The present study was thus in-tended to encourage application of this method to other relevant social measures in collective health.
Acknowledgment s
We thank Ms. Magali Valente from Fundação Sistema Estadual de Análise de Dados e Estatística – SEADE, São Paulo, Brazil, for her valuable cooperation in pro-viding the data for this study. We also thank Prof. An-tônio Ruffino Neto from Coordenação Nacional de Pneumologia Sanitária (CENEPI/FNS/Ministério da Saúde) and Professor Victor Wünsch-Filho from Fa-culdade de Saúde Pública – Universidade de São Paulo for reviewing earlier drafts of the study.
References
ALMEIDA, M. M. M. B., 1990. Vigilância Epidemioló-gica da Tuberculose no Município de São Paulo: Uso de Dados de Mortalidade. Tese de Doutorado, São Paulo: Faculdade de Saúde Pública, Universi-dade de São Paulo.
ANTUNES, J. L. F., 1998. “Grow and multiply”: Social development, birth rates and demographic transi-tion in the Municipality of São Paulo, Brazil, 1900-94. Revista Brasileira de Epidemiologia, 1:61-78. ANTUNES, J. L. F.; NASCIMENTO, C. B.; NASSI, L. C.
& PREGNOLATTO, N. P., 1992. Instituto Adolfo Lutz – 100 Anos do Laboratório de Saúde Pública. São Paulo: Letras & Letras.
BERNARDO, J., 1991. Tuberculosis: A disease of the 1990s. Hospital Practice, 26:195-198.
CDC (Centers for Disease Control and Prevention), 1993. Tuberculosis morbidity – United States. Mor-bidity and Mortality Weekly Report, 42:696-704. CHOW, G. C., 1983. Econometrics. Singapore:
McGraw-Hill.
CONNOLLY, M. & NUNN, P., 1996. Women and tuber-culosis. World Health Statistics Quarterly, 49:115-119.
DANIEL, W. W., 1995. Biostatistics: A Foundation for Analysis in the Health Sciences. New York: Wiley. DOLIN, P. J., 1994. Estimates of future global
tubercu-losis morbidity and mortality. Morbidity and Mortality Weekly Report, 42:961-964.
DOLIN, P. J.; RAVIGLIONE, M. C. & KOCHI, A., 1994. Global tuberculosis incidence and mortality dur-ing 1990-2000. Bulletin of the World Health Orga-nization, 72:213-220.
FOLLEY, N. M. & MILLER, R. F., 1993. Tuberculosis and AIDS: Is the white plague up and coming?
Journal of Infection, 26:39-43.
FREES, E. W., 1996. Data Analysis Using Regression Models: The Business Perspective. Englewood Cliffs: Prentice-Hall.
GAYNOR, P. E. & KIRKPATRICK, R. C., 1994. Intro-duction to Time-Series Modeling and Forecasting in Business and Economics. New York: McGraw-Hill.
GUIMARÃES, R., 1978. Saúde e Medicina no Brasil: Contribuição para um Debate. Rio de Janeiro: Editora Graal.
HAMILTON, J. D., 1994. Time-series Analysis. Prince-ton: Princeton University Press.
HARVEY, A. C., 1993. Time-series Models. New York: Harvester Wheatsheaf.
JOHNSTON, J., 1991. Econometric Models. Singapore: McGraw-Hill.
LESER, W., 1975. Crescimento da população da cida-de cida-de São Paulo, entre 1950 e 1970, e seu reflexo nas condições de saúde pública. Ciência e Cultu-ra, 27:244-256.
LIARD, R.; HART, R.; KOROBAEFF, M.; SCHWOEBEL, V. & NEUKIRCH, F., 1994. HIV infection and tu-berculosis: An epidemiological study from a French register. Tubercle and Lung Disease, 75: 291-296.
MASCARENHAS, R. S., 1949a. A tuberculose e a imi-gração nacional no Estado de São Paulo (1a par-te). Arquivos da Faculdade de Higiene e Saúde Pú-blica, 3:87-207.
MASCARENHAS, R. S., 1949b. A tuberculose e a imi-gração nacional no Estado de São Paulo (2a par-te). Arquivos da Faculdade de Higiene e Saúde Pú-blica, 3:219-324.
MASCARENHAS, R. S., 1950. A tuberculose e a imi-gração nacional no Estado de São Paulo (3a par-te). Arquivos da Faculdade de Higiene e Saúde Pú-blica, 4:69-121.
MASCARENHAS, R. S., 1953. Contribuição para o Es-tudo da Administração dos Serviços Estaduais de Tuberculose em São Paulo. Tese de Livre-docên-cia, São Paulo: Faculdade de Saúde Pública, Uni-versidade de São Paulo.
MORSE, R. M., 1970.Formação Histórica de São Pau-lo.São Paulo: Difel.
MURRAY, J. F., 1997. Tuberculosis and HIV infection: Global perspectives. Respirology, 2:209-213.
NUSSENZVEIG, I. & CERTAIN, D. A., 1953. Contri-buição para o estudo da tuberculose no Municí-pio de São Paulo: Aspectos epidemiológicos do problema. Arquivos da Faculdade de Higiene e Saúde Pública, 7:3-86.
PENNA, M. L. F., 1988. Tuberculose: Assistência ou Controle? Discussão sobre a Efetividade Epidemio-lógica dos Programas de Controle Baseados no Diagnóstico e Tratamento de Casos. Dissertação de Mestrado, Rio de Janeiro: Instituto de Medicina Social, Universidade do Estado do Rio de Janeiro. RAVIGLIONE, M. C.; SUDRE, P.; RIEDER, H. L.;
SPINACI, S. & KOCHI, A., 1993. Secular trends of tuberculosis in western Europe. Bulletin of the World Health Organization, 71:297-306.
REICHMAN, L. B., 1991. The U-shaped curve of con-cern. American Review of Respiratory Diseases, 144:741-742.
RODRIGUES, N., 1995. O Óbvio Ululante. São Paulo: Companhia das Letras.
RUFFINO-NETTO, A., 1995. Avaliação do excesso de casos de tuberculose atribuídos à infecção HIV/ AIDS: Ensaio preliminar. Revista de Saúde Públi-ca, 29:279-282.
SANT’ANNA, C. C. & BETHLEM, N., 1988. Tuberculose na Infância. Rio de Janeiro: Cultura Médica. SURDRE, P.; TEN DAM, G. & KOCHI, A., 1992.
Tuber-culosis: A global overview of the situation today.
Bulletin of the World Health Organization, 70: 149-159.
VRANJAC, A., 1980. Epidemiologia da Tuberculose: Es-tudo da Mortalidade por Tuberculose no Municí-pio de São Paulo. Dissertação de Mestrado, São Paulo: Faculdade de Saúde Pública, Universidade de São Paulo.
WALDVOGEL, B. & MORAIS, L. C. C., 1998. Mortali-dade por AIDS em São Paulo: Dezoito anos de história. Boletim Epidemiológico. Secretaria de Estado da Saúde, CRT-DST/AIDS, CVE, 14:3-12. WATSON, J. M.; MEREDITH, S. K.; WHITMORE –
OVERTON, E.; BANNISTER, B. & DARBYSHIRE, J. H., 1993. Tuberculosis and HIV: Estimates of the overlap in England and Wales. Thorax, 48:199-203. WHO (World Health Organization), 1993. Tuberculo-sis: A global emergency. World Health Forum, 14:438.
WHO (World Health Organization), 1996. Tuberculo-sis deaths on the increase. World Health Forum, 17:422.
WHO (World Health Organization), 1997. Global Tu-berculosis Control.WHO Report, WHO/TB/97.225. Geneva: Global Tuberculosis Programme, Global Tuberculosis Control, WHO.
WÜNSCH-FILHO, V., 1985. Os Estudos de Caso – Con-trole na Avaliação da Eficácia de Vacinas: A Eficá-cia da Vacina BCG.Dissertação de Mestrado, São Paulo: Faculdade de Saúde Pública, Universidade de São Paulo.
ZAR, J. H., 1996. Biostatistical Analysis. Upper Saddle River: Prentice – Hall.