ABSTRACT:Objective: The study evaluated the trend of hospitalization for ischemic stroke (HIS) and its hospital mortality in Brazil over the last 15 years as well as the impact of the Hiperdia program in this scenario.
Methods: An ecological study was designed with analytical approach and data collected in the Hospital Admission System on episodes of stroke, over the years 1998 to 2012. All data were stratiied by sex and age, creating an indicator for HIS and proportion of hospital mortality. To estimate the trend of the data a polynomial curve itting was created; and the Generalized Linear Model was applied to investigate the impact of Hiperdia on the endpoint HIS and hospital mortality. We adopted a 5% signiicance level to minimize an error type I. Results:
We observed a reduction of HIS from 37.57/105 inhabitants in 1998 to 2001 to 10.33/105 inhabitants in 2002 to 2005, declining 73.64%. The reduction occurred in both sexes and for all age groups. The mortality rate of ischemic stroke also declined in Brazil since 2002, in both men and women, therefore in less than 3%; and only in the groups aged between 0 and 14 and above 80 years, we did not detect trend. Conclusion: Therefore, the decline of HIS temporally coincided with the implementation of Hiperdia in 2002 and this trend continues today.
Keywords: Stroke. Hospitalization. Hospital mortality. Epidemiology. Brazil. Primary health care.
Hospitalization for ischemic stroke
in Brazil: an ecological study on
the possible impact of Hiperdia
Hospitalização por acidente vascular encefálico isquêmico
no Brasil: estudo ecológico sobre possível impacto do Hiperdia
Johnnatas Mikael LopesI, Gerônimo José Bouzas SanchisII, Jovany Luiz Alves de MedeirosIII, Fábio Galvão DantasIV
IUniversidade Potiguar and Collective Health Department, Universidade Federal do Rio Grande do Norte – Natal (RN), Brazil. IISchool of Health Sciences, Universidade Federal do Rio Grande do Norte – Santa Cruz (RN), Brazil.
IIISchool of Medical Sciences of Campina Grande – Campina Grande (PB), Brazil.
IVDepartment of Physical Therapy, Universidade Estadual da Paraíba – Campina Grande (PB), Brazil.
Corresponding author: Johnnatas Mikael Lopes. Avenida Senador Salgado Filho, 3000, Campus Central da Universidade Federal do Rio Grande do Norte, Departamento de Saúde Coletiva, CEP: 59078‑970, Natal, RN, Brasil. E‑mail: [email protected] Conlict of interests: nothing to declare – Financial support: none.
INTRODUCTION
The stroke occurs by dysfunctions in the cerebral blood low1, being classiied as hem‑ orrhage or as ischemic. The ischemic stroke (IS) is the most frequent and morbid one, occurring in 80% of the cases, whereas the hemorrhagic stroke is more rare, resulting, however, in greater mortality2,3.
Most individuals survive the IS2, but the resulting sequelae have repercussions on the functional capacity and in the quality of life, resulting in a great impact on the health sys‑ tems and social security. In Argentina and Brazil, in 2011, approximately US$ 900 million were spent with hospital care to patients hospitalized with stroke4.
In developed countries, it is estimated that 1 in every 20 adults will be a victim of stroke, exceeding the incidence of acute coronary diseases in the near future5‑7. In the recent 4 decades, there was a decrease of 42% in the incidence of stroke in high‑income countries and an increase in the medium‑income countries8. Within these last ones, it is observed higher post‑stroke mortality8, suggesting inluence of the primary services of urgency/ emergency and intensive care9‑11. However, in general, the incidence and mortality rates related to stroke have decreased worldwide10.
In the United States, 795 thousand people are afected by strokes each year5. In Latin America, the disease is the main cause of morbidity and mortality, especially in Brazil11,12. By 2020, it is estimated that the stroke and the coronary arterial disease will be, together, the main causes of lost of years of life13. Interestingly, Feigin et al.8 and Heuschmann et al.14 observed regional diferences in Europe as for the incidence of stroke, being lower
RESUMO:Objetivo: O estudo avaliou a tendência de hospitalização por acidente vascular encefálico isquêmico (HAVEI) e a sua mortalidade hospitalar no Brasil nos últimos 15 anos, assim como o impacto do programa Hiperdia nesse cenário. Métodos: Delineou‑se um estudo ecológico com abordagem analítica e dados coletados no Sistema de Internação Hospitalar sobre episódios de AVEI, referentes aos anos de 1998 a 2012. Todos os dados foram estratiicados por sexo e faixa etária, criando‑se um indicador para HAVEI e proporção de mortalidade hospitalar. A im de estimar a tendência dos dados criou‑se uma curva polinomial de melhor aderência e para a averiguar o impacto do Hiperdia aplicou‑se o Modelo Linear Generalizado tomados como desfecho a HAVEI e a mortalidade hospitalar. Adotou‑se um nível de signiicância de 5% para minimizar um erro tipo I. Resultados: Foi evidenciada redução das HAVEI de 37,57/105 habitantes em 1998 a 2001 para 10,33/105 habitantes em 2002 a 2005, declinando 73,64%. A redução aconteceu em ambos os sexos, assim como para todas as faixas etárias. A mortalidade hospitalar por AVEI também declinou no Brasil a partir de 2002, tanto em homens como em mulheres, porém em menos de 3% e apenas nas faixas entre 0 e 14 anos e acima de 80 anos não detectamos tendência. Conclusão: Portanto, o declínio das HAVEI coincidiu temporalmente com a implementação do Hiperdia no ano de 2002 e essa tendência se mantém até hoje.
in Eastern European countries, a fact probably related to the implementation of ight and control measures of risk factors such as hypertension, diabetes mellitus (DM), atrial ibri‑ lation, physical inactivity, and smoking8,9,15.
In 2002, it was implemented in Brazil the national assistance program for people with high blood pressure (hypertension) and DM, called Hiperdia, which consists in the continuous monitoring of such patients, with the basic health units of the Uniied Health System (Sistema Único de Saúde – SUS), with the supply of drugs and the promotion of healthy life habits16,17.
Despite its existence for more than a decade, there are still no studies estimating the efects of the implementation of Hiperdia nationwide about the most common outcome of cerebrovascular events, which is hospitalization by IS. The estimation of this event sets in the main indicator of result that evaluates directly the efects of preventive assis‑ tance to this morbidity. On the other hand, the proportion of hospital deaths by IS after medical care is an indicator of health‑care quality of emergency/pre‑ and intra‑hospital emergency services.
Thus, there are two guiding questions for this research: do hospitalization by IS and its hospital mortality have any trends between 1998 and 2012? If so, did the Hiperdia change this trend? Considering that, the IS is a potentially preventable event, unlike the hemor‑ rhagic one, it will be used in the estimates of incidence and hospital mortality indicators. Therefore, the objective of the present study was to measure the historical trends of hos‑ pitalizations by IS and their hospital mortality in Brazil between 1998 and 2012, under the hypothesis of a possible impact of Hiperdia in this time period.
METHODS
It was made an ecological study of the time period and an analytical approach between the years of 1998 and 2012. The information covers all the federal units (FU) in Brazil. For the study of hospitalization by IS, the Hospital Admission Authorizations due to this disease were observed. As it is a study made with secondary and aggregate data from the informa‑ tion systems, without personal identiication, open to public consultation, not leading to the identiication of those who used the hospital services of SUS, it is unnecessary the eval‑ uation by the Ethics Committee.
The diagnosis of IS was established according to Chapter VI of nervous diseases in the tenth version of the International Classiication of Diseases, whose identiication code is G45.9 and grouped as follows: the vertebrobasilar artery syndrome, carotid artery syndrome (hemispheric), multiple and bilateral precerebral artery syndromes, amaurosis fugax, spasm of cerebral artery, and transient cerebral ischemia.
and overall hospital morbidity by place of residence. The demographic data of populational estimates were collected in the function of demographic and socioeconomic information of the same database.
There was stratiication of the data, according to the FU, gender (male and female) and age (0 to 14; 15 to 19; 20 to 29; 30 to 39; 40 to 49; 50 to 59; 60 to 69; 70 to 79; and older than 80 years old). Thus, it was determined the HIS rate in relation to the estimated population for the year of the study, simplifying them by a power of 105 inhabitants. The proportion of hospital mortality was deined between the number of deaths by HIS in the hospitals ail‑ iated to SUS and the total of HIS, also stratiied by gender, age range, and FU.
For the analysis of the data trends, it was used a model of polynomial regressions, due to its high statistical power and greater ease of interpretation18. These models have the objec‑ tive of inding the best curve to adjust the data, relating the outcome variable, HIS rate, and mortality (Y), with the independent variable year of study (X). We considered the following models of polynomial regression:
• linear (1st order): Y = β0 + β1X + ε;
• quadratic (2nd order): Y = β0 + β1X + β2X + ε;
• cubic (3rd order): Y = β0+ β1X + β2 X+ β3X + ε.
It was characterized as β0 is the mean outcome observed in the period regardless of the year, and β1, β2, and β3 are the regression coeicients, which inform the annual mean evo‑ lution. Its signal determines the growing trend (+) or decreasing trend ( ) of the outcome. The term ε represents the residue not explained by the equation. The choice of the model depended on the analysis of the residues in the scatter diagram and the adjusted determi‑ nation coeicient (R2). As there are two similar models, it was chosen to use the simplest one, the one of lower order.
To avoid the serial correlation between the terms of the regression equation, it was cho‑ sen not to use the gross values of the years, but instead the diference between the year and the midpoint of the historical series. Therefore, for the period between 1998 and 2012, the term (X ‑ 2004) represented the independent variable. For example, for the linear model:
YT = β0+ β1 (X ‑ 2004), where: YT = incidence rate/mortality; X = year; β0 = HIS/ mean mortality in the period; and β1 = annual evolution average.
the program. Which would have a statistically signiicant diference between the equation generated and the intercept through the method of maximum likelihood, as well as the sig‑ niicance of the regression coeicients by the 2 Wald test.
We used the SPSS® (version 20.0; IBM®, Inc.) for the adjustment of the polynomial curves and for the construction of the GLM. A signiicance level of 5% was observed to minimize a type I error in the processes of adherence to the modeling curves.
RESULTS
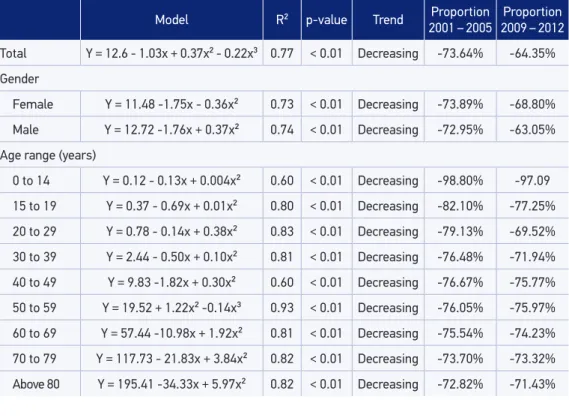
A decline in the HIS was observed from 2002 onward. The average incidence of HIS in the time period was estimated at 12.6/105 inhabitants (Table 1), with mean decrease of 1.03/105 inhabitants a year (p < 0.01). In the period from 1998 to 2001, hospitalizations cor‑ responded to a mean of 37.87/105 inhabitants and in the period from 2002 to 2005 it was reduced to 9.98/105 inhabitants, a reduction of 73.64%.
When stratiied by gender, the HIS among women represented a mean of 11.48/105 inhab‑ itants (p < 0.01) in the whole period. When comparing the periods 1998 to 2001 and 2002 to 2005, a reduction of 73.89% is noticeable. Among men, a mean of 12.72/105 inhabitants was observed, with annual mean reduction of hospitalization around 1.76/105 inhabitants (p < 0.01), which corresponds to 72.95% of the decline between 1998 to 2001 and 2002 to 2005 (Table 1).
Model R² p-value Trend Proportion
2001 – 2005
Proportion 2009 – 2012
Total Y = 12.6 - 1.03x + 0.37x² - 0.22x³ 0.77 < 0.01 Decreasing -73.64% -64.35%
Gender
Female Y = 11.48 -1.75x - 0.36x² 0.73 < 0.01 Decreasing -73.89% -68.80%
Male Y = 12.72 -1.76x + 0.37x² 0.74 < 0.01 Decreasing -72.95% -63.05%
Age range (years)
0 to 14 Y = 0.12 - 0.13x + 0.004x² 0.60 < 0.01 Decreasing -98.80% -97.09
15 to 19 Y = 0.37 - 0.69x + 0.01x² 0.80 < 0.01 Decreasing -82.10% -77.25%
20 to 29 Y = 0.78 - 0.14x + 0.38x² 0.83 < 0.01 Decreasing -79.13% -69.52%
30 to 39 Y = 2.44 - 0.50x + 0.10x² 0.81 < 0.01 Decreasing -76.48% -71.94%
40 to 49 Y = 9.83 -1.82x + 0.30x² 0.60 < 0.01 Decreasing -76.67% -75.77%
50 to 59 Y = 19.52 + 1.22x² -0.14x³ 0.93 < 0.01 Decreasing -76.05% -75.97%
60 to 69 Y = 57.44 -10.98x + 1.92x² 0.81 < 0.01 Decreasing -75.54% -74.23%
70 to 79 Y = 117.73 - 21.83x + 3.84x² 0.82 < 0.01 Decreasing -73.70% -73.32%
Model R² p-value Trend Proportion 2001 – 2005
Proportion 2009 – 2012
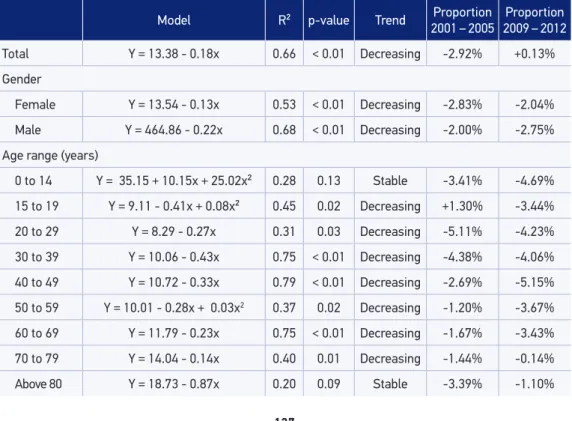
Total Y = 13.38 - 0.18x 0.66 < 0.01 Decreasing -2.92% +0.13%
Gender
Female Y = 13.54 - 0.13x 0.53 < 0.01 Decreasing -2.83% -2.04%
Male Y = 464.86 - 0.22x 0.68 < 0.01 Decreasing -2.00% -2.75%
Age range (years)
0 to 14 Y = 35.15 + 10.15x + 25.02x² 0.28 0.13 Stable -3.41% -4.69%
15 to 19 Y = 9.11 - 0.41x + 0.08x² 0.45 0.02 Decreasing +1.30% -3.44%
20 to 29 Y = 8.29 - 0.27x 0.31 0.03 Decreasing -5.11% -4.23%
30 to 39 Y = 10.06 - 0.43x 0.75 < 0.01 Decreasing -4.38% -4.06%
40 to 49 Y = 10.72 - 0.33x 0.79 < 0.01 Decreasing -2.69% -5.15%
50 to 59 Y = 10.01 - 0.28x + 0.03x2 0.37 0.02 Decreasing -1.20% -3.67%
60 to 69 Y = 11.79 - 0.23x 0.75 < 0.01 Decreasing -1.67% -3.43%
70 to 79 Y = 14.04 - 0.14x 0.40 0.01 Decreasing -1.44% -0.14%
Above 80 Y = 18.73 - 0.87x 0.20 0.09 Stable -3.39% -1.10% Table 2. Modeling of hospital mortality trend by ischemic stroke in Brazil between 1998 and 2012.
The data also revealed a decline in the HIS in all age groups (p < 0.01). However, it is highlighted the higher rate of hospitalization within the older age groups, especially from the fourth decade of life, presenting an annual mean of 9.83 (40 to 49 years), 19.52 (50 to 59 years), 57.44 (60 to 69 years), 117.73 (70 to 79 years), and 195.41/105 inhabitants (above 80 years), showing a geometric trend of doubling the occurrence of HIS every decade of life (Table 1).
Table 2 exposes the hospital mortality trend by IS in Brazil, showing a downward trend, with mean in the time period of approximately 13.38% of the HIS and a decrease of 0.18% a year (p < 0.01). Among women, the mean mortality was 13.54% and the mean decrease was 0.13% a year (p < 0.01), with a reduction of 2.83% between the periods from 1998 to 2001 and 2002 to 2005. Among men, the hospital mortality in HIS was characterized by a mean annual decrease of 0.22% (p < 0.01), with a reduction of 2% between the periods from 1998 to 2001 and 2002 to 2005.
As for the age ranges, it was observed stability between 0 and 14 years of age and from 80 years of age onward (p > 0.05). Within the other ranges, there was a statistically signii‑ cant decrease in mortality (p < 0.05) and the mean hospital deaths proportion by IS varied from 8% to 14% with the increasing age (Table 2).
FU HIS R2 p-Value Trend Hospital mortality R2 p-Value Trend GO Y = 16.27 – 0.7x + 0.30x² 0.29 0.12 Stable Y = 9.98 – 2.15x + 0.27x² 0.88 < 0.01 Decreasing MA Y = 15.92 – 2.4x + 0.45x² 0.85 < 0.01 Decreasing Y = 6.70 + 0.28x 0.46 < 0.01 Increasing MG Y = 12.71 – 2.24x + 0.25x² 0.85 < 0.01 Decreasing Y = 12.88 – 0.26x 0.50 0.01 Decreasing MS Y = 13.69 – 1.50x + 0.23x² 0.63 < 0.01 Decreasing Y = 15.15 – 0.27x 0.30 0.11 Stable MT Y = 9.33 – 1.74x + 0.19x² 0.74 < 0.01 Decreasing Y = 11.46 + 0.15x 0.03 0.54 Stable PA Y = 7.57 – 1.33x 0.60 < 0.01 Decreasing Y = 13.26 – 0.60x + 0.14x² 0.52 0.01 Decreasing PB Y = 7.38 + 1.5x – 0.04x² 0.62 0.01 Decreasing Y = 9.55 + 3.12x – 0.05x² 0.71 < 0.01 Decreasing PE Y = 1.54 + 0.55x + 0.23x² 0.77 < 0.01 Decreasing Y = 15.93 + 0.49x 0.22 0.07 Decreasing PI Y = 22.66 + 1.03x 0.52 < 0.01 Decreasing Y = 6.34 + 0.02x ≤0.01 0.78 Stable PR Y = 20.03 – 2.76x 0.65 < 0.01 Decreasing Y = 12.16 – 0.04x 0.02 0.60 Stable AC Y = 15.85 – 2.73x 0.68 < 0.01 Decreasing Y = 16.60 – 1.94x 0.65 < 0.01 Decreasing RJ Y = 12.05 – 0.98x + 0.20x² 0.54 < 0.01 Decreasing Y = 14.81 – 0.12x 0.11 0.22 Stable RN Y = 14.00 – 2.72x + 0.86x² 0.71 < 0.01 Decreasing Y = 0.59 + 1.27x + 0.20x² – 0.03x³ 0.76 < 0.01 Decreasing RO Y = 4.16 – 2.42x + 0.47x² 0.85 ≤ 0.01 Decreasing Y = 11.52 + 0.11x 0.01 0.70 Stable RR Y = 0.42 + 0.05x 0.11 0.21 Stable Y = 8.20 – 1.01x 0.03 0.53 Stable RS Y = 17.29 – 8.24x + 1.99x² 0.86 < 0.01 Decreasing Y = 13.44 + 0.01x ≤0.01 0.87 Stable SC Y = 31.05 – 5.23x + 0.88x² 0.75 < 0.01 Decreasing Y = 12.33 – 0.32x 0.78 < 0.01 Decreasing SE Y = 6.62 – 4.20x + 0.28x² 0.80 < 0.01 Decreasing Y = 30.91 – 0.31x 0.33 0.08 Decreasing SP Y = 8.60 + 0.19x – 0.30x² 0.79 < 0.01 Decreasing Y = 13.03 – 0.44x + 0.03x² 0.88 < 0.01 Decreasing TO Y = 26.34 – 4.8x 0.42 < 0.01 Decreasing Y = 16.82 – 0.20x 0.27 0.15 Decreasing AL Y = 13.87 – 4.35x + 0.54x² 0.71 < 0.01 Decreasing Y = 11.82 –2.36x + 0.23x² + 0.03x³ 0.81 < 0.01 Decreasing AM Y = 6.49 + 1.88x + 0.36x² 0.77 < 0.01 Decreasing Y = 8.30 + 0.23x 0.51 0.01 Decreasing AP Y = 10.35 – 2.4x 0.46 < 0.01 Decreasing Y = 15.92 + 0.53x 0.02 0.55 Stable BA Y = 11.01 –1.10x + 0.23x² 0.53 0.01 Decreasing Y = 12.35 – 0.04x <0.01 0.75 Stable CE Y = 8.45 – 0.17x 0.10 0.23 Stable Y = 22.00 + 0.61x – 0.24x² 0.58 < 0.01 Decreasing DF Y = 12.62 – 1.19x 0.35 0.07 Decreasing Y = 14.52 –0.62x 0.64 < 0.01 Decreasing ES Y = 17.60 – 0.10x 0.70 < 0.01 Decreasing Y = 19.59 –0.62x – 0.14x² 0.74 < 0.01 Decreasing Table 3. Modeling of hospitalization trends by ischemic stroke and hospital mortality by ischemic stroke in Brazilian Federal Units between 1998 and 2012.
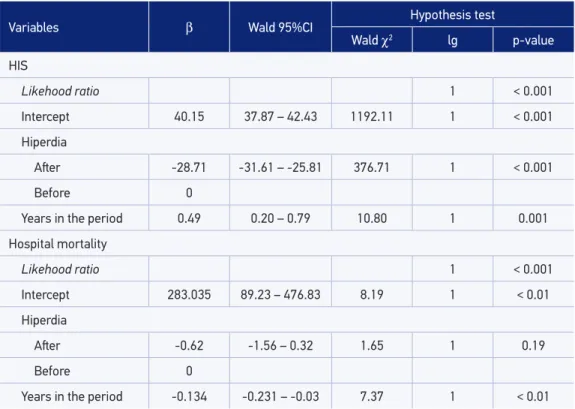
Variables β Wald 95%CI Hypothesis test
Wald χ2 lg p-value
HIS
Likehood ratio 1 < 0.001
Intercept 40.15 37.87 – 42.43 1192.11 1 < 0.001
Hiperdia
Ater -28.71 -31.61 – -25.81 376.71 1 < 0.001
Before 0
Years in the period 0.49 0.20 – 0.79 10.80 1 0.001
Hospital mortality
Likehood ratio 1 < 0.001
Intercept 283.035 89.23 – 476.83 8.19 1 < 0.01
Hiperdia
Ater -0.62 -1.56 – 0.32 1.65 1 0.19
Before 0
Years in the period -0.134 -0.231 – -0.03 7.37 1 < 0.01
95%CI: conidence interval of 95%; lg: liberty degree; HIS: hospitalization by ischemic stroke.
Table 4. General Linear Model of Hiperdia impact on trend of hospitalization by ischemic stroke and hospitalar mortality in Brasil between 1998-2012.
mortality by IS was stable in the FU of Mato Grosso do Sul, Mato Grosso, Piauí, Paraná, Rio de Janeiro, Rondônia, Roraima, Rio Grande do Sul, Amapá, and Bahia (p > 0.05), while Maranhão showed a rising trend of 0.28% a year (p < 0.01). On the other hand, Goiás, Minas Gerais, Pará, Paraíba, Pernambuco, Acre, Rio Grande do Norte, Santa Catarina, Sergipe, São Paulo, Tocantins, Alagoas, Amazonas, Ceará, Distrito Federal, and Espírito Santo showed a decreasing trend across the 15 years analyzed.
DISCUSSION
Large scale studies on the occurrence of IS and its hospital mortality are incipient in Brazil. For the most part of them, they are restricted to local populational epidemiological studies. The present study covers the entire national territory and uses an information system of relevance for the monitoring of the studies outcomes, allowing to evidence pronounced reductions in the HIS from 2002 onward, year of implementations of the Hiperdia program. On the other hand, hospital mortality, despite its signiicant decreasing trend, reveals trivial value in epidemiological application and health management.
A study carried out in Chili revealed IS incidence of approximately 47/105 inhabitants a year8. In China15, in 2007, the incidence of stroke varied from 259.86 to 719/105 inhabitants. In Europe, the incidence of stroke sufered regional variations, and in Italy it was observed an incidence of 101.2/105 inhabitants and in Lithuania, of 239.3/105 inhabitants14. In India, the occurrences were proven lower, in the order of 74.8/105 inhabitants19. Our indings, prior to the implementation of the Hiperdia, are similar to the indings in Chile8. However, after 2002, there was a reduction in the HIS in Brazil, as in Belgium10, in the mid‑1980s. The way inferior rates of HIS in Brazil in comparison to countries such as Italy portray the demographic transition that already occurred in the country, whose greater proportion of older people increases the occurrence of cerebrovascular events as will be discussed ahead. And as Belgium, Brazil started outlining preventive measures of great impact.
The diferences between developed and undeveloped countries are related, probably, to the management of risk factors such as hypertension, diabetes, and smoking20,21. Liu et al.15 revealed a decrease of 21.4% in the incidence of stroke in 4 years in China between 1992 and 1995. A study carried out in the city of Oxford revealed a decline of 40% in the incidence of stroke between 1981 and 2004, after the implementation of preventive and educational measures in the ight against risk factors such as hypertension22. In Japan, no signiicant changes were reported in the incidence of IS between 1988 and 200423, probably due to secular lifestyle that favors longevity with quality of life and low rates of cerebrovascular events in this Asian country.
In Brazil, we see a decline of more than 70% in the HIS right after the execution of the assistencial program to hypertensive and diabetics in 2002. Such health policy allowed the control of blood pressure and of glucose through the use of drugs and strategies to chang‑ ing lifestyle habits16,17. Probably, the fall in HIS in Brazil is due to these preventive measures that mitigate the modiiable risk factors of great impact in the occurrence of the disease24,25. Feigin et al.8 state the importance of the immediate launch of prevention programs, control of blood pressure, and above all tobacco control interventions, at populational and individual levels, along with improvements in the access to primary health care in low‑income countries. However, a common modiiable factor, the stress, caused by work and the daily life of people and which has a strong relation with hypertension26 is not the strategical focus of the ight of health services, maybe due to its being a behavioral efect inluenced by many determinants such as socioeconomic, educational, and cultural levels, not restricted to the biological one27, requiring a joint action of multisectoral policies that change the life realities.
women with sequelae by stroke in a research carried out in Basic Health Units, a fact also highlighted by Heuschmann et al.21 in London. This contributes to conirm there is no need to develop a strategy directed to the speciic subpopulation of men and women regarding the measure of therapeutic adherence and behavioral change.
It is revealed in Brazil a progressive increase of the HIS after 40 years of age. Elderly aged 80 years old or older are almost 20 times more likely to have a stroke than those who are 40 to 49 years old. Heuschmann et al.14 identiied that the incidence of stroke worldwide also increases progressively each decade of life, as well as Liu et al.15 and Palm et al.28. In this situation, difer‑ ently from the issue raised for gender, it seems important to develop actions with a diferent focus for the age ranges from the fourth decade of life on as for the treatment, as well as the lifestyle.
When analyzing the Brazilian FU, there was a decrease in the incidence of HIS on most of them, being Goiás, Roraima, and Ceará are the most stable ones. Such fact may be related to the assistencial quality of the Hiperdia, to the low hospital assistance in these FU or even to problems related to the quality of SIH/SUS in these states.
There seems to be no regionalization in the reduction of hospitalizations, considering that we veriied a decline in the incidence of HIS practically in all FU and the Hiperdia is a nationwide program. However, for a greater understanding of the characteristics of the program, which have greater impact in the decline of the IS, it is necessary a deeper analy‑ sis if the indicators of structure and process of this program, which was not our objective in this study. This, maybe, will potentialize the efects of the program, such as coverage and adhesion, when identifying fragility in its working.
In relation to the indings of the proportion of hospital mortality, there was observed a statistically signiicant slight decrease, though trivial from the epidemiological point of view. Thus, it is a strong thought that the Hiperdia did not change the proile of hospital mortality by IS. Such scenario may occur, once that the program has the objective of acting in the prevention of the cerebrovascular events and, once occurring the IS, it would need pre‑ and intra‑hospital assistance in time and quality for the resolution or minimization of the damage, such as death. Therefore, the reduction of hospital mortality is more related to the quality of the emergency support to the ones afected by the IS, once that immediate actions of early diagnosis and thrombolytic therapy reduce deaths and the severe sequelae.
primary attention to new cases. Finally, Kuster et al.31 veriied that the cases of IS admitted in hospitals are from emergency services such as the SAMU with lower time of neuroim‑ aging entry‑diagnosis and also higher frequency of thrombolytic therapy.
Another relevant aspect in hospital mortality by IS is the existence of services of the radio‑ logical diagnosis. In the case of the IS, the performing of computerized tomography (CT) allows the rapid and acute diagnosis of its existence. Rolim32 observed the importance of per‑ forming a tomography during hospital admission for the diagnosis and reduction of mortality by IS. Rolim and Martins33 also mentioned that only 22.3% of hospitalizations by stroke in Brazil performed CT scans. Rink and Khanna34 also considered that the practically stable mor‑ tality may be related to inadequacy of hypertensive therapies in controlling, in some situation, the blood pressure and also the lack of hospital measures to reverse the ischemic condition.
In the present study, it was observed an increase in the mortality directly related to the increasing age, in both gender, corroborating the results of Lui et al.15. Chen et al.35 observed that the mortality by stroke among young people has been kept stable in both low‑ and high‑income countries. The stability here observed among individuals between 0 and 14 years of age may be explained by the diiculty of diagnosis of stroke among children36 and, therefore, the absence of timely clinical decision making to reverse the case. In turn the instability in mortality of elderly aged 80 years old or older, it raises the possibility that these individuals have great vascular fragility and that small cerebrovascular events already produce signiicant deterioration of the nervous system, which makes the containment strategies little eicient for ongoing cerebrovascular events.
Among all the Brazilian FU, Roraima stands out, which showed stable trends for the pro‑ portion of hospital mortality as in the incidence of HIS. It is suggested that the low hospital assistance of these FU may be the source of such stability or even low quality of the SIH/ SUS in the state health system. In general, Fernandes et al.37 veriied the non‑existence of mortality by stroke among hospitals in Northeast and Southeast Brazil.
Our study analyzed the evolution of IS in Brazil within the last 15 years through the HAA in SUS. As a result, the are some limitations, namely: despite the hospitals accredited by SUS covering around 80% of hospitalizations in the country, there is a considerable portion of the population, which is assisted by health insurance, not entering the statistics of the SIH; the indicators of struc‑ ture and Hiperdia process were not analyzed, to estimate the inluence of such components is more relevant to mitigate the occurrence of IS. However, these limitations do not minimize the plausibility of studies that used the SIH as a data source, as this is a mean to indirectly evaluate the assistencial quality of the services of primary care as well as hospital care, directly38.
CONCLUSION
1. Avenue G. Recommendations on stroke prevention, diagnosis, and therapy. Report of the WHO Task Force on Stroke and other Cerebrovascular Disorders. Stroke 1989; 20(10): 1407‑31.
2. Langhorne P, Bernhardt J, Kwakkel G. Stroke rehabilitation. Lancet 2011; 377(9778): 1693‑702.
3. Pereira ABNG, Alvarenga H, Pereira Júnior RS, Barbosa MTS. Prevalência de acidente vascular cerebral em idosos no Município de Vassouras, Rio de Janeiro, Brasil, através do rastreamento de dados do Programa Saúde da Família. Cad Saúde Pública 2009; 25(9): 1929‑36.
4. World Health Organization. Deaths from stroke. In: The atlas of heart disease and stroke. Mackay J, Menash GA (editors). Geneva: WHO; 2004.
5. Goldstein LB, Bushnell CD, Adams RJ, Appel LJ, Braun LT, Chaturvedi S, et al. Guideline for the primary prevention of stroke: a guideline for healthcare professionals from the American Heart Association/ American Stroke Association. Stroke 2011; 42: 517‑84.
6. Lotufo PA, Bensenor IM. Stroke mortality in São Paulo (1997‑2003): a description using the tenth revision of the International Classiication of Diseases. Arq Neuro‑Psiquiatr 2004; 62(4): 1008‑11.
7. Curioni C, Cunha CB, Veras RP, André C. The decline in mortality from circulatory diseases in Brazil. Rev Panam Salud Publica 2009; 25(1): 9‑15.
8. Feigin VL, Lawes CM, Bennett DA, Barker‑Collo SL, Parag V. Worldwide stroke incidence and early case fatality reported in 56 population‑based studies: a systematic review. Lancet Neurol 2009; 8(4): 355‑69.
9. Lopes JM, Medeiros JLA, Oliveira KBA, Dantas FG. Acidente vascular cerebral isquêmico no Nordeste brasileiro : uma análise temporal de 13 anos de casos de hospitalização. ConScientiae Saúde 2013; 12(2): 321‑8.
10. Buntinx F, Devroey D, Van Casteren V. The incidence of stroke and transient ischaemic attacks is falling: a report from the Belgian sentinel stations. Br J Gen Pract 2002; 52(483): 813‑7.
11. Garritano CR, Luz PM, Pires MLE, Barbosa MTS, Batista KM. Análise da tendência da mortalidade por acidente vascular cerebral no Brasil no Século XXI. Arq Bras Cardiol 2012; 98(6): 519‑27.
12. Leite HR, Nunes APN, Cor rêa CL. Perf il epidemiológico de pacientes acometidos por acidente vascular encefálico cadastrados na Estratégia de Saúde da Família em Diamantina, MG. Fisioter Pesq 2009; 16(1): 34‑9.
13. Feigin VL, Lawes CM, Bennett DA, Anderson CS. Stroke epidemiology: a review of population‑based
studies of incidence, prevalence, and case‑fatality in the late 20th century. Lancet Neurol 2003; 2(1): 43‑53.
14. Heuschmann PU, Di Carlo A, Bejot Y, Rastenyte D, Ryglewicz D, Sarti C et al. Incidence of stroke in Europe at the beginning of the 21st century. Stroke 2009; 40(5): 1557‑63.
15. Liu M, Wu B, Wang WZ, Lee LM, Zhang SH, Kong LZ. Stroke in China: epidemiology, prevention, and management strategies. Lancet Neurol 2007; 6(5): 456‑64.
16. Rabetti AC, Freitas SFT. Avaliação das ações em hipertensão arterial sistêmica na atenção básica. Rev Saúde Pública 2011; 45(2): 258‑68.
17. Piccini RX, Facchini LA, Tomasi E, Siqueira FV, Silveira DS, Thumé E, et al. Promoção, prevenção e cuidado da hipertensão arterial no Brasil. Rev Saúde Pública 2012; 46(3): 543‑50.
18. Latorre MRDO, Cardoso MRA. Análise de séries temporais em epidemiologia : uma introdução sobre os aspectos metodológicos. Rev Bras Epidemiol 2001; 4(3): 145‑52.
19. Sridharan SE, Unnikrishnan JP, Sukumaran S, Sylaja PN, Nayak SD, Sarma PS, et al. Incidence, types, risk factors, and outcome of stroke in a developing country: the Trivandrum Stroke Registry. Stroke 2009; 40(4): 1212‑8.
20. Judd SE, Kleindorfer DO, McClure LA, Rhodes JD, Howard G, Cushman M, et al. Self‑report of stroke, transient ischemic attack, or stroke symptoms and risk of future stroke in the REasons for Geographic And Racial Diferences in Stroke (REGARDS) Study. Stroke 2013; 44(1): 55‑60.
21. Heuschmann PU, Grieve AP, Toschke AM, Rudd AG, Wolfe CD. Ethnic group disparities in 10‑year trends in stroke incidence and vascular risk factors: the South London Stroke Register (SLSR). Stroke 2008; 39(8): 2204‑10.
22. Rothwell PM, Coull AJ, Giles MF, Howard SC, Silver LE, Bull LM, et al. Change in stroke incidence, mortality, case‑fatality, severity, and risk factors in Oxfordshire, UK from 1981 to 2004 (Oxford Vascular Study). Lancet 2004; 363(9425): 1925‑33.
23. Turin TC, Kita Y, Rumana N, Nakamura Y, Takashima N, Ichikawa M, et al. Ischemic stroke subtypes in a Japanese population: Takashima Stroke Registry, 1988‑2004. Stroke 2010; 41(9): 1871‑6.
24. Khoury JC, Kleindorfer D, Alwell K, Moomaw CJ, Woo D, Adeoye O, et al. Diabetes mellitus: a risk factor for ischemic stroke in a large biracial population. Stroke 2013; 44(6): 1500‑4.
25. Medonça LBA, Lima FET, Oliveira SKP. Acidente vascular encefálico como complicação da hipertensão arterial: quais são os fatores intervenientes? Esc Anna Nery 2012; 16(2): 340‑6.
26. Bergh C, Udumyan R, Fall K, Nilsagård Y, Appelros P, Montgomery S. Stress resilience in male adolescents and subsequent stroke risk: cohort study. J Neurol Neurosurg Physichiatry 2014; 85(12): 1331‑6.
27. Lazzarino AI, Harmer M, Stamatakis E, Steptoe A. Low socioeconomic status and psychological distress as synergistic predictors of mortality from stroke and coronary heart disease. Psychosom Med. 2013; 75(3): 311‑6.
28. Palm F, Urbanek C, Rose S, Buggle F, Bode B, Hennerici MG, et al. Stroke incidence and survival in Ludwigshafen am Rhein, Germany: the Ludwigshafen Stroke Study (LuSSt). Stroke 2010; 41(9): 1865‑70.
29. Machado CV, Salvador FGF, O’Dwyer G. Serviço de Atendimento Móvel de Urgência : análise da política brasileira. Rev Saúde Pública 2011; 45(3): 519‑28.
30. Luz CC, Junger WL, Cavalcanti LT. Análise da atenção pré‑hospitalar ao acidente vascular cerebral e ao infarto agudo do miocárdio na população idosa de Minas Gerais. Rev Assoc Med Bras 2010; 56(4): 452‑7.
31. Kuster GW, Bueno Alves M, Cendoroglo Neto M, Silva GS. Determinants of emergency medical services use in a Brazilian population with acute ischemic Stroke. J Stroke Cerobrovasc Dis 2013; 22(3): 244‑9.
32. Rolim CLRC. Avaliação da efetividade do tratamento hospitalar do acidente vascular cerebral agudo no sistema único de saúde ‑ SUS ‑ utilização da mortalidade
hospitalar como indicador de desempenho [dissertação de mestrado]. Rio de Janeiro: Escola nacional de Saúde Pública Sergio Arouca; 2009.
33. Rolim CLRC, Martins M. O uso de tomografia computadorizada nas internações por acidente vascular cerebral no Sistema Único de Saúde no Brasil. Rev Bras Epidemiol 2012; 15(1): 179‑87.
34. Rink C, Khanna S. MicroRNA in ischemic stroke etiology and pathology. Physiol Genomics 2011; 43(10): 521‑8.
35. Chen PC, Chien KL, Chang CW, Su TC, Jeng JS, Lee YT, et al. More hemorrhagic and severe events cause higher hospitalization care cost for childhood stroke in Taiwan. J Pediatr 2008; 152(3): 388‑93.
36. Buerki S, Roellin K, Remonda L, Mercati DG, Jeannet PY, Keller E, Luetschg J, et al. Neuroimaging in childhood arterial ischaemic stroke: evaluation of imaging modalities and aetiologies. Dev Med Child Neurol 2010; 52(11): 1033‑7.
37. Fernandes TG, Goulart AC, Campos TF, Lucena NM, Freitas KL, et al. Early stroke case‑fatality rates in three hospital registries in the Northeast and Southeast of Brazil. Arq Neuropsiquiatr 2012; 70(11): 869‑73.
38. Bittencourt SA, Camacho LAB, Leal MC. O Sistema de Informação Hospitalar e sua aplicação na saúde coletiva. Cad Saúde Pública 2006; 22(1): 19‑30.
Received on: 12/17/2014