Fronto-striatal atrophy correlates
of neuropsychiatric dysfunction in
frontotemporal dementia (FTD) and
Alzheimer’s disease (AD)
Dong Seok Yi1, Maxime Bertoux2, Eneida Mioshi3, John R. Hodges4, Michael Hornberger4
ABSTRACT. Behavioural disturbances in frontotemporal dementia (FTD) are thought to reflect mainly atrophy of cortical regions. Recent studies suggest that subcortical brain regions, in particular the striatum, are also significantly affected and this pathology might play a role in the generation of behavioural symptoms. Objective: To investigate prefrontal cortical and striatal atrophy contributions to behavioural symptoms in FTD. Methods: One hundred and eighty-two participants (87 FTD patients, 39 AD patients and 56 controls) were included. Behavioural profiles were established using the Cambridge Behavioural Inventory Revised (CBI-R) and Frontal System Behaviour Scale (FrSBe). Atrophy in prefrontal (VMPFC, DLPFC) and striatal (caudate, putamen) regions was established via a 5-point visual rating scale of the MRI scans. Behavioural scores were correlated with atrophy rating scores. Results: Behavioural and atrophy ratings demonstrated that patients were significantly impaired compared to controls, with bvFTD being most severely affected. Behavioural-anatomical correlations revealed that VMPFC atrophy was closely related to abnormal behaviour and motivation disturbances. Stereotypical behaviours were associated with both VMPFC and striatal atrophy. By contrast, disturbance of eating was found to be related to striatal atrophy only. Conclusion: Frontal and striatal atrophy contributed to the behavioural disturbances seen in FTD, with some behaviours related to frontal, striatal or combined fronto-striatal pathology. Consideration of striatal contributions to the generation of behavioural disturbances should be taken into account when assessing patients with potential FTD. Key words: frontotemporal dementia, Alzheimer’s disease, neuropsychiatric symptoms, striatum.
CORRELATOS DE ATROFIA FRONTO-ESTRIATAL E DISFUNÇÃO NEUROPSIQUIÁTRICA EM DEMÊNCIA FRONTOTEMPORAL (DFT) E DOENÇA DE ALZHEIMER (DA)
RESUMO. Distúrbios de comportamento na demência frontotemporal (DFT) parecem refletir principalmente atrofia de regiões corticais. Estudos recentes sugerem que regiões cerebrais subcorticais, em particilar o estriado, são também são significativamente afetados e esta patologia pode ter um papel na geração dos sintomas comportamentais. Objetivo: Investigar a contribuição da atrofia cortical prefrontal e estriatal para os sintomas da DFT. Métodos: 182 participantes (87 pacienjtes com DFT, 39 pacientes com DA e 56 controles) foram incluídos. Os perfis cognitivos foram estabelecidos usando o Cambridge Behavioural Inventory Revised (CBI-R) e Frontal System Behaviour Scale (FrSBe). Atrofia nas regiões prefrontal (VMPFC, DLPFC) e estriatal (caudado e putamen) foi estabelecida através de uma escala visual de 5 pontos nas imagens de ressonância magnética. Os escores de comportamento foram correlacionados aos escores de atrfoia.
Resultados: Os resultados comportamentais e de atrofia demonstraram que os pacientes estavam significativamente
mais comprometidos do que os controles, com os pacientes com DFT mais gravemente afetados. As correlações anátomo-comportamentais revelaram que a atrofia do VMPFC foi intimamente relacionada ao comportamento anormal e distúrbios de motivação. Comportamentos estereotipados estiveram associados com atrofia do VMPFC e estriatal. Em contraste, distúrbios da alimentação foram relacionados somente a atrofia estriatal. Conclusão: A atrofia frontal e estriatal contribuíram para os distúrbios vistos na DFT, com alguns comportamentos relacionados a patologia frontal, estriatal ou combinadas. Considerações quanto à contribuição estriatal na gênese dos distúrbios de comportamento devem ser levados em conta quando se avalia pacientes com DFT em potencial.
Palavras-chave: demência fronto-temporal, doença de Alzheimer, sintomas neuropsiquiátricos, estriado.
1Neuroscience Research Australia, Sydney, Australia. 2University Pierre and Marie Curie – Paris VI, Sorbonne Universités, Paris, France. 3Neuroscience Research
Australia, Sydney, Australia. School of Medical Sciences, University of New South Wales, Sydney, Australia. 4Neuroscience Research Australia, Sydney, Australia.
ARC Centre of Excellence in Cognition and its Disorders, Sydney, Australia. School of Medical Sciences, University of New South Wales, Sydney, Australia.
Michael Hornberger. Neuroscience Research Australia, Cnr Barker & Easy Street, Randwick, NSW 2031, Sydney, Australia. E-mail: [email protected]
Disclosure: The authors report no conflicts of interest.
INTRODUCTION
F
rontotemporal dementia (FTD) can be divided into three clinical subtypes: behavioural frontotempo-ral dementia (bvFTD), semantic dementia (SD) and progressive non-luent aphasia (PNFA). Patients with bvFTD, the most prevalent subtype, present with pro-found alteration in personality, social conduct and be-haviour, which have been related to atrophy of prefron-tal brain areas, particularly the ventromedial prefronprefron-tal cortex (VMPFC) but also anterior temporal atrophy.1-4he clinical presentation of SD is characterized by anomia and impaired word comprehension5 with
con-comitant asymmetrical rostral temporal lobe atrophy.6
Finally, PNFA presents with expressive language dei-cits, characterized by efortful speech production, pho-nologic and grammatical errors,7 and atrophy in the left
peri-Sylvian region.8 Although FTD is traditionally
asso-ciated with cortical atrophy, which is thought to be the major determinant of their symptoms, there is growing evidence for concomitant involvement of subcortical brain regions that might be an important contributor to the symptoms. For example, a post-mortem study9
sug-gested that basal ganglia structures are afected from an early disease stage. At more advanced stages, basal ganglia degeneration was very evident as indicated by grossly dilated frontal horns of the lateral ventricles. hese pathological indings were conirmed in vivo10-13
using MRI volumetrics demonstrating striatal atrophy especially in those with bvFTD and PNFA.11,13,14
hese changes suggest a possible role of striatal atrophy in the genesis of symptoms in FTD. Previous studies investigating the relationship between striatal dysfunctions and FTD symptomatology have shown to correlation with disinhibition,14,15 functional disability10
and binge eating.16 Interestingly, the right side of the
striatum has been mostly related to behavioural distur-bances13,14 such as eating disorders,15 apathy,17,18 altered
empathy,19 disinhibition17 and stereotypies,20 while the
left striatum has been linked to cognitive impairments, such as language and executive dysfunctions.13,21
Overall, these indings suggest that behavioural symptoms may be associated with cortical and subcorti-cal pathology in FTD. Surprisingly, to our knowledge, no study has investigated the efects of both prefrontal cor-tex and striatal atrophy on behavioural disturbances in FTD. Previous studies4 investigated whole brain
corre-lates of behavioural disturbances, which were therefore exploratory. he current study aims to focus the contri-bution of the PFC and striatal atrophy in particular on behavioural disturbances in FTD. In addition, instead of using quantitative imaging methods as previously
em-ployed, we use a simple visual atrophy rating scale. Such ratings scales have the advantage that single patient coronal scans can be assessed in the clinic, without the need to employ sophisticated imaging analysis. hus, establishment of the relation between symptoms and visual atrophy ratings, allows clinicians to corroborate the neural correlates of behavioural symptoms on the spot in the clinic for each patient. We predict that most behaviours would be correlated with prefrontal cortex atrophy, but that apathy and disinhibition might also show an association with striatal pathology.
METHODS
Participants. One hundred and eighty-two participants were selected from the FRONTIER Clinical Database resulting in a sample of 44 bvFTD, 20 SD, 23 PNFA, 39 AD patients and 56 controls. All FTD patients met the current consensus diagnostic criteria for FTD7,22 while
AD patients met the revised NINCDS-ADRDA diagnos-tic criteria for probable AD.23
Patient’s disease severity was assessed with the Frontier Severity Rating Scale (FRS) scale.24 Rasch
scores of the Frontotemporal dementia Rating Scale (FRS) (Mioshi REF) were used as markers of disease se-verity. he FRS is an assessment tool measuring change in everyday abilities (e.g. ability to use a telephone, taking correct medications, eating behaviours) and be-havioural symptomatology (e.g., loss of afection and impulsivity). he FRS provides an index of dementia se-verity (very mild, mild, moderate, severe, very severe or profound) and is able to show difering rates of disease progression in FTD subtypes. A total raw score of 30 can be obtained on the FRS. Raw scores are irst converted into percentage scores to respect a patient’s premorbid abilities (e.g. no points are lost if the person has never cooked as part of his or her routine prior to disease on-set). Percentage scores are then converted using a logit table into a logit score, which range from 5.39 (normal) to –6.66 (profound impairment). Logit scores aid in spreading the patients across the diferent severity cat-egories and are based on a hierarchical analysis of item diiculty on the FRS.
Importantly, a drop of 1 logit score on the FRS there-fore does not easily translate to either a change in the stage of dementia severity or a loss of 1 (out of 30) items on the FRS. Interpretation of a change in logit scores depends on the initial severity of dementia.
All patients underwent a multidisciplinary assess-ment including clinical interview and examination by a senior neurologist (JRH), neuropsychological test-ing, structural MRI neuroimagtest-ing, as well as the carer’s assessment of patient’s behaviours. he study was ap-proved by the University of New South Wales Human Research Ethics Advisory panel D (Biomedial, ref. #10035).
Behavioural and cognitive assessment. General cognition in all patients and controls was assessed via the the Adden-brooke’s Cognitive Examination Revised (ACE-R).25 he
ACE-R is a 100 point evaluation that assesses 5 cogni-tive domains: attention/orientation, memory, luency, language and visuospatial.
Behavioural disturbances in the patients were as-sessed via: [1] Cambridge Behavioural Inventory Re-vised (CBI-R), which is an 81 item questionnaire that assesses cognitive, behavioural and afective symptoms as well as activities of daily living and evaluates various functional/behavioural domains using a 5 point rating scale.26 he following scores of the CBI-R were evaluated
and analysed: abnormal behaviour, motivation, stereo-typic and motor behaviour, mood, eating habits and be-liefs; [2] Frontal System Behaviour Scale (FrSBe), which is a 46 item rating scale measuring apathy, disinhibition and dysexecutive functioning using a 5-point Likert scale completed by both patients and their carers.27
For both questionnaires, only data provided by the carer at the irst clinic presentation was included in the analyses.
Image acquisition & analysis. All patients underwent the same imaging protocol with a whole-brain T1-weighted images using a 3-tesla Philips MRI scanner with stan-dard quadrature head coil (coronal orientation, matrix 256×256, 200 slices, 1×1 mm2 in-plane resolution, slice
thickness 1 mm, TE/TR=2.6/5.8 ms, lip angle α=19º). One rater (DSY), blind to the clinical diagnosis, rated T1 coronal MRIs based on a visual rating scale devel-oped by Davies and colleagues28 using a standard
tem-plate against which to judge atrophy. he rater showed high reliability for the scoring of a MRI training set of 30 scans (Cronbach alpha=0.9). In brief, the rating method involved assessments of three coronal slices: the irst at the level of the anterior temporal pole and the second at the level of the insula and third at the level of the poste-rior fornix. Firstly, two prefrontal regions were scored: ventromedial (VMPFC) and dorsolateral (DLPFC) pre-frontal cortex. he total prepre-frontal cortex (PFC) atro-phy was calculated by summing the scores of the two sub regions. he prefrontal rating method was identical to one of our previous studies.29 Based on our
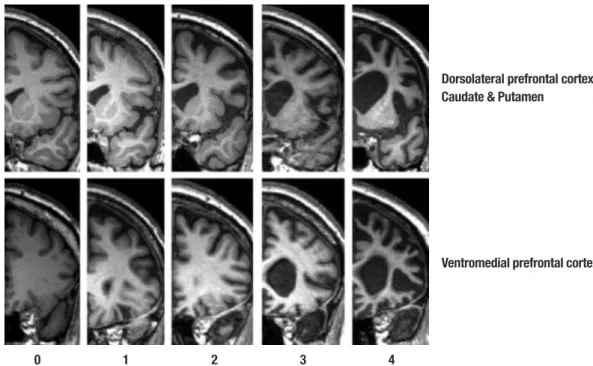
prefron-tal rating method, we also developed visual ratings for striatal regions: caudate and putamen (Figure 1). Total striatum score was calculated by summing caudate and
0 1 2 3 4
Figure 1. Shows the array of MR reference images and rating criteria employed in judging atrophy in the frontal lobe brain regions. Rating criteria range from 0=no atrophy to 4=severe atrophy for the rated brain regions.
Dorsolateral prefrontal cortex, Caudate & Putamen
Figure 2. Shows boxplots for atrophy ratings in [A] VMPFC, [B] DLPFC, [C] caudate and [D] puta-men brain regions across all participant groups. The dotted line indicates the threshold from which on a rating is considered to be definite atrophic. Boxplot whiskers indicate 5-95% confidence intervals.
A B
C D
A B
C D
putamen atrophy scores. Atrophy within each region was rated on a 5-point Likert scale ranging from 0 to 4 (0=normal; 4=severe atrophy). he VMPFC was rated on the coronal image where the anterior pole is irst visible. Dorsolateral frontal as well as caudate head and puta-men regions were rated on the second coronal slice. his image was the most posterior slice through the tempo-ral pole without visible connection between frontal and temporal lobes. he total prefrontal and striatal atrophy was obtained by averaging the atrophy ratings from the sub regions.
Statistics. Data were analysed using SPSS 18.0 (IBM Inc., USA). Parametric demographic (age, education, disease severity), neuropsychological (ACE-R), behavioural (CBI, FrSBe) and scan ratings (MRI) data were compared across the 5 groups (AD, bvFTD, SD, Control and PNFA) via one way ANOVAs followed by Tukey post-hoc tests. A priori, variables were plotted and checked for nor-mality of distribution by Kolmogorov Smirnov tests. Variables revealing non-normal distributions were log transformed and appropriate log values were used in
the analyses. Correlational analyses were corrected for multiple comparison via Bonferroni corrections.
RESULTS
Demographics and background. Comparisons across the ive groups (Table 1) revealed a signiicant diference in age (p<0.01) but not education or gender distribution (all p’s>0.1). Post-hoc analysis showed that bvFTD pa-tients and controls difered from each other (p<0.01) with bvFTD being signiicantly younger than controls. Age was therefore entered as a covariate in all remaining analyses.
here were signiicant group efects for ACE-R and FRSRasch scores (p<0.001 for all). Follow-up post-hoc comparisons showed signiicantly diferent in ACE-R scores between the controls and patient groups (p< 0.001 for all). In addition, SD performed poorest across all groups (p<0.01 for all) due to their pervasive seman-tic impairment.
Behaviour. For the CBI-R, there were main efects of group for all included scores (p<0.001 for all). Not
sur-Table 1. Average and standard deviations (SD) of demographics and cognitive tests
Demographics & cognitive tests bvFTD SD PNFA AD Control F value
N 44 20 23 39 56
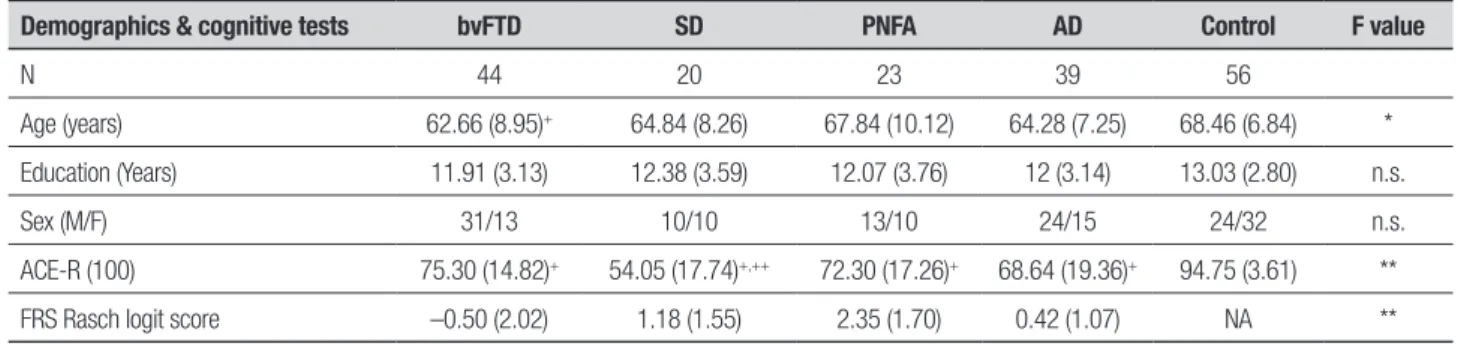
Age (years) 62.66 (8.95)+ 64.84 (8.26) 67.84 (10.12) 64.28 (7.25) 68.46 (6.84) *
Education (Years) 11.91 (3.13) 12.38 (3.59) 12.07 (3.76) 12 (3.14) 13.03 (2.80) n.s.
Sex (M/F) 31/13 10/10 13/10 24/15 24/32 n.s.
ACE-R (100) 75.30 (14.82)+ 54.05 (17.74)+,++ 72.30 (17.26)+ 68.64 (19.36)+ 94.75 (3.61) **
FRS Rasch logit score –0.50 (2.02) 1.18 (1.55) 2.35 (1.70) 0.42 (1.07) NA **
n.s.: not significant; *p<0.01; **p<0.001; +significantly different from controls; ++significantly different from all other patient groups.
Table 2. Averages and standard deviations (SD) of the behavioural questionnaires.
Behaviour bvFTD SD PNFA AD Control F value
CBI Abnormal behaviour 9.60 (6)**,+,++ 4.80 (5)** 1.78 (4) 2.92 (4) 0.74 (2) *
Motivation 12.88 (6)**,+,++ 6.75 (6)** 5.04 (4)** 6.66 (6)** 0.48 (1) *
Stereotypical behaviour 8.57 (5)**,+,++ 6.50 (6)**,+,++ 2.35 (3) 3.34 (4)** 1.04 (2) *
Mood 5.21 (3)**,+,++ 3.40 (3)** 2.52 (3)** 3.34 (3)** 0.43 (1.95) *
Eating 7.00 (4)**,+,++,§ 2.45 (3) 0.87 (2) 2.24 (3) 0.66 (1) *
Beliefs 1.22 (2)**,++ 0.50 (1) 0.04 (0) 0.74 (2) 0.00 (0.00) *
FrSBe Apathy 87.00 (22)+,++ 79.50 (21) 63.18 (16) 67.86 (17) – *
Disinhibition 75.59 (20)+,++ 75.41 (28)+,++ 51.82 (12) 56.46 (16) – *
Executive 81.03 (20)+,++ 75.65 (20) 60.41 (14) 69.29 (14) – *
prisingly, bvFTD patients were the most impaired for all behaviours showing signiicant efects compared to all other patient groups (p<0.05 for all). he SD patients showed abnormal behaviour and stereotypical behav-iour (p<0.05 for all). he remaining patient groups (PNFA, AD) did not difer from controls or each other on any CBI score.
here were also signiicant group diferences (p< 0.001 for all) for all categories of the FrSBe score. Similar to the CBI indings, bvFTD scored highest for all FrSBe scores (p<0.05 for all) and SD patient were signiicantly impaired for the disinhibition subscore (p<0.05) com-pared to the remaining groups.
MRI visual ratings. Comparisons across prefrontal (VMP-FC, DLPFC) and striatal (caudate, putamen) regions revealed signiicant group diferences for all scores (p<0.001 for all).
For the VMPFC, post-hoc tests showed that bvFTD was the only group with signiicant atrophy (p<0.05 for all). By contrast, all patient groups showed DLPFC at-rophy compared to controls (p<0.05) but they were not signiicant from each other (p>0.05 for all).
For the striatal regions, post-hoc tests revealed cau-date atrophy in all patient groups compared to controls (p<0.000 for all). he bvFTD patients showed the high-est atrophy ratings which were signiicantly higher than AD (p<0.01) and trending to signiicance compared to SD (p=0.065). A similar picture emerged for the puta-men ratings, with bvFTD patients having the more sig-niicant putaminal atrophy compared to controls and AD (p<0.01 for all) and marginal more signiicant atro-phy compared to PNFA (p=0.067).
Atrophy-behaviour correlations. Abnormal behaviour and motivation dysfunction were correlated with VMPFC atrophy (r(180)=0.34; p<0.001; r(180)=0.41; p<0.001; respectively). By contrast, there were no associations between any of the behaviours measured and atrophy of the DLPFC, even when controlling for VMPFC atrophy. Interestingly, stereotypical behaviour was correlated with atrophy of the VMPFC, as well as the caudate and putamen (r(180)=0.39; p<0.001; r(180)=0.23; p<0.05; r(180)=0.25; p<0.05; respectively). he only behavioural disturbance that was exclusively associated with the striatum was disturbed eating, which correlated signii-cantly with caudate and putamen atrophy (r(180)=0.26; p<0.025; r(180)=0.22; p<0.05; respectively).
To further tease apart the striatal and VMPFC contri-butions to stereotypical behaviours, we conducted par-tial correlations controlling for VMPFC atrophy. he
re-sults show that putaminal atrophy was still signiicantly correlated with stereotypical behaviour (r(180)=0.16; p<0.05;, whereas there was only a signiicant trend for the caudate (p=0.064).
DISCUSSION
Our indings suggest that cortical and striatal pathology in FTD may have diferential roles in the genesis of the behavioural symptoms which characterise FTD. While apathy was found to be strongly associated with VMPFC atrophy, stereotypical behaviours were related to both cortical and striatal pathology (caudate and putamen) and eating disturbance was exclusively associated with basal ganglia changes. Interestingly, these indings did not fulil our predictions completely. Although most be-havioural symptoms were associated with PFC atrophy, apathy and disinhibition did not show striatal atrophy correlates.
In keeping with prior studies, patients with bvFTD showed the highest rate of all behavioural disturbanc-es30,31 although those with SD also demonstrated
ste-reotypical behaviours.32,33 he bvFTD group had the
greatest atrophy ratings for all prefrontal cortex regions (VMPFC and DLPFC), with particular involvement of the former region compared to all other groups.29,34 By
contrast, the degree of involvement of the DLPFC was equal across dementia groups including AD which sug-gests that DLPFC atrophy has little diagnostic utility. Moreover, patients with all three FTD subtypes as well as AD showed atrophy of the striatum with a gradua-tion in that those with bvFTD showed the most severe involvement followed by PNFA and SD. hese indings conirms most previous results,9-11,14 although striatal
atrophy has not been a universal inding in SD.13,35
Stereotypical behaviours were related to both stria-tal and prefronstria-tal atrophy ratings which indicate that pathology in either region may be important in the pathogenesis of these behaviours. Josephs et al.20 in
a pathology-based study also showed that frontal and striatal atrophy are were associated with stereotypies in FTD. Stereotypical behaviours are, however, complex, ranging from simple motor stereotypies, such as clap-ping, foot-tapclap-ping, and utterances, to more complex behaviours, including wandering or rearranging objects. It is currently not clear whether all these behavioural changes can be attributed to a common neural origin. Future investigations should elucidate whether simple versus complex stereotypies rely on the same neural regions and the speciic roles of prefrontal vs. striatal regions.
dysfunction and abnormal behaviours were related to VMPFC atrophy. Previous studies have also implicated the VMPFC in disturbances of motivation17 although
the exact role of this region in the complex processes that govern goal setting; goal achievement and reward remain unclear. he VMPFC also plays a crucial role in the maintenance of normal social and emotional behav-iour36 a full discussion of which is beyond the scope of
this paper (for review see37).
Finally, changes in eating, which tend to manifest as increased appetite with reduced satiety and a craving for sweet food, was correlated with striatal rather than cor-tical atrophy. Eating disturbances have been previously found to be associated with subcortical dysfunctions in FTD, notably changes in satiety that have been linked to hypothalamic pathology in FTD38 and binge eating,
which has been related to striatal and cortical atrophy,16
It is possible therefore that the correlation in our study
was driven more by stereotypic changes in feeding. he exact role of striatal versus other subcortical structures is clearly worthy of further investigation.
In summary, our indings show that the striatum is extensively involved in FTD symptomatology, par-ticularly in the behavioural disturbances that typify this disabling disorder. he interaction of prefrontal and striatal regions is crucial in the maintenance of normal behaviour. It is advisable to take pathology of subcorti-cal regions into account when assessing patients with potential FTD, and bvFTD in particular. Our indings require conirmation and elucidation using quantita-tive MRI methods combined with more detailed evalu-ation of aspects of symptoms such as the stereotypic and eating behaviours. Further studies should as well investigate the diferential involvement of left/right striatal structures in both behavioural and cognitive disturbances.
REFERENCES
1. Seeley WW, Crawford R, Rascovsky K, et al. Frontal Paralimbic Net-work Atrophy in Very Mild Behavioural Variant Frontotemporal Demen-tia. Arch Neurol 2008;65:249-255.
2. Whitwell JL, Przybelski SA, Weigandet SD, et al. Distinct anatomical subtypes of the behavioural variant of frontotemporal dementia: a clus-ter analysis study. Brain 2009;132:2932-2946.
3. Seelaar H, Rohrer JD, Pijnenburg YAL, Fox NC, van Swieten JC. Clini-cal, genetic and pathological heterogeneity of frontotemporal dementia: a review. J Neurol Neurosurg Psychiatry 2010;82:476-486.
4. Rosen HJ, Gorno-Tempini ML, Goldmanet WP, et al. Patterns of brain atrophy in frontotemporal dementia and semantic dementia. Neurology 2002;58:198-208.
5. Hodges JR, Patterson K. Semantic dementia: a unique clinicopatho-logical syndrome. Lancet Neurol 2007;6:1004-1014.
6. Nestor PJ. Neuroimaging and other investigative findings: Cambridge University Press; 2007.
7. Gorno-Tempini ML, Hillis AE, Weintraub S, et al. Classification of prima-ry progressive aphasia and its variants. Neurology 2011;76:1006-1014. 8. Gorno-Tempini ML, Brambati SM, Ginexet V, et al. The logopenic/pho-nological variant of primary progressive aphasia. Neurology 2008;71: 1227-1234.
9. Broe M, Hodges JR, Schofield E, Shepherd CE, Kril JJ, Halliday GM. Staging disease severity in pathologically confirmed cases of frontotem-poral dementia. Neurology 2003;60:1005-1011.
10. Chow TW, Izenberg A, Binnset MA, et al. Magnetic resonance imaging in frontotemporal dementia shows subcortical atrophy. Dement Geriatr Cogn Disord 2008;26:79-88.
11. Looi JC, Lindberg O, Zandbelt BB, et al. Caudate nucleus volumes in frontotemporal lobar degeneration: differential atrophy in subtypes. AJNR Am J Neuroradiol 2008;29:1537-1543.
12. Looi JC, Svensson L, Lindberg O, et al. Putaminal volume in frontotem-poral lobar degeneration and Alzheimer disease: differential volumes in dementia subtypes and controls. AJNR Am J Neuroradiol 2009; 30:1552-1560.
13. Garibotto V, Borroni B, Agosti C, et al. Subcortical and deep cortical atrophy in Frontotemporal Lobar Degeneration. Neurobiol Aging 2011; 32:875-884.
14. Halabi C, Halabi A, Dean DL, et al. Patterns of Striatal Degeneration in Frontotemporal Dementia. Alzheimer Dis Assoc Disord 2013;27: 74-83.
15. Rosen HJ, Allison SC, Schauer GF, Gorno-Tempini ML, Weiner MW,
Miller BL. Neuroanatomical correlates of behavioural disorders in de-mentia. Brain 2005;128:2612-2625.
16. Woolley JD, Gorno-Tempini ML, Seeleyet WW, et al. Binge eating is as-sociated with right orbitofrontal-insular-striatal atrophy in frontotemporal dementia. Neurology 2007;69:1424-1433.
17. Zamboni G, Huey ED, Krueger F, Nichelli PF, Grafman J. Apathy and disinhibition in frontotemporal dementia: Insights into their neural cor-relates. Neurology 2008;71:736-742.
18. Eslinger PJ, Moore P, Antani S, Anderson C, Grossman M. Apathy in frontotemporal dementia: behavioral and neuroimaging correlates. Be-hav Neurol 2012;25:127-136.
19. Rankin KP, Gorno-Tempini ML, Allison SC, et al. Structural anatomy of empathy in neurodegenerative disease. Brain 2006;129:2945-2956. 20. Josephs KA, Whitwell JL, Jack Jr. CR, Anatomic correlates of stereo-typies in frontotemporal lobar degeneration. Neurobiol Aging 2008; 29:1859-1863.
21. Raczka KA, Becker G, Seese A, et al. Executive and behavioral deficits share common neural substrates in frontotemporal lobar degeneration - a pilot FDG-PET study. Psychiatry Res 2010;182:274-280.
22. Rascovsky K, Hodges JR, Knopman D, et al. Sensitivity of revised di-agnostic criteria for the behavioural variant of frontotemporal dementia. Brain 2011;134:2456-2477.
23. Dubois B, Feldman HH, Jacova C, et al. Research criteria for the di-agnosis of Alzheimer’s disease: revising the NINCDS-ADRDA criteria. Lancet Neurol 2007;6:734-746.
24. Mioshi E, Hsieh S, Savage S, Hornberger M, Hodges JR. Clinical stag-ing and disease progression in frontotemporal dementia. Neurology 2010;74:1591-1597.
25. Mioshi E, Dawson K, Mitchell J, Arnold R, Hodges JR. The Adden-brooke’s Cognitive Examination Revised (ACE R): a brief cognitive test battery for dementia screening. International Journal of Geriatric Psy-chiatry 2006;21:1078-1085.
26. Wear HJ, Wedderburn CJ, Mioshi E, et al. The Cambridge Behavioural Inventory Revised. Dement Neuropsychol 2008;2:102-107.
27. Malloy P, Grace J. A review of rating scales for measuring behavior change due to frontal systems damage. Cog Behav Neurol 2005;18: 18-27.
29. Hornberger M, Savage S, Hsieh S, Mioshi E, Piguet O, Hodges JR. Or-bitofrontal dysfunction discriminates behavioral variant frontotemporal dementia from Alzheimer’s disease. Dement Geriatr Cogn Disord 2010; 30:547-552.
30. Kipps CM, Davies RR, Mitchell J, Kril JJ, Halliday GM, Hodges JR. Clini-cal significance of lobar atrophy in frontotemporal dementia: applica-tion of an MRI visual rating scale. Dement Geriatr Cogn Disord 2007; 23:334-342.
31. Miller BL, Boeve BE (editors). The Behavioural Neurology of Dementia. Cambridge: Cambridge University Press; 2009.
32. Prioni S, Fetoni V, Barocco F, et al. Stereotypic behaviors in degenera-tive dementias. J Neurol 2012; 259:2452-2459.
33. Nyatsanza S, Shetty T, Gregory C, Lough S, Dawson K, Hodges JR. A study of stereotypic behaviours in Alzheimer’s disease and frontal and temporal variant frontotemporal dementia. J Neurol Neurosurg Psychia-try 2003;74:1398-1402.
34. Hornberger M, Geng J, Hodges JR. Convergent grey and white mat-ter evidence of orbitofrontal cortex changes related to disinhibition in behavioural variant frontotemporal dementia. Brain 2011;134:2502- 2512.
35. Looi JC, Walterfang M, Styner M, et al. Shape analysis of the neostria-tum in subtypes of frontotemporal lobar degeneration: neuroanatomi-cally significant regional morphologic change. Psychiatry Res 2011; 191:98-111.
36. Viskontas IV, Possin KL, Miller BL. Symptoms of frontotemporal demen-tia provide insights into orbitofrontal cortex function and social behavior. Ann N Y Acad Sci 2007;1121:528-545.
37. Zald DH, Rauch SL. The orbitofrontal cortex: Oxford University Press; 2006.
![Figure 2. Shows boxplots for atrophy ratings in [A] VMPFC, [B] DLPFC, [C] caudate and [D] puta- puta-men brain regions across all participant groups](https://thumb-eu.123doks.com/thumbv2/123dok_br/15188375.527031/4.892.198.652.104.495/figure-shows-boxplots-atrophy-ratings-caudate-regions-participant.webp)