www.elsevier.com/locate/jcis
Study of the growth process of in situ polyaniline deposited films
Silmar A. Travain
a, Nara C. de Souza
b,∗, Débora T. Balogh
c, José A. Giacometti
daInstituto de Ciências Exatas e Biológicas, Universidade Federal de Ouro Preto, 35400-000, Ouro Preto, MG, Brazil bInstituto Universitário do Araguaia, Universidade Federal de Mato Grosso, 78698-000, Pontal do Araguaia, MT, Brazil
cInstituto de Física de São Carlos, Universidade de São Paulo, CP 369 13566-970, São Carlos, SP, Brazil dFaculdade de Ciências e Tecnologia, Universidade Estadual Paulista, CP 467 19060-900, Presidente Prudente, SP, Brazil
Received 5 June 2007; accepted 7 August 2007 Available online 17 August 2007
Abstract
Polyaniline (PAni) thin films were deposited onto BK7 glass substrates using the in situ deposition technique. The control of the time and the aniline concentration in the PAni polymerization reaction on the film deposition allowed us to prepare films with different thickness, down to
∼25 nm. The film growth process was monitored by measuring the UV–vis spectra and the AFM height profiles of the film surface. The curves of adsorption kinetics were analyzed with the Avrami’s model, yielding an exponentn=3, thus indicating nucleation of spheroids at the initial stages of polymerization that grow through a diffusion process. AFM images of the surface height profiles corroborate this hypothesis, with spheroids growing with no preferred orientation during the in situ deposition.
2007 Elsevier Inc. All rights reserved.
Keywords:Polyaniline; Adsorption kinetics; Surface morphology
1. Introduction
Polyaniline (PAni) is a semiconducting polymer of great in-terest for technological applications as it can be easily synthe-sized and possesses good environmental stability under room conditions, redox reversibility, and an electric conductivity that can be increased by ten orders of magnitude upon doping[1,2]. The control in the fabrication of PAni thin films is also rele-vant because for many applications one may require organized molecular structures, with low roughness and high electric conductivity [3]. Thin films of PAni have been used in light-emitting diodes[4,5], biosensors[6,7], photoelectric cells[8], battery electrodes[9], and anti-static coating [10]. Deposition of a thin layer of PAni on substrates can be performed using several techniques, namely casting or spin coating[11], layer-by-layer technique (LbL)[12], Langmuir–Blodgett (LB) tech-nique [13], electrochemical deposition[14], and in situ poly-merization[15].
* Corresponding author.
E-mail address:[email protected](N.C. de Souza).
The simplest technique to prepare PAni films is spin-coating or casting from a PAni solution in solvents such asN -methyl-2-pyrrolidinone (NMP) [11]. Casting allows the fabrication of films with thickness of few micrometer but the thickness, roughness, and structural organization are not well controlled. The LbL technique is a simple technique for deposition of films with thickness of the order of a few nanometers, with alternated layers of different materials, but the production of thicker films is tedious and time consuming. The Langmuir– Blodgett technique produces films with distinct properties due to its layer-by-layer nature and with thickness in the nanometric scale, but deposition is not straightforward and in some cases a monolayer-forming substance must be used in conjunction[13], such as stearic acid for example, to transfer the Langmuir films onto a substrate.
McDiarmid and Epstein[15]have suggested an alternative technique to deposit high quality films onto solid substrates by immersion of a substrate in the aqueous solution during the chemical synthesis of PAni. This in situ deposition[16,17]
occurs in three steps: (i) the induction period for aniline oxi-dation, (ii) an exothermic oxidative polymerization producing a protonated pernigraniline and (ii) the conversion to a green
emeraldine PAni[16,18,19]. At the end of the process the thin PAni film is strongly adhered onto the substrate surface. Sapu-rina et al.[18,20]reported that during the chemical synthesis of PAni, the radical cations of aniline formed during the induc-tion period adsorb on the immersed surfaces leading to primary nucleation centers. The subsequent polymerization leads to the growth of polymeric chains[19,21]. It was showed in several papers that the in situ deposition is advantageous in that films with thicknesses ranging from 100 to 200 nanometers[2,18,20]
may be produced. The properties of in situ polymerized films depend on the synthesis conditions. For example, the thickness of PAni layer increases as the reaction temperature decreases
[2,18].
In a previous work[22]we observed that the surface rough-ness of in situ PAni films increased with increasing deposition time. In addition, larger roughness values were obtained in in situ films formed from lower concentrations of aniline, in agree-ment with McDiarmid et al.[23]. Here, it is shown that it is possible the control of thickness by altering the aniline concen-tration and the immersion time. We seek for optimized condi-tions for in situ deposition of PAni films that may lead thin films with desirable thicknesses ranging from a few nanometers to around 200 nm. We show that films with thicknesses as low as
∼25 nm could be prepared by the in situ technique which could be used, for example, as hole injecting layer in electrolumines-cent devices[24–27]. In order to investigate the growth process, we analyze the adsorption kinetics for the film fabrication using atomic force microscopy and UV–vis spectroscopy.
2. Experimental methods
The chemical polymerization was carried out using aniline and ammonium peroxydisulfate in a 1:4 molar ratio in aque-ous hydrochloric acid media. Aniline and ammonium perox-ydisulfate were purchased from Mallinckrodt and Merck, re-spectively. Aniline was distilled under vacuum and stored in the dark in a refrigerator. Ammonium peroxydisulfate was used as received. Three concentrations of the reaction media were used to prepare the films. The synthesis procedure was based on that described by McDiarmid [15–17]. Aniline was dis-solved in 300 ml of aqueous 1 M HCl, while ammonium per-oxydisulfate was dissolved in 200 ml of aqueous 1 M HCl. Both solutions were prepared at room temperature and cooled to 0◦C and the reactions were carried out at this tempera-ture with vigorous magnetic stirring. The peroxydisulfate so-lution was added dropwise to the aniline soso-lution containing the BK7 substrates (36×14×1 mm) previously cleaned us-ing the RCA process[28]. The substrates were removed from the reaction media after different times, washed in a solution of 1 M HCl, dried by blowing dry nitrogen and stored in a desiccator for further characterizations.Table 1shows the quan-tities of aniline and ammonium peroxydisulfate used to prepare the three concentrations. It is worth noting that no film de-position occurs if the substrate was immersed in the solution after the polymerization reaction had been completed, owing to the absence of aniline cation radicals, as reported by Sapurina et al.[20].
Table 1
Proportions of the reactants used and corresponding thickness and induction times for the aniline concentrations used in the in situ film deposition Concentration
1 M HCl (mol aniline/L)
Aniline (ml)
Ammonium peroxydisulfate (g)
Thickness at the saturation (nm)
Induction period (min)
0.112 5 2.880 185±12 3
0.045 2 1.152 71±5 21
0.022 1 0.576 25±3 25
Fig. 1. Absorption spectra of PAni films for different reaction times during in situ deposition. The concentration of the solution was 0.112 in mol of aniline per liter of 1 M HCL.
The UV–vis absorption spectra of in situ films were recorded using a Hitachi model U-2001 spectrophotometer. Surface mor-phology was investigated using a Nanoscope IIIa (Digital In-struments) atomic force microscope (AFM) with 512×512 pixel images obtained under ambient conditions in the tapping mode. The average height and average diameter of the aggre-gates were determined using the software from Digital Instru-ments.
3. Results and discussion
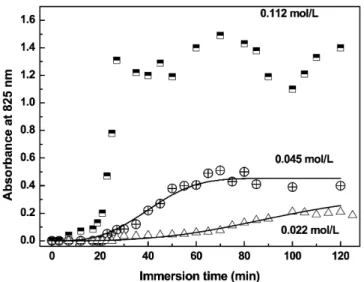
concentra-Fig. 2. Absorbance at 825 nm versus the substrate immersion time for 0.112, 0.045, and 0.022 mol/L concentrations. The solid line represents the fitting using the JMA equation.
tion used. According toFig. 2, the maximum deposition take places after 90 min, i.e., the deposition for longer times do not contributed to increase the amount of deposited material, which is proportional to the absorbance. This point corresponds to the saturation of the film grow process. Therefore, the data showed inTable 1corresponds to the films obtained with 90 min of de-position.
As Fig. 2 shows, at the beginning of the process there is no PAni deposition on the substrate, denoted by the almost zero absorbance values, which corresponds to the induction period[30]. The induction period correspond to the time neces-sary to formation (or adsorption) of aggregates with radio equal or larger than the critic radio[30]. Its value depends on the con-centration of the reactants (seeTable 1) and are larger than those obtained by Sapurina et al.[20]. This may be explained by the different conditions for the polymerization, as Sapurina et al.
[20]performed the experiments under room temperature while in this work we used 0◦C. A lower temperature leads to lower reaction rates and consequently larger induction times[31].
The mechanism of adsorption of PAni onto the substrate dur-ing the in situ deposition can be understood from the analysis of the adsorption kinetics[32]. The experimental results[33–36]
were fitted using the Johnson–Mehl–Avrami equation (JMA), given by
(1) A=k
1−exp
− t τ n ,
whereAis the absorbance,kandnare constants andτ is the characteristic time[30]. Avrami’s model gives the phenomeno-logical description of absorption kinetics and has been success-fully used to account for the growth of polymeric films[37,38]. For the highest concentration of 0.112 mol/L the fitting with JMA [30] equation is very poor and has not been shown in
Fig. 2. Experimental points for longer reaction times were scat-tered and oscillated as the reaction progressed, probably due to a cyclic process of adsorption and desorption of PAni. It is worth noting that the results are quite reproducible even if
Table 2
Parametersn,τ, andkemployed in the JMA equation for fitting the data for the aniline concentrations used in the in situ film deposition
Concentration 1 M HCl (mol aniline/L)
Parameters of the JMA equation
n τ(min) k
0.022 3 82±3 0.21±0.01
0.045 3 45±3 0.45±0.02
several experiments of synthesis are performed, i.e., the exper-imental points fit in the curve. This result is similar to that by Minko[39]on protonated poly(2-vinylpyridine) (PVP) on silica particles and de Souza[40]in layer-by-layer films of poly(o -methoxyaniline) alternated with poly(vinyl sulfonic acid). The non-monotonic increase[39,40]of the in situ film can be at-tributed to the different stages of film growth. During the first stage molecules are adsorbed on the substrate surface keeping their conformation as in solution. For PAni the interaction via hydrogen bonds favors the formation of aggregates or coiled chains[12]. According to the literature[39,40]the polymeric chains are rapidly adsorbed filling sites randomly on the sur-face, until there are no more sites available on the surface and adsorption stops. The sites are filled inefficiently due to the ran-dom distribution of chains on the surface, and the chains tend to adjust their conformation to interact better with the substrate. During this adjusting process some chains may be desorbed and cause the total amount of adsorbed material to decrease[41–43]
as shown inFig. 2. The competition between adsorption and desorption processes may be due to the high concentration of the solution or to the polydispersity of the molecules[40]. Such competition is also manifested in the morphological properties of the PAni films as will be shown later.
The fitting of the curves using the JMA equation is shown in solid lines inFig. 2, with parametersn,τ, andkused in the fit-ting being given inTable 2for the concentrations of 0.045 and 0.022 mol/L. The fitting was only successful fixingn=3. It was observed thatk, which is related to the absorbance (pro-portional to the sample thickness), increased with increasing the aniline concentration in the solution, as expected. The time τ used is consistent with the time required for the film to reach its maximum thickness. In principle, it is possible to use the Avrami parameternto distinguish between growth on the inter-face or by diffusion[30]. According to Hay[37],n=3 is asso-ciated with a three-dimensional growth of spheroids. Therefore, growth starts with nuclei formed in the beginning of the ad-sorption, i.e., the films are formed by small aggregates that are available in the beginning of the growth process[30](in our case, this means that during the late stages of PAni deposition the formation of new nuclei should not occur). Butn=3 could be also associated with a diffusion-controlled mechanism, and therefore the knowledge ofnalone is not sufficient to elucidate the growth process. Measurements of surface morphology may be required to further analyze the growth mechanisms, and this is why we obtained height profiles from AFM images of the various films.
Fig. 3. (a) AFM images of in situ PAni films adsorbed for 90 min with a scanning window of 2×2 µm; (b) Height profile of films; and (c) the average diameter versus average height of the aggregates for the in situ PAni films (solutions with concentrations of 0.022 and 0.045 mol/L).
Fig. 3. This time was chosen since the maximum deposition was obtained at this time, as discussed earlier. By analyzing the height profiles (cross section of the images) one may infer about the direction of film growth. According to the height pro-files inFig. 3, the average diameter of the globules increases practically linearly with their average height for the different aniline concentrations (Fig. 3c), thus demonstrating that there is no preferential direction for the growth of the globules. The data were taken at distinct cross sections of the images and the error bars included in the plots ofFig. 3are averaged values obtained in several scans. The measurements were taken at
dis-tinct places on the sample in order to include aggregates with larger diameter. We concluded that the aggregates grow sym-metrically (as spheres), consistent withn=3 take for granted in the kinetics of adsorption (Table 2).
which is similar to that reported for PAni films obtained with other techniques[44]. A clear structure could be identified for the in situ PAni films. In the beginning substrate coverage was not complete suggesting a nucleation process. Then, coalesc-ing domains appeared, which are characteristic of a growth mechanism. Therefore, a nucleation and growth mechanism was found for all solution concentrations used in this work, but only for the concentration 0.112 mol/L the process of adsorp-tion/desorption was observed. Note that in the last images of
Fig. 4, the size and number of grains decreased with the adsorp-tion time, analogously to the results of de Souza et al.[40]in layer-by-layer films using poly(o-methoxyaniline) POMA so-lution, having a high polydispersitivity and high concentration. As the substrate is immersed into the solution, the molecules close to the surface will adsorb, regardless of their size. As the time deposition evolves, smaller molecules have higher prob-ability of adsorbing as they take less time to diffuse through the solution and reach the substrate. If the substrate remains immersed, however, larger molecules with higher charge densi-ties will eventually reach the substrate and possibly replace the smaller molecules[40].
For the concentrations 0.022 and 0.045 mol/L of aniline in the solution the number of aggregates on the PAni films increased monotonically with time until eventually reaching saturation, similarly to the data of Raposo et al.[32]in layer-by-layer films of POMA obtained using a low concentration solution.
4. Summary
Varying the reaction time and the concentration of aniline in the aqueous solution during the in situ chemical synthesis of PAni one can control the thickness of the PAni films. The curves of adsorption kinetics for in situ PAni films could be success-fully fitted with the Johnson–Mehl–Avrami (JMA) equation for aniline concentrations of 0.022 and 0.045 mol/L in the reaction media. When a higher concentration, viz. 0.112 mol/L, was used a competition between adsorption and desorption leading to the oscillatory regime for the film thickness as the time reac-tion progress, and this process could not be explained with the JMA equation. AFM images showed that the in situ films were formed from the growth of spheroidal nuclei with no preferen-tial direction. This morphology characterization, using AFM, corroborated the hypothesis of a nucleation and growth mecha-nism that leads ton=3 in the JMA equation.
Actually we do not have means to compare our results for the surface morphology since its characteristics is strongly de-pendent on the sample thickness that are quite different for the different film preparation techniques. We believe that control-ling the aniline concentration in the solution and the immersion time of the substrate one can optimize, for example, the surface roughness of the film.
Acknowledgment
This work was supported by Fapesp, CNPq, and IMMP/MCT (Brazil).
References
[1] J.C. Ching, A.G. McDiarmid, Synth. Met. 13 (1986) 193.
[2] J. Stejskal, I. Sapurina, J. Prokes, J. Zemek, Synth. Met. 105 (1999) 195. [3] A.G. McDiarmid, Synth. Met. 125 (2001) 11.
[4] S. Karg, J.C. Scott, J.R. Salem, M. Angelopoulos, Synth. Met. 80 (1996) 111.
[5] Y. Yang, A.J. Heeger, Appl. Phys. Lett. 64 (1994) 1245. [6] P.N. Bartlett, R.G. Whitaker, Biosensor 3 (1987) 359. [7] R. Gasparac, Sens. Actuat. B 6 (1992) 45.
[8] J. Desilvestro, O. Hass, Electrochim. Acta 36 (1991) 361.
[9] A.G. McDiarmid, S.L. Mu, N.L.D. Somasiri, W. Wu, Mol. Cryst. Liq. Cryst. 121 (1985) 187.
[10] D.C. Trivedi, S.K. Dhavan, J. Mater. Chem. 2 (1992) 1091. [11] R.Q. Ou, R. Samuels, J. Polym. Sci. B Polym. Phys. 37 (1999) 3473. [12] R.S. Pontes, M. Raposo, C.S. Camilo, A. Dhanabalan, M. Ferreira, O.N.
Oliveira Jr., Phys. Status Solid A 173 (1999) 41.
[13] J.H. Cheung, A.F. Fou, M.F. Rubner, Thin Solid Films 244 (1994) 985. [14] S. Abaci, C. Shannon, Electrochim. Acta 50 (2005) 2967.
[15] A.G. McDiarmid, A.J. Epstein, Faraday Discuss. Chem. Soc. 88 (1989) 317.
[16] S.K. Manohar, A.G. McDiarmid, A.J. Epstein, Synth. Met. 41–43 (1991) 711.
[17] A.G. McDiarmid, Synth. Met. 84 (1997) 27.
[18] I. Sapurina, A.Y. Osadchev, B.Z. Volchek, M. Trchová, A. Riede, J. Ste-jskal, Synth. Met. 129 (2002) 29.
[19] J. Stejskal, P. Kratochvíl, A.D. Jenkins, Polymer 37 (1996) 367. [20] I. Sapurina, A. Riede, J. Stejskal, Synth. Met. 123 (2001) 503.
[21] J.K. Avlyanov, J.Y. Josefowicz, A.G. McDiarmid, Synth. Met. 73 (1995) 205.
[22] M.A. Pereira-da-Silva, S.A. Travain, R.M. Faria, J.A. Giacometti, Acta Microscópica 10 (2001) 28.
[23] J.K. Avlyanov, J.Y. Josefowicz, A.G. McDiarmid, Synth. Met. 73 (1995) 205.
[24] S.A. Travain, L.H. Libardi, A. Marletta, F.E.G. Guimarães, R.M. Faria, J.A. Giacometti, Mol. Cryst. Liq. Cryst. Sci. Technol. 374 (2002) 349. [25] L.C. Poças, S.A. Travain, J.L. Duarte, R.A. Silva, J.A. Giacometti, A.
Mar-letta, J. Phys. Condens. Matter, in press.
[26] S. Karg, J.C. Scott, J.R. Salem, M. Angelopoulos, Synth. Met. 80 (1996) 111.
[27] Y. Yang, A.J. Heeger, Appl. Phys. Lett. 64 (1994) 1245. [28] W. Kern, in: Semiconductor International, 1984, p. 94.
[29] R.F.M. Lobo, M.A. Pereira-da-Silva, M. Raposo, R.M. Faria, O.N. Oliv-eira Jr., Nanotechnology 14 (2003) 101.
[30] J.W. Christian, The Theory of Transformations in Metals and Alloys—An Advanced Textbook in Physical Metallurgy, Pergamon Press, New York, 1981.
[31] H.H. Kuhn, A.D. Child, Handbook of Conducting Polymers, second ed., Dekker, New York, 1998.
[32] M. Raposo, R.S. Pontes, L.H.C. Mattoso, O.N. Oliveira Jr., Macromole-cules 30 (1997) 6095.
[33] J. Engelking, H. Menzel, Eur. Phys. J. E 5 (2001) 87.
[34] J. Bai, C.M. Snively, W.N. Delgass, J. Lauterbach, Macromolecules 34 (2001) 1214.
[35] T. Abraham, S. Giasson, J.F. Gohy, R. Jerome, B. Muller, M. Stamm, Macromolecules 33 (2000) 6051.
[36] M. Raposo, O.N. Oliveira Jr., Braz. J. Phys. 28 (1998) 392. [37] J.N. Hay, Brit. Polym. J. 3 (1971) 74.
[38] N.C. de Souza, J.R. Silva, C.A. Rodrigues, A.C. Hernandes, L.D. Costa, J.A. Giacometti, O.N. Oliveira Jr., Synth. Met. 135 (2003) 121. [39] S. Minko, A. Voronov, E. Pefferkorn, Langmuir 16 (2000) 7876. [40] N.C. de Souza, J.R. Silva, R. Di Thommazo, M. Raposo, D.T. Balogh, J.A.
Giacometti, O.N. Oliveira Jr., J. Phys. Chem. B 108 (2004) 13599. [41] B. Schoeler, G. Kumaraswamy, F. Caruso, Macromolecules 35 (2002) 889. [42] S.A. Sukhishvili, S. Granick, J. Chem. Phys. 109 (1998) 6869.