Mechanical Behaviour of Copper 15% Volume Niobium
Microcomposite Wires
Marcello Filgueiraa*, José Nilson F. de Holandaa, Ruben Rosenthala,
Daltro G. Pinattib
aState University of North Fluminense, Advanced Materials Laboratory,
28015-620 Campos dos Goytacazes - RJ, Brazil
bFAENQUIL, Materials Engineering Dept.,
C.P. 116 12600-000 Lorena - SP, Brazil
Received: December 6, 2000; Revised: April 1, 2001
Cu-Nb microcomposites are attractive in magnet pulsed field technology applications due to their anomalous mechanism of mechanical strength and high electrical conductivity. In this sense, recently it was conceived the use of Cu 15% vol. Nb wires to operate as a high tensile strength cable for a diamond cutting tool (diamond wires) for marble and granite slabbing. The multifilamentary Cu 15% vol. Nb composite was obtained using a new processing route, starting with niobium bars bundled into copper tubes, without arc melting. Cold working techniques, such as swaging and wire drawing, combined with heat treatments such as sintering and annealing, and tube restacking were employed. The tensile property of the composite was measured as a function of the niobium filaments dimensions and morphology into the copper matrix, in the several processing steps. An ultimate tensile strength (UTS) of 960 MPa was obtained for an areal reduction (R = Ao/A, with Ao-initial cross section area, and A-final cross section area) of 4x10⁸ X, in which the niobium filaments reached thickness less than 20 nm. The anomalous mechanical strength increase is attributed to the fact that the niobium filaments acts as a barrier to copper dislocations.
Keywords: Cu 15% vol. Nb, wire drawing, heat treatments, anomalous tensile strength
1. Introduction
The Cu-Nb multifilamentary microcomposites are known due to their high ultimate tensile strength (UTS) combined with high electrical conductivity. Such proper-ties justify the use of this class of material in superconduc-tor wires for pulsed fields magnets. These composites usually contains less than 20 volume% niobium1,2. Due to its high UTS allied to its high ductility (true strain
ε > 2,0%), this composite was utilized in the present work as a high strength cable for the in situ diamond wires.
Diamond wires are cutting tools currently used in the slabbing of dimension stones such as marbles and granites, as well as in the cutting of concrete structures. This tool consists of a AISI 316 stainless steel cable containing spaced diamond annular segments (pearls)3,4. Filgueira5
has developed a new route to process diamond wires (In Situ technology) in which the diamond crystal was impreg-nated along the overall wire surface (continuous diamond volume). As a substrate to these wires it was employed the composite Cu 15% vol. Nb. In addition, the understanding of the properties and behaviour of this class of advanced material (Cu-Nb microcomposites) is the main concern of this work.
The aim of this work is to study the mechanical behav-iour of Cu 15% vol. Nb wires to operate as a high strength cable for diamond wires. In order to analyze the deforma-tion effect of wire processing on the tensile strength, sam-ples of several steps of wire drawing (various diameters) were prepared for the tensile tests.
*e-mail: marcello@uenf.br
2. Literature Review
2.1. Fabrication routes
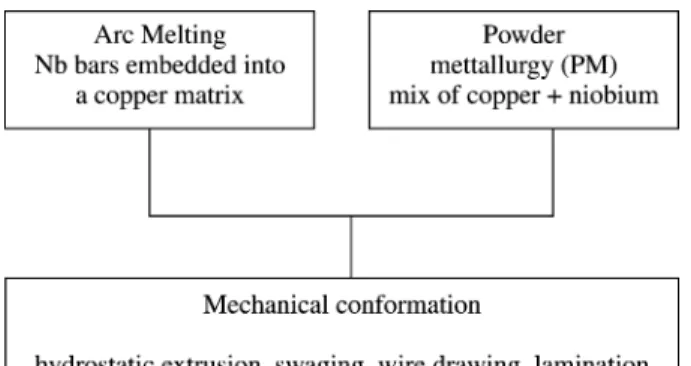
Figure 1 shows the routes used to process the Cu-Nb composites wires.
An example of the route to process Cu-Nb wires by arc melting was performed by Spitzig et al.6 Cu ingots of
φ = 6.10 mm in diameter containing 12-20% vol. Nb were prepared by arc melting. The ingots were then rod rolled to 1.3 mm and wire drawn to 0.15 mm in diameter, corre-sponding to an areal reduction of R = 1654 X. The Nb dendrites embedded into the copper matrix showed a di-ameter range of 1.0 to 10 µm after the arc melting7. There-fore, after mechanical conformation, the Nb dendrites deform following a preferential orientation, acquiring a “ribbon like shape” in submicrometrical dimensions, which is responsible for the high strength of the wire (for the Cu 20% vol. Nb, UTS = 2200 MPa). In this route is reached high purity of the ingots6.
The PM route was developed by Pourrahimi8. Pure Cu and Nb powders were mixed at tap density and placed in Cu cans. After sealing, compaction and evacuation, the billets were processed by swaging, hydrostatic extrusion and wire drawing. Restacking of the Cu-Nb elements into the Cu tubes was used to achieve high areal reductions. The PM Cu 18% Nb composite reached the UTS = 1035MPa.
2.2. Mechanical behaviour
The majority of fabrication processes of copper-nio-bium wires, such as extrusion, wire drawing, swaging and rod-rolling, consists in the Nb filament thickness reduction, so they can attain dimensions in the order of 10 nm9, where deformation reaches its saturation, because under these conditions the Nb filaments acco mmodate no further plas-tic deformation and rupture occurs. The areal reduction range necessary for the Nb filaments thichness to attain nanometric dimensions varies from R = 103 to 108 X1,7. The high tensile strength of the Cu-Nb composites is obtained due to the “ribbon like shape” microfilamentar structure of
the niobium filaments, where the Nb microfilaments lock the interfacial dislocations originated in the copper matrix. Pourrahimi et al.1 have found results of tensile strength of UTS = 1100 MPa for an areal reduction of R = 5x10⁶ X, reaching UTS = 1600 MPa for R = 5x10⁷ X . Thus, a reduction of one order of magnitude promotes a strength-ening gain of 30%. This composite Cu 18 vol. % Nb was obtained by the PM route. Raabe2 fabricated the Cu 20 vol. % Nb by the arc melting route, reaching an UTS = 2000 MPa. It confirms the Bevk et al.7 results.
The amount of Nb in the composite varies from 10 to 20% vol., because this is the range in which the composite shows an anomalous tensile strength. The behaviour was theoretically explained in terms of the percolation phe-nomenon by Sher and Zallen9. The researchers cited above carried out statistical analysis on the atomic interconnec-tivity in several crystalline structure lattices, taking into account the universal model of hard spheres in the tridimen-sional space. They concluded that the critical density of percolation for CFC (Cu) and CCC(Nb) structures is ap-proximately 15%. In other words, it means that at least 15% vol. Nb is required in the composite Cu-Nb to achieve interconnectivity between the Nb filaments in the compos-ite. This is very desirable not only in the point of view of the composite homogeneity but also due to the CFC copper dislocations locking by the CCC niobium filaments.
3. Experimental
Figure 2 shows the Cu-Nb wires processing route. The wires was manufactured by using Nb bars inserted into Cu tubes. Co mmercially pure Nb bars of φ = 6.10 mm in diameter were obtained by aluminotermy and electron-beam melting, and then hot forged. Copper tubes are co mmercially known as OFHC type. Table 1 shows the chemical analysis of both Cu and Nb. Results are in agree-ment with the ASTM10 and ASTM11 standards specifica-tions.
I n t h e 1st, 2nd a nd 3rd restackings, the Cu
φext = 19,00 mm/ φint = 16.00 mm tube with 19 filaments was swaged (FENN 3F) to φ = 14.605 mm, to ensure contact between the filaments, then this billet was heat treated at 850 °C/1 h by using a vacuum (10-4 mmHg) furnace to promote sintering (interfilamentar cohesion) along the overall length of the bar. This heat treated bar was then swaged to φ = 7.925 mm and wire drawed to φ = 3.08 mm.
In the 4th restacking 61 filaments of φ = 2.90 mm (from the 3rd restacking) were bundled into a Cu φext = 33.00 mm/
determined via initial copper content control, as well as via pickling between each restacking, making use of gravimetry. The composite was manufactured in two stoichiometries: Cu 10% vol. Nb and Cu 15% vol. Nb.
The Cu-Nb composites wires were tensile tested in a Universal Testing Machine MTS-mod. 810.23M-capacity 250KN, under ASTM12 standard specification. Samples for scanning electron microscopy (SEM ZEISS 912) were cold embedded in epoxy resin and then abraded (300-400-600-800-1200 mesh) and SiO2 (mean particle size: 0.10 µm) polished. Samples for transmission electron microscopy (TEM ZEISS 900) were embedded in a epoxy resin, then cut in a Reichert Ultracuts ultramicroton, with a knife graduated to a degree of 10° and cut thickness of 60 nm, to ensure transparency to the electron beam. The cut pieces of the sample were collected in a 0.5% formvar-chloroform film, which was put into a 300 mesh grating.
4. Results and Discussion
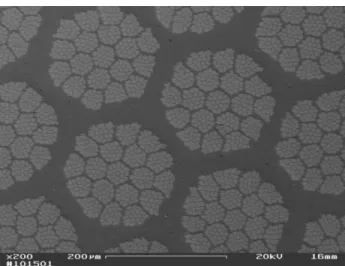
The anomalous tensile strength behaviour occurs only when the Nb filaments attain a thickness of approximately t = 10 nm. Thus, its necessary a mechanical conformation that promotes areal reduction in range of R = 106 to 108 X. Figure 3 shows a transversal section of the Cu 15vol% Nb composite for an areal reduction of R = 1x27.107 X (after the 4th restacking) and the corresponding wire diameter was of φ = 2.00 mm. The cells are homogeneously spaced without macro or micro defects. Each individual cell meas-ures approximately 150 µm.
Figure 4 shows the mechanical behaviour of the com-posites Cu 15% vol. Nb, Cu 10% vol. Nb, and pure copper. As a matter of convenience, the areal reductions were taken in relation to the last heat treatment, which occurs after the 4th restacking, for a billet diameter of φ = 24.76 mm. In this Figure 2. Processing route of Cu-Nb wires manufacture.
Table 1. Chemical composition of niobium and copper.
Ta (%) W (%) Al (%) Fe (%) C (%) N (%) O (%) S (%)
Niobium 0.11 0.02 – 0.005 0.02 0.01 0.012 –
Copper NV NV NV 0.002 0.002 – 0.002 –
step the areal reduction is R = 8.5x10⁴ X. Thus, to find the overall areal reduction, a factor of 8.5x10⁴ must be multi-plied by the values shown in the abscissa of the graph in Fig.4.
One can observe that the pure copper wire drawn reaches its tensile strength saturation level at the UTS = 500 MPa for the areal reduction of R = 1250 X. This result is in close approximation with the literature1. The composite Cu 10 vol% Nb has show a gain in UTS, and the wires broke down during wire drawing at UTS = 700 MPa for R = 2250 X, overcoming the pure copper in 200 MPa, corresponding to a strength gain of 30%. Nevertheless, this value is 30% below the UTS found by Bevk et al.7 for the same stoichiometry. This is attributed to the fact that Bevk et al. obtained the composite Cu 10% vol. Nb by the arc melting route, ensuring Nb dendrites homogeneously spaced into the copper matrix. In this work was employed the bundling of Nb bars into Cu tubes, without further arc melting, due to the fact that it is easier to orient Nb dendrites
of φ = 10 µm in diameter than in Nb polycrystalline bars. The form is indispensable to the anomalous phenomena of the composite strength. Therefore, it should be noted that the arc melting introducts an increase in the final cost of the composite wires manufacture (equipment, energy, etc).
The Cu 15% vol. Nb wires broke down during wire drawing for a diameter of φ = 0,36 mm, showing UTS = 960 MPa, for an areal reduction of R = 4800 X (after the last heat treatment: Roverall = 4,1.108 X). Comparing with the pure copper, it is observed that the Cu 15% vol. Nb is 2 times stronger, characterizing an anomalous strength behaviour (not predicted by the rule of mixtures). There-fore, the result of UTS = 960 MPa of the Cu 15% vol. Nb indicates that not all the Nb filaments reached the desired thickness. This is seen in Fig. 5. The arrows show the Nb filaments (darken parts) which thicknesses are in the range of t = 5-10 nm, explaining the UTS = 960 MPa. Further-more, it can be observed that some filaments show thick-nesses higher than t = 20 nm. This indicates that the strength of the Cu 15 vol.% Nb wire manufactured in this work had not reached its saturation (the graph of the Fig. 4 shows this tendency-the wires broke down due to fabrication, but the composite did not reached its saturation in deformation). Thus, higher UTS values may be reached if higher defor-mations are imposed to the composite, diminishing the Nb thicknesses to about t = 10 nm.
In the substructure it is observed the presence of inter-facial dislocations, forming cells which are locked by the Nb filaments, characterizing (in Fig. 5) the brighter regions between the copper matrix (white areas) and the Nb fila-ments (dark areas).
Comparing the tensile strength of the Cu 15% vol. Nb composite with the Cu 10% vol. Nb, it is observed that an Figure 3. Cross section of the Cu15 vol.Nb. R = 1.27x10⁷ X.
Magnifi-cation: 200 X. MEV.
Figure 4. Ultimate tensile strength (UTS) versus areal reduction R, after the last heat treatment.
increase of 5% in volume of Nb in the composite promotes a gain of 260 MPa. This result is of great relevance and it can be explained in terms of percolation critical density phenomenon; that accordingly to Sher and Zallen9 it is necessary an amount of 15 vol.% Nb in the composite for an efficient Nb filaments interconnectivity, as to achieve a locking of the copper dislocations by the Nb filaments. It is worth to say that the result of UTS = 960 MPa obtained for the Cu 15% vol. Nb wires in this work, is in far a g r e e m e n t w i t h Pourrahimi8, w h o m e a s u r e d UTS = 1000 MPa for the PM Cu 15% vol. Nb composite laboratorial scale.
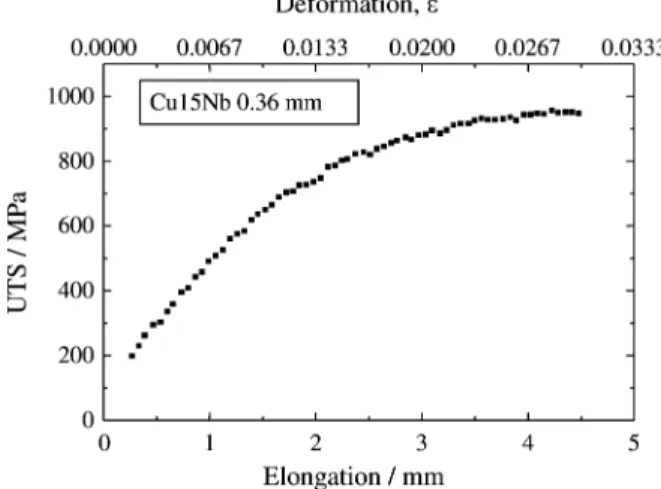
Figure 6 shows the tensile behaviour of the Cu 15% vol. Nb composite, reaching an UTS = 960 MPa. The yield stress measured at ε = 0.002 was σy = 805 MPa. It is worth to observe that the composite shows a deformation higher than ε = 0.02, indicating that its rigidity is in the same level of the AISI 316 stainless steel (used as the high strength cable for the co mmercial diamond wires).
4. Conclusions
Fabrication techniques employed in this work, such as swaging, wire drawing, heat treatments and tube restack-ings were successful to manufacture the Cu-Nb compos-ites.
In the point of view of tensile strength, the Cu 15% vol. Nb (UTS = 960 MPa) composite wires overcome the AISI 316 stainless steel cable (UTS = 850 MPa3). Thus, this composite is technologically attractive to operate as a high strength cable for diamond wires. The same analysis may be done by comparing the strain before rupture. Both materials are in the same level: ε > 0.02.
Wire breakage occurred in the diameter of φ = 0,36 mm due to the wire drawing system be inadequate to draw small diameters. As a result, deformation (strength) saturation did not occurred. Saturation would occur only when the major-ity of the Nb filaments attained a thickness of approxi-mately t = 10 mm. TEM showed that only a part of Nb filaments reached this desired thickness value.
The results are in fair agreement with literature (1) and (8). Although the manufacture route are quite different, as discussed before.
Acknowledgements
The authors show their gratitude to the DEMAR/ FAENQUIL for the various equipment used in this work, and to FENORTE/UENF by the financial aid.
References
1. Pourrahimi, S. et al.Metallurgical Transactions A., v. 23A, p. 573-586, 1992.
2. Raabe, D. Zeitschrift fur Metallkunde., v. 86. n. 6. p. 405-415, 1995.
3. Le Scanff, A. Diamonds in Industry. Stone. Ed. De. Beers. p. 7, 1995.
4. Wright, D.N. Seminário sobre Diamante e CBN na Indútria. São Paulo/SP, 18-19 de março, 1991. 5. Filgueira, M. Ph.D. Thesis. State University of North
Fluminense. Advanced Materials Lab. 153 p. Campos dos Goytacazes/RJ, 2000 (In portuguese).
6. Spitzig, W.A. Acta Metallurgica, v. 35. n. 10. p. 2427-2442, 1987.
7. Bevk, J. et al.Journal of Applid Physics , v. 49. n. 12. p. 6031, 1978.
8. Pourrahimi, S. Ph.D. Thesis. Northeastern University. Boston, MA. 175 p., 1991.
9. Sher, H.; Zallen, R. Journal of. Chem. Phys., v. 53. p. 3759-3761, 1970.
10. Annual Book of ASTM Standards. Section 2-electri-cal Conductors. v. 2, n. 3, 1992.
11. Annual Book of ASTM Standards. Section 2-Nonfer-rous Products, v. 2, n. 4, 1987.
12. Annual Book of ASTM Standards. Section 3-Metals Tests: Methods and Analytical Procedures, v. 3, n. 1, 1997.
FAPESP helped in meeting the publication costs of this article