*e-mail: [email protected]
1. Introduction
The research and development of materials fabricated from renewable sources has been a focus of the scientiic community in the 21st century. This research includes the development of novel, green, bio-based and degradable materials from natural sources for various engineering applications1-4.
The world rice harvest is estimated as 500 million tons per year, and rice hull (RH) is the major byproduct generated during the rice milling process. Rice hulls represents approximately 20% of the dry weight of the rice harvest5. Rice hulls contain 36–40 g/100 g cellulose and 12–19 g/100 g hemicelluloses. Ash represents approximately 12 g/100 g, which is primarily silica (80–90 g/100 g)6,7.
Recently, agro-industrial solid residues with high cellulose content (rice hulls) have been used in cellulose and nanocellulose production4,8. Two types of nanocellulose can be isolated from a cellulosic source: nanocrystals, and nanoibrils. Nanocrystals have a crystalline structure, and nanoibrils are ibrillar units containing both amorphous and crystalline regions. Nanoibrils can create entangled networks with diameters less than 100 nm. They also possess attractive properties such as high strength, lexibility and high aspect ratio (length to diameter ratio) 9-10.
Cellulose nanoibrils have been prepared from a variety of sources using several mechanical processes11-13 such as ultrasonication14. Chemical or enzymatic treatments can be employed before or after the mechanical process9,10,15. Paschoal et al.16 obtained nanoibrillated cellulose from oat hulls using bleaching with peracetic acid, acid hydrolysis
at a mild temperature (45ºC) followed by ultrasonication. They reported the use of a totally chlorine-free technique (TCF) to extract and bleach cellulose from oat hulls. In the present work we propose the use of rice hulls for obtaining cellulose nanoibrils employing peracetic acid as a more environmentally friendly bleaching agent.
Cellulose nanoibrils are used as a reinforcing material in starch ilms to improve their mechanical and barrier properties17,18. However, their effect depends on the cellulose source and extraction method19,20.
We investigated the microstructure, crystallinity and thermal stability of cellulose nanoibrils obtained from rice hulls using bleaching and acid hydrolysis at a mild temperature (45ºC) followed by ultrasonication. We analyzed the effects of nanoibrils addition on the properties of starch ilms produced by extrusion.
2. Experimental
2.1. Materials
Unpuriied rice hulls (RH) were kindly supplied by HT-Nutri (Camaquã, RS, Brazil). The residue was dried (12 - 14 h) at 45°C in an air circulation oven (Marconi MA 415 – Piracicaba-Brazil) and milled (IKA-A 11 Basic Mill - Germany) to yield particles < 0.30 mm.
2.2 Methods
2.2.1. Chemical composition
The centesimal composition of the residue (proteins, lipids, moisture and ash) was determined following methods adapted by the Association of Oficial Analytical Chemists
Nanocellulose Produced from Rice Hulls and its Effect
on the Properties of Biodegradable Starch Films
Pedro Nascimentoa, Renan Marima, Gizilene Carvalhob and Suzana Malia*
aDepartment of Biochemistry and Biotechnology, State University of Londrina – UEL,
Rodovia Celso Garcia Cid, Pr 445 Km 380, CEP 86057-970, Londrina, PR, Brazil.
bDepartment of Chemistry, State University of Londrina – UEL,
Rodovia Celso Garcia Cid, Pr 445 Km 380, CEP 86057-970, Londrina, PR, Brazil..
Received: July 22, 2015; Revised: September 30, 2015; Accepted: November 26, 2015
Rice hull is a residue from agro-industry that can be used to produce nanocellulose. We produced nanocellulose from rice hulls through bleaching (with a 5% NaOH solution followed by a peracetic acid solution) and acid hydrolysis at a mild temperature (45ºC) followed by ultrasonication. We investigated the microstructure, crystallinity and thermal stability of these materials and studied their effects on the properties of starch ilms. After bleaching, the compact structure around the cellulosic ibers was removed, and the lignin content of the residue decreased from 7.22 to 4.22%. The obtained nanocellulose presented a higher crystallinity (up 70%), higher thermal stability than the raw material and lignin contents below 0.35%. The nanocellulose formed interconnected webs of tiny ibers (< 100 nm in diameter), which decreased the opacity, water vapor permeability and improved the mechanical properties when added as reinforcement in the starch ilms.
(AOAC)21. The total carbohydrate content was calculated from the difference. All experiments were run in triplicate.
The total dietary iber and soluble and insoluble fractions were determined according to AACC method 32-0722. Cellulose content was determined by the Updegraff method23, and the lignin content was determined by the Technical Association of the Pulp and Paper Industry (TAPPI T222 om-88) method24. The hemicelluloses were calculated by taking the insoluble dietary iber (IDF) minus the cellulose plus the lignin content because the insoluble IDF fraction of cereal is composed of cellulose, hemicelluloses and lignin25.
2.2.2. Bleaching of the rice hulls
The bleaching of the rice hulls was performed in two stages. The irst stage was an alkaline pre-treatment26. Rice hulls (20 g) were immersed in 200 ml of sodium hydroxide (NaOH) 5% (w/v) at 90°C for 60 min under constant stirring. The material was washed with distilled water until it reached a neutral pH and was dried at 40°C for 24 h.
In the second stage, approximately 20 g of the material from the alkaline pre-treatment was dispersed in 250 mL of a peracetic acid solution (50% acetic acid (Synth – Brazil), 38% hydrogen peroxide (Synth – Brazil) and 12% distilled water) at 60ºC and vigorously stirred for 24 h16. The ibers were vacuum iltered, washed with distilled water until the pH value was between 6 and 7 and dried at 35ºC for 12 – 24 h in an air-circulating oven (Tecnal – São Paulo-Brazil). The bleached rice hull was labeled as RHB.
2.2.3. Preparation of the cellulose nanoibrils from rice hulls
Approximately 10 g of bleached rice hulls were dispersed in 100 mL of 63.7% (w/v) sulfuric acid (Synth – Brazil) at 45ºC and vigorously stirred for 1 or 2 h. Cold distilled water (200 mL) was added to stop the reaction. The sulfuric acid was partially removed from the resulting suspension through centrifugation at 10,000 rpm for 10 min. The non-reactive sulfate groups were removed using centrifugation followed by dialysis in tap water with a cellulose membrane (Sigma–Aldrich: D9402) until the pH value was between 6 and 7. Dialysis was performed in running distilled water for 3 – 4 days. The neutral suspension was ultrasonicated (Ultrasonic Processor – Fisher Scientiic – USA) for 15 min, two drops of chloroform were added and then the suspension was stored in a refrigerator. The cellulose nanoibrils samples were labeled RHNF1h or RHNF2h, depending on the extraction time. A 50 mL aliquot was dried at 35ºC for 12 h in an air-circulating oven (Tecnal – São Paulo-Brazil) for X-ray diffraction, Fourier transform infrared spectroscopy and thermogravimetric analyses.
2.2.4. Cellulose nanoibril characterization
2.2.4.1. Scanning electron microscopy (SEM)
SEM analyses were performed with a FEI Quanta 200 microscope (Oregon, USA) to observe the morphology of RH and RHB. The dried samples were mounted for visualization on bronze stubs using double-sided tape. The surfaces were coated with a thin gold layer (40–50 nm). All samples were examined using an accelerating voltage of 30 kV.
2.2.4.2. Transmission electron microscopy (TEM) The suspensions of RHNF1h and RHNF2h were observed by TEM using a FEI-TECNAI 12 transmission electron microscope (Oregon – USA) with an acceleration voltage of 80 kV. A droplet of diluted suspension was deposited on a carbon coated grid and allowed to dry. The grid was stained with a 1.5% solution of uranyl acetate and dried at room temperature.
2.2.4.3. X-ray diffraction (XRD)
The samples were inely powdered (particles < 0.149 mm). The analysis was performed using a PANalytical X´Pert PRO MPD diffractometer (Netherlands) with copper Kα radiation (λ = 1.5418 Ǻ) under the operational conditions of 40 kV and 30 mA. All assays were performed with a ramp rate of 1°/min. The relative crystallinity index (CI) was calculated using the Segal et al., method27: CI (%) = ([(I
002 –Iam)]/I002)*100, in which I002 is the intensity of the 002 peak (at approximately 2θ = 20-22o) and I
am is the intensity corresponding to the peak at 2θ = 18o.
2.2.4.4. Fourier Transform Infrared (FT-IR) Spectroscopy
The pulverized and dried samples were then mixed with potassium bromide and compressed into tablets. The FT-IR analyses were performed with a Shimadzu FT-IR – 8300 (Japan), with a spectral resolution of 4 cm-1 and a spectral range of 4000 – 500 cm-1.
2.2.4.5. Thermogravimetric analysis (TGA)
Thermogravimetric analysis (TGA 50 – Shimadzu - Japan) was performed under a nitrogen atmosphere (50 mL min-1). The samples (approximately 10 mg) were heated from 30 to 600ºC at a heating rate of 10ºC/min. The weight loss (%) was evaluated by measuring the residual weight at 600ºC.
2.2.4.6 Differential scanning calorimetry (DSC) The DSC analyses were performed on a Shimadzu DSC 60 (Japan) calorimeter. Approximately 3.0 mg of each sample were placed in platinum containers and heated from 30 to 450˚C at a heating rate of 5°C / min in a helium atmosphere.
2.2.5. Films manufactured by extrusion
The ilms were formulated with cassava starch (72.5% w/w) and glycerol (25.0% w/w) as the plasticizer. Rice hull (RH), bleached rice hull (RHB) or cellulose nanoibrils (RHNF1h) were added as reinforcing agents to ilm formulations (2.5% w/w). RH and RHB were added as powders to the starch-glycerol mixture. RHNF1h was added in a wet state (20% moisture) to the starch-glycerol mixture. A control ilm was produced without any reinforcing agent at 75% w/w of starch and 25% w/w glycerol.
to die): 120/130/120/120°C for the pellet formation step and 120/130/120/130°C for the blowing step. Screw rotation was constant at 35 rpm.
2.2.6. Film characterization
All ilm samples were conditioned at 25°C and 58% RH (over a saturated solution of sodium bromide – NaBr) for 7 d before testing. Thickness was determined using a manual micrometer with ± 0.1 μm accuracy (Mitutoyo, Brazil), and calculated as the average of 10 measurements taken at random positions on the ilm. The ilm density was determined directly from the ilm weight and dimensions (volume). Reported values were the average of ten calculations.
Opacity was determined according to the Hunterlab method reported by Sobral28 with a BYK Gardner colorimeter (Maryland-USA) operating in the relectance mode. The opacity (Y) of the samples was calculated as the relationship between the opacity of each sample on the black standard (Yb) and the opacity of each sample on the white standard (Yw): Y = (Yb/ YW)*100. The results were reported as the percentage of opacity. All tests were performed in triplicate.
Water vapor permeability (WVP) was performed according to a modiied ASTM E96-00 method29. Film samples were sealed over a 60 mm circular opening of a permeation cell containing calcium chloride (0% RH inside the cell). The set was placed inside a desiccator containing saturated sodium chloride solution (75% RH outside the cell) to create a 75% RH gradient across the ilm. All tests were performed in triplicate.
Mechanical properties were determined using a TA.TX2i Stable Micro Systems texture analyzer (Surrey – England) in accordance with ASTM D-882-9130. Ten sample strips (25.4 x 100.0 mm) of each formulation were clamped between pneumatic grips (50 mm initial distance between the grips) and distended at 50 mm.min-1. The force (N) and deformation (mm) were reported to determine the tensile strength (MPa), elongation (%) and Young´s modulus (MPa). 2.2.7. Statistical analysis
Tukey’s test (p ≤ 0.05) was employed for mean comparison and was performed using STATISTICA 7.0 (Statsoft, Oklahoma).
3. Results and Discussion
The original lignin content of RH (7.24 ± 0.59%) decreased in all samples. The lignin content of RHB, RHNF1h and RHNF2h were 4.22 ± 0.27, 0.12 ± 0.45 and 0.32 ± 0.43%, respectively. The results demonstrated that bleaching followed by acid hydrolysis were effective for cellulose puriication.
3.1. Morphological analyses (SEM and TEM)
of rice hulls after bleaching and acid
hydrolysis
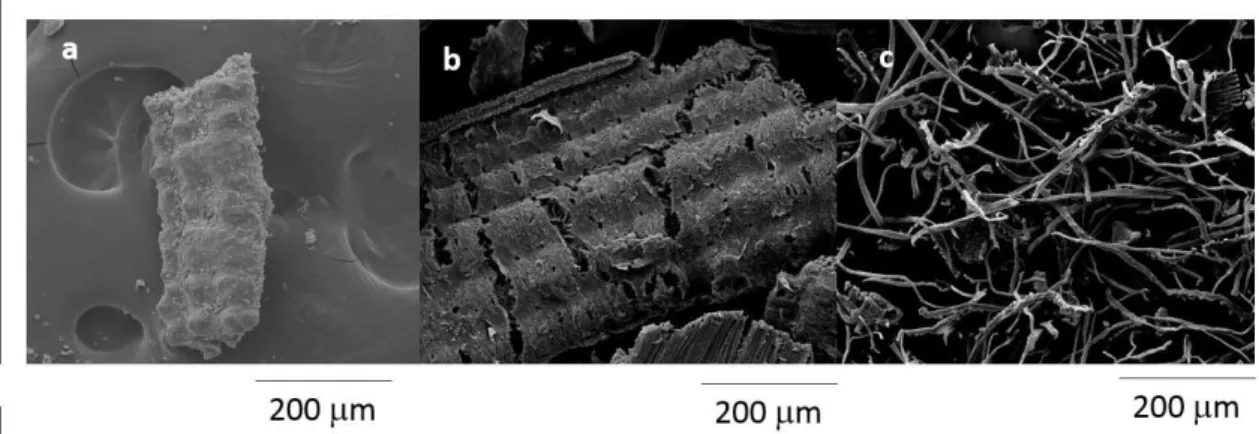
The morphology of the longitudinal surface of the ibers before and after bleaching is shown in Figure 1. The original iber forms a well-organized and compact structure (Figure 1a) with the nonibrous components (hemicellulose and lignin). The corrugated outer epidermis containing silica deposited on the surface of the epidermal tissue31,32 can be observed.
After the alkaline pre-treatment (Figure 1b), the iber surface was less compact and its original structure was disorganized. This result indicated a partial removal of the outer non-cellulosic layer composed of hemicelluloses and lignin. According to Patel et al.31, alkali treatment of rice hull cannot destroy its inherent structure. NaOH treatment removes the silica and leaves the ibrous organic material.
After the NaOH pre-treatment and the peracetic acid treatment (Figure 1c), the iber bundles were removed from the lignocellulosic complex. These bundles become individualized (Figure 2b), and the microibrils are visualized. In plant cells, lignin and hemicelluloses are deposited between the cellulosic microibrils forming an interrupted lamellar structure15,16. Bleaching agents can remove these non-cellulosic components.
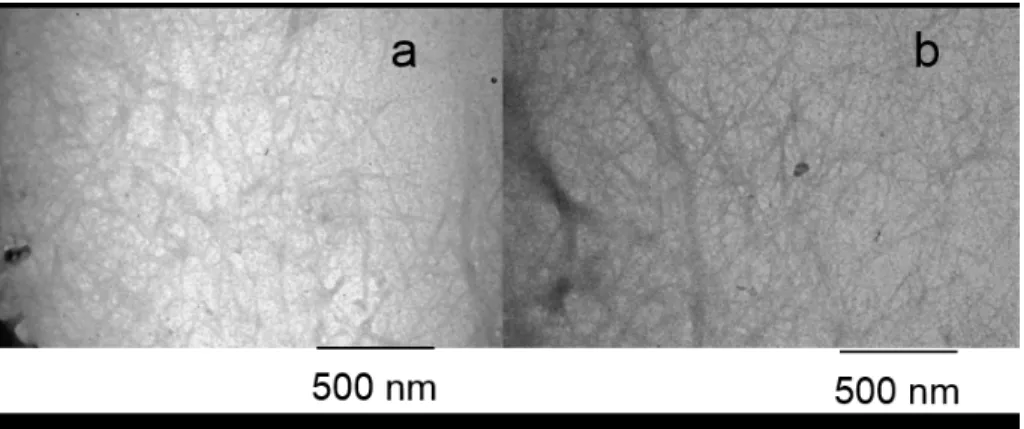
The suspensions resulting from the acid hydrolysis were stable. There was no sedimentation when they were stored at room temperature for extended periods of time. TEM micrographs of the rice hulls nanoibers are depicted in Figure 2, revealing the homogeneity and nanometric dimensions of these materials.
The hydrolysis time did not affect the morphological properties of the cellulose nanoibers from rice hulls (Figure 2). The nanocellulose we obtained contained interconnected webs of tiny ibers with diameters in the nanometric
Figure 1. Micrographs obtained using SEM: raw rice hulls (a), rice hulls pre-treated with NaOH (b) and rice hulls treated with NaOH
scale (< 100 nm) and lengths of several micrometers. These nanoibers possess a high aspect ratio. Paschoal et al.,16 also obtained nanocellulose with similar characteristics using peracetic acid. Peracetic acid is a strong oxidizing agent with excellent bleaching properties. It is an environmentally safe alternative for bleaching because it is a chlorine free (TCF) process that results in less damage to the iber16,33-35.
3.2 X-ray diffraction of rice hulls after bleaching
and acid hydrolysis
The X-ray diffraction patterns of RH, RHB, RHNF1h and RHNF2h are depicted in Figure 3. These patterns are typical of semicrystalline materials with an amorphous broad hump and crystalline peaks. Cellulose was responsible for the crystalline structure, whereas hemicellulose and lignin are amorphous in nature36. In the RH pattern, one peak was observed at 22°. The RHB, RHNF1h and RHNF2h peaks were observed at 16°, 22° and 34°. These peaks are characteristic of type I cellulose16, 36 (Figure 3). Both the bleached and hydrolyzed samples did not exhibit any variation in their polymorph type compared with the original ibers. The peaks become more deined after chemical treatment.
The RH sample demonstrated a lower crystallinity index (CI = 52%) than the bleached (RHB, CI = 68%) and hydrolyzed (RHNF1h, CI = 75% and RHNF2h, CI = 72%) samples. The lower CI of the RH sample occurred because of the reduction and removal of the amorphous, non-cellulosic compounds. This removal was induced by bleaching and acid hydrolysis. According to Abraham et al.15, lignin removal results in an increase in the crystallinity index. The CI values of the hydrolyzed samples were nearly identical, and these results were consistent with the TEM analysis. The identical morphology was observed for RHNF1h and RHNF2h.
3.3 Fourier Transform Infrared (FT-IR)
Spectroscopy
The FT-IR spectra of RH, RHB, RHNF1h and RHNF2h are depicted in Figure 4. All of the spectra displayed a wide absorption band corresponding to O–H stretching between 3400 and 3200 cm-1. This band indicates H-bonding interactions in these materials. The peaks observed at 2900 cm-1 correspond to –C-H stretching. Figure 4 demonstrates H-C-H and –C-O-H conjugated bending vibrations in all spectra.
A shoulder was observed at approximately 1700 cm−1 in the spectra of the RH and RHB samples (Figure 4). This feature represents the acetyl or uronic ester groups of the hemicelluloses 2,36. We observed the disappearance of this shoulder in the RHNF1h and RHNF2h samples, indicating the removal of hemicelluloses from these samples.
The shoulder observed at approximately 1700 cm−1 (Figure 4) in the spectra corresponds may also be attributed to the presence of C=O linkage15, which is characteristic of lignin and hemicellulose in these samples.
Figure 2. Micrographs obtained using TEM of the cellulose nanoibers from rice hulls: extraction at 1 h (a), and 2 h (b).
Figure 3. X-ray diffractograms of RH, RHB, RHNF1h and RHNF2h.
Bands were observed at approximately 1640 cm-1 for all samples. These bands are associated with the angular O–H bending of water molecules. According to Abraham et al.15, the water adsorbed in the cellulose molecules is dificult to extract because of the cellulose–water interaction.
The band at 1650 cm−1 may be assigned to water, but could also be attributed to the aromatic C=C stretch of the aromatic ring in the lignin37. The contribution from the absorbed water predominates in the case of RHB, RHNF1h and RHNF2h. However, in the raw rice hull (RH), this band could be attributed to the lignin.
Bands at 1430 and 890 cm-1 can be observed in the FT-IR spectra of RHB, RHNF1h and RHNF2h (Figure 4). These bands are typical of pure cellulose2,36. The band at 890 cm-1 represents C–O–C stretching vibrations of the characteristic β (1→4)-glycosidic linkage36.
According to Sun et al. 37, the C–O–C pyranose ring skeletal vibration occurs in the region of 1076–1023 cm−1. In our work, this band appeared in all samples (Figure 4) and was more intense in RHB, RHNF1h and RHNF2h.
The differences between the spectra of RH and the other samples suggested that these samples have higher cellulose content than the raw sample and are almost pure cellulose.
3.4 Thermogravimetric analysis (TGA)
The curves obtained from TGA analysis are shown in Figure 5. A small weight loss (< 10%) was found in the range of 50–100°C because of the evaporation of water or other low molecular weight compounds from the materials.
The maximum degradation temperature (Figure 5) was higher for the hydrolyzed samples (RHNF1h and RHNF2h) compared to the raw material (RH) and bleached sample (RHB). This result indicated that the nanoibers extracted from rice hulls had increased the thermal stability. Our results were similar to those of Abraham et al.,17 who produced nanoibrillated cellulose from banana, pineapple leaf and jute ibers using alkaline treatment followed by steam explosion and acid hydrolysis. Paschoal et al.,16 also reported that nanoibers extracted from oat hulls possessed a higher thermal stability than the raw material. Nanocellulose obtained from natural ibers demonstrate a higher thermal stability than the cellulose present in untreated lignocellulosic ibers. This increased stability is because the hydrolyzed samples are more crystalline than the raw material, and a greater crystalline structure requires a higher degradation temperature 38.
3.5 Differential scanning calorimetry
In all the thermograms, from 50°C to 125°C, an endothermic peak was present because of water evaporation (Figure 6). RHNF1h and RHNF2h demonstrated sharp endothermic peaks at 347°C (Figure 6) that may represent the melting of the crystalline fraction of these samples. RHB demonstrated a less intense peak at the identical temperature and the raw material (RH) demonstrated an endothermic peak at 328°C (Figure 6). Morán et al.,39 reported that commercial cellulose contained endothermic peaks related to its crystal melting
at 330°C and that a decrease in the position of the peak indicates an increase in the amount of amorphous cellulose. We report similar results for RHB, RHNF1 h and RHNF2 h (higher crystallinity index) compared to RH.
3.6 Film characterization
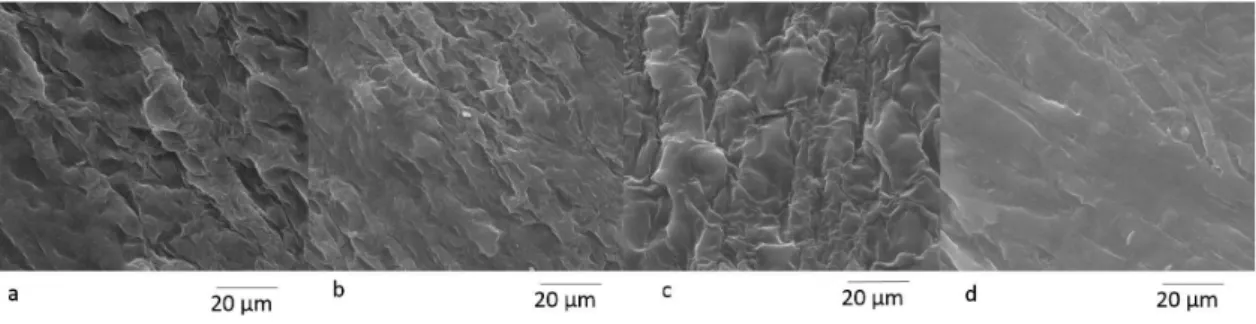
The surfaces of the extruded ilms were examined using SEM (Figure 7). The control ilm, the RH-ilm and the RHB-ilm had rough surfaces, without any ibers of agglomeration. The RHNF-ilm demonstrated a more homogeneous and smooth surface (Figure 7d) than the other samples. The nanoibers were well dispersed and covered by the matrix, suggesting that the introduction of cellulose nanoibers into the starch-glycerol ilms resulted in improved adhesion between the nanoibers and the polymer matrix.
The densities of the starch ilms were not signiicantly (Tukey test, p ≤ 0.05) affected by the addition of iber (Table 1). The opacity of the ilms decreased with the addition of RHNF1h (Table 1). Transparency is an indirect measure of the size and dispersion of cellulose nanoibers in the ilm matrix. The transparency decreases because of increased light scattering20 when the cellulose reinforcement is not nanoscale or is aggregated.
The WVP for the starch ilms decreased with the addition of nanoibers (Table 1). This effect was not observed for
the addition of RH or RHB. Kaushik et al.20 observed the identical effect after the addition of cellulose nanoibrils from wheat straw on starch ilms. They also reported that the WVP decrease in starch ilms is related to a reduction in the diffusion coeficient because of the ibers. Fiber agglomeration, a reduction in matrix homogeneity and detrimental effects to the barrier properties occurs when the nanoiber loading is above 10%. In this work, we used a nanoiber addition of 2.5%. This loading improved ilm barrier properties. However, the addition of RH and RHB did not affect the WVP of the ilms. This result may be related to the less homogeneous ilm matrix that was observed in the SEM images.
The mechanical properties of the starch ilms were affected by the addition of ibers (Table 1). The addition of RH and RHB resulted in a decrease in tensile strength. This decrease may be associated with the non-homogeneity of the ilm matrix. The addition of RHNF1h resulted in an increase in tensile strength and elongation, and a decrease in Young´s modulus.
Some authors have suggested that the addition of nanoibers may reinforce starch ilms matrices and improve tensile strength, indicating eficient bonding and stress transfer from the matrix to the iber20.
4. Conclusions
NaOH pre-treatment followed by peracetic acid bleaching was effective at reducing the lignin content in rice hulls. The compact structure around the cellulosic ibers was removed, and the bundles were individualized. The extraction time did not affect the properties of the cellulose nanoibers, which demonstrated an increased crystallinity index (up to 70%) and thermal stability than the raw material. Therefore, these materials could be produced after 1 h of hydrolysis (low energy consumption). The nanocellulose crystallized as interconnected webs of tiny nanoibers with diameters < 100 nm and lengths of several micrometers. These dimensions resulted in a wide range of aspect ratios.
The addition of 2.5% (w/w) of the nanofibers to starch-glycerol ilms (produced by extrusion) resulted in the opacity, water vapor permeability and improved mechanical properties of starch ilms. These results suggest that this renewable source of agro-industrial residue has promise as a reinforcing agent in polymer composites.
Acknowledgements
The authors wish to thank the Laboratory of Microscopy and Microanalysis (LMEM) and the Laboratory of X-Ray Diffraction (LARX) - State University of Londrina for the analyses, and CNPq - Brazil (No. 479768-2012-9) for inancial support.
References
1. Brinchi L, Cotana F, Fortunati E and Kenny JM. Production
of nanocrystalline cellulose from lignocellulosic biomass:
technology and applications. Carbohydrate Polymers. 2013;
94(1):154-169. http://dx.doi.org/10.1016/j.carbpol.2013.01.033.
2. Alemdar A and Sain M. Isolation and characterization of
nanofibers from agricultural residue - wheat straw and soy
hulls. Bioresource Technology. 2008; 99(6):1664-1671. http://
dx.doi.org/10.1016/j.biortech.2007.04.029.
3. Purkait BS, Ray D, Sengupta S, Kar T, Mohanty A and Misra M. Isolation of cellulose nanoparticles from sesame husk. Industrial and Engineering Chemistry Research. 2011; 50(2):871-876. http://dx.doi.org/10.1021/ie101797d.
4. Flauzino WP No, Silvério HA, Dantas NO and Pasquini D. Extraction and characterization of celulose nanocrystals from
agroindustrial residue-soy hulls. Industrial Crops and Products.
2013; 42:480-488. http://dx.doi.org/10.1016/j.indcrop.2012.06.041.
5. Soltani N, Bahrami A, Pech-Canul MI and Gonzalez LA. Review on the physicochemical treatments of rice husk for production
of advanced materials. Chemical Engineering Journal. 2015;
264:899-935. http://dx.doi.org/10.1016/j.cej.2014.11.056.
6. Dagnino EP, Chamorro ER, Romano SD, Felissia FE and Area
MC. Optimization of the acid pretreatment of rice hulls to obtain
fermentable sugars for bioethanol production. Industrial Crops
and Products. 2013; 42:363-368. http://dx.doi.org/10.1016/j. indcrop.2012.06.019.
7. Banerjee S, Sen R, Pandey RA, Chakrabarti T, Satpute D, Giri BS, et al. Evaluation of wet air oxidation as a pretreatment strategy for bioethanol production from rice husk and process
optimization. Biomass and Bioenergy. 2009; 33(12):1680-1686.
http://dx.doi.org/10.1016/j.biombioe.2009.09.001.
8. Satyanarayana KG, Arizaga GGC and Wypych F. Biodegradable
composites based on lignocellulosic fibers - an overview.
Progress in Polymer Science. 2009; 34(9):982-1021. http:// dx.doi.org/10.1016/j.progpolymsci.2008.12.002.
9. Abdul Khalil HP, Bhat AH and Ireana Yusra AF. Green composites from sustainable cellulose nanoibrils: a review. Carbohydrate Polymers. 2012; 87(2):963-979. http://dx.doi.org/10.1016/j. carbpol.2011.08.078.
10. Abdul-Khalil HP, Davoudpour Y, Nazuruyl Islam M, Asniza M, Sudesh K, Dungani R, et al. Production and modification of
nanofibrillated cellulose using various mechanical processes:
a review. Carbohydrate Polymers. 2014; 99:649-665. http://
dx.doi.org/10.1016/j.carbpol.2013.08.069.
11. Janoobi M, Harun J, Shakeri A, Misra M and Oksman K.
Chemical composition, crystallinity and thermal degradation
of bleached and unbleached kenaf bast (Hibiscus cannabinus)
pulp and nanofiber. BioResources. 2009; 4(2):626-639.
12. Hassan ML, Mathew AP, Hassan EA, El-Wakil NA and Oksman K. Nanofibers from bagasse and rice straw: Process optimization
and properties. Wood Science and Technology. 2010;
46:193-205. http://dx.doi.org/10.1007/s00226-010-0373-z.
13. Ferrer A, Filpponen I, Rodríguez A, Laine J and Rojas OJ. Valorization of residual Empty Palm Fruit Bunch Fibers (EPFBF) by microfluidization: production of nanofibrillated cellulose and EPFBF nanopaper. Bioresource Technology. 2012; 125:249-255. http://dx.doi.org/10.1016/j.biortech.2012.08.108.
14. Qua EH, Hornsby PR, Sharma HS and Lyons G. Preparation and
characterisation of cellulose nanofibers. Journal of Materials
Science. 2011; 46(18):6029-6045. http://dx.doi.org/10.1007/ s10853-011-5565-x.
15. Abraham E, Deepa B, Pothan LA, Jacob M, Thomas S, Cvelbar U, et al. Extraction of nanocellulose fibrils from lignocellulosic
fibres: a novel approach. Carbohydrate Polymers. 2011;
86(4):1468-1475. http://dx.doi.org/10.1016/j.carbpol.2011.06.034.
16. Paschoal G, Muller CM, Carvalho GM, Tischer CA and Mali
S. Isolation and characterization of nanofibrillated cellulose Table 1. Density, opacity, water vapor permeability (WVP) and mechanical properties of starch-glycerol ilms reinforced with RH, RHB and RHNF1h.
Sample ilm Density (g/cm3) Opacity WVP x 1010 (g/
msPa)
Mechanical Propertiesd
TS (MPa) E (%) YM (MPa)
Control ilm 0.11±0.01a 206±27a 2.30±0.15a 21±3a 10±3b 131±19a
RH-ilm 0.11±0.01a 213±14a 2.80±0.58a 8±1c 8±1b 122±18a
RHB-ilm 0.11±0.01a 185±12a,b 2.11±0.43a,b 12±2b 10±2b 124±20a
RHNF-ilm 0.12±0.01a 169±3b 1.80±0.10b 18±3a 15±1a 54±12c
a,b,c- Different letters in the same column indicate signiicant differences (p ≤ 0.05) between means (Tukey test). d- TS = tensile strength; E = elongation;
from oat hulls. Quimica Nova. 2015; 38(4):478-482. http:// dx.doi.org/10.5935/0100-4042.20150029.
17. Kaushik A, Singh M and Verma G. Green nanocomposites
based on thermoplastic starch and steam exploded cellulose
nanofibrils from wheat straw. Carbohydrate Polymers. 2010;
82(2):337-345. http://dx.doi.org/10.1016/j.carbpol.2010.04.063.
18. Siqueira G, Bras J and Dufresne A. Cellulosic bionanocomposites:
a review of preparation, properties and applications. Polymers.
2010; 2(4):728-765. http://dx.doi.org/10.3390/polym2040728.
19. Ng HM, Sin LT, Tee TT, Bee ST, Hui D, Low CY, Rahmat AR. Extraction of cellulose nanocrystals from plant sources
for application as reinforcing agent in polymers. Composites
Part B. 2015; 75:176-200. http://dx.doi.org/10.1016/j. compositesb.2015.01.008.
20. Hietala M, Mathew AP and Oksman K. Bionanocomposites
of thermoplastic starch and cellulose nanofibers manufactured
using twin-screw extrusion. European Polymer Journal. 2013;
49(4):950-956. http://dx.doi.org/10.1016/j.eurpolymj.2012.10.016.
21. Association of Official Analytical Chemists – AOAC. Oficial
Methods of Analysis of the Association of Oficial Analytical
Chemists. 14th ed. Washington: AOAC; 2003.
22. American Association of Cereal Chemists – AACC. Approved
Methods of the American Association of Cereal Chemists. 8th
ed. St. Paul Minnesota: AACC; 1990. http://dx.doi.org/10.1002/
star.19890411114.
23. Updegraff DM. Semi-micro determination of cellulose in
biological materials. Analytical Biochemistry. 1969;
32:420-424.
24. Technical Association of the Pulp and Paper Industry - TAPPI.
Tappi Test Method T222 om-88, Acid-insoluble lignin in wood and pulp. Atlanta: Tappi Press; 1999.
25. Chawla R and Patil GR. Soluble dietary fiber. Comprehensive Reviews in Food Science and Food Safety. 2010; 9(2):178-196. http:// dx.doi.org/10.1111/j.1541-4337.2009.00099.x.
26. Teodoro KB, Teixeira EM, Corrêa AC, Marconcini JM and Mattoso LH. Whiskers de fibra de sisal obtidos sob diferentes
condições de hidrólise ácida: efeito do tempo e da temperatura
de extração. Polímeros. 2011; 21(4):280-285.
27. Segal L, Creely JJ, Martin AE Jr and Conrad CM. An empirical
method for estimating the degree of crystallinity of nature
cellulose using the x-ray diffractometer. Textile Research
Journal. 1959; 29:786-794.
28. Sobral PJ. Influência da espessura de biofilmes feitos à base
de proteínas miofibrilares sobre suas propriedades funcionais.
Pesquisa Agropecuaria Brasileira. 2000; 35(6):1-14.
29. American Society for Testing and Materials – ASTM. ASTM E9600: standard test methods for water vapor transmission of material. Philadelphia: ASTM; 2000.
30. American Society for Testing and Materials – ASTM. ASTM D882-91: standard test methods for tensile properties of thin plastic sheeting. Philadelphia: ASTM; 1996.
31. Patel M, Karera A and Prasanna P. Effect of thermal and chemical treatments on carbon and silica contents in rice husk. Journal of Materials Science. 1987; 22(7):2457-2464.
32. Liou TZ. Evolution of chemistry and morphology during the carbonization and combustion of rice husk. Carbon. 2004; 42(4):785-794. http://dx.doi.org/10.1016/j.carbon.2004.01.050.
33. Gürsoy N and Dayioğlu H. Evaluating peracetic acid bleaching
of cotton as an environmentally safe alternative to hypochlorite
bleaching. Textile Research Journal. 2000; 70(6):475-480.
http://dx.doi.org/10.1177/004051750007000602.
34. Krizman P, Kovac F and Tavcer P. Bleaching of cotton fabric
with peracetic acid in the presence of different activators.
Coloration Technology. 2005; 121(6):304-309. http://dx.doi. org/10.1111/j.1478-4408.2005.tb00373.x.
35. El-Shafie A, Fouda MM and Hashem M. One-step process
for bio-scouring and peracetic acid bleaching of cotton fabric.
Carbohydrate Polymers. 2009; 78(2):302-308. http://dx.doi. org/10.1016/j.carbpol.2009.04.002.
36. Johar N, Ahmada I and Dufresne A. Extraction, preparation
and characterization of cellulose fibres and nanocrystals from
rice husk. Industrial Crops and Products. 2012; 37(1):93-99. http://dx.doi.org/10.1016/j.indcrop.2011.12.016.
37. Sun JX, Sun XF, Zhao H and Sun RC. Isolation and characterization
of cellulose from sugarcane bagasse. Polymer Degradation &
Stability. 2004; 84(2):331-339. http://dx.doi.org/10.1016/j. polymdegradstab.2004.02.008.
38. Deepa B, Abraham E, Cherian BM, Bismarck A, Blaker JJ, Pothan LA, et al. Structure, morphology and thermal characteristics of
banana nano fibers obtained by steam explosion. Bioresource
Technology. 2011; 102(2):1988-1997. http://dx.doi.org/10.1016/j. biortech.2010.09.030.
39. Morán JI, Alvarez VA, Cyras VA and Vázquez A. Extraction
of cellulose and preparation of nanocellulose from sisal fibers.