A
R
T
I
G
O
T
É
C
N
I
C
O
C
I
E
N
T
Í
F
I
C
O
Introduction
Transport of gases and vapors in polymers is an important subject both from technological and scientific point of view. Applications include protective coatings, packing materials for food, and selective barriers for gas or liquid mixture. In the case of food packages, polymeric materials should exhibit an adequate CO2/O2 ratio (generally lower than 7)[1]. The
process of permeation involves dissolution of the gas in one side of the membrane, diffusion of the gas through it and release of the gas from the other side of the membrane. When dealing with glassy polymers, it is important to note that permeability characteristics depend on thermal history of the polymer[2]. A conventional method for determining
permeability and diffusion coefficients in polymers involves the measurement of membrane weight gain versus time until the final mass of equilibrium is reached[3].
Photoacoustic (PA) spectroscopy and related photothermal techniques[4-6] are well-established spectroscopic techniques.
The PA technique, apart from providing direct optical absorption spectra[7,8], can also be used to perform depth profile
analysis[7,9], and characterization of thermal properties[10,11].
In addition, there has been a substantial development of new, versatile and competitive instrumentation and experimental methodologies suitable for use in daily practice. Further details on the photothermal wave phenomenon and its applications can be found in the books by Rosencwaig[4] and Almond[6]
and in some of many published reviews on the subject[5,12,13].
Recently, photothermal techniques have been applied to the determination of diffusion coefficients in biopolymers[14].
However, the complete validation of this new methodology
demands the characterization of diffusion coefficients of plastic films commercially employed, which has been achieved successfully using traditional gravimetric techniques. Regarding this, the aim of the present work is to demonstrate the potentiality of photothermal techniques in the plastic packages quality control studying the diffusion properties of commercial low density polyethylene (LDPE) packages, a widespread used material for wrapping food and vegetables in day-to-day life. In order to support the gas diffusion results, thermophysical properties and crystallinity degree of samples are also determined.
Materials and Methods
Materials and Characterization Materials and CharacterizationMaterials and Characterization Materials and Characterization Materials and Characterization
LDPE samples used in this work were obtained from commercial transparent packages with thickness of 40µm manufactured through conventional extrusion process by Elanlec Embalagens (Campos dos Goytacazes, RJ), using low density polyethylene with melt flow index 7.5 g/10min and density 0.919 g/cm3 supplied by Polietilenos União in
the form of pellets.
Sample Crystallinity Sample CrystallinitySample Crystallinity Sample Crystallinity Sample Crystallinity
Membrane crystallinity was determined from X-ray diffraction analysis. A Seifert-FPM model URD65 X-ray generator with a Ni filter to provide Cu Ka radiation (λ = 0.1542 nm) was used. Scans were recorded at a scan speed of 0.1º and an exposure time of 10s. The degree of crystallinity, Xc was obtained from the diffractogram
according to the following relationship:
Polyethylene Food Packages
Luiz H. Poley, Ana P. L. Siqueira, Marcelo G. da Silva, Helion Vargas
Laboratório de Ciências Físicas, UENF
Rubén Sanchez
Laboratório de Materiais Avançados, UENF
Abstract: The present work discuss the applicability of photothermal techniques for determining diffusion coefficients of oxygen and carbon dioxide of commercial low-density polyethylene (LDPE). The methodology involves the monitoring of diffused gas by a photoacoustic analyzer. Diffusion coefficients measured for CO2 and O2 were 2.77 x 10⁻⁸ cm2/s and 1.68 x 10⁻⁷ cm2/s, respectively. To support the gas diffusion results, thermal properties were studied using photoacoustic spectroscopy and crystallinity was determined using X-ray diffraction. Values obtained for thermal diffusivity and specific heat capacity were 1.65 x 10⁻³cm2/s and 2.33 J.cm-3K-1, which are in good agreement with values available in the literature for pure LDPE and thus assure reliability of diffusion coefficients values.
Keywords: Photoacoustic spectroscopy, LDPE, diffusion coefficients.
T A T C
A
A
A
X
=
(
−
)
(1)Where AT denotes the total area of the diffractogram and AA
denotes the area corresponding to the amorphous region.
Thermal Analysis Thermal Analysis Thermal Analysis Thermal Analysis Thermal Analysis
Thermal behaviour of the films was determined in a Calorimeter model DSC- 2010 from TA instruments, using Indium as calibration reference. Samples of 20mg were heated from 223K to 473K at 8K min-1 in aluminum pans. The
enthalpy of fusion was used to determine sample crystallinity using the following relation:
0
H
H
X
C f∆
∆
=
(2)Where Xc is the crystalline fraction, ∆Hf is the enthalpy of
fusion measured by DSC and ∆H0 is the enthalpy of fusion
for 100% crystalline polymer.
Thermal Diffusivity Measur Thermal Diffusivity Measur Thermal Diffusivity Measur Thermal Diffusivity Measur Thermal Diffusivity Measurementsementsementsementsements
LDPE packages were cut in small pieces (1cm X 1cm). The room temperature characterization of the samples thermal properties was based upon the measurements of the thermal diffusivity, α, and of the heat capacity, ρcp, where ρ is the
material density and cp the specific heat at constant pressure
(heat capacity per unit volume). To complete the determination of the sample thermal properties, knowing α and ρcp, the sample
thermal conductivity, k, is readily obtained from the equation p
c
k
=
αρ
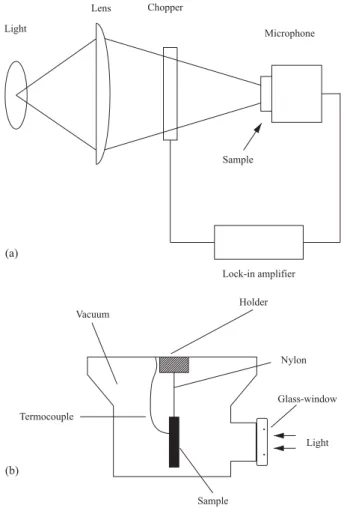
(3)The thermal diffusivity can be accurately measured by the PA technique. This technique looks directly at the heat generated in a sample, due to a thermal relaxation process, following the absorption of light. Among several experimental set-ups the open photoacoustic cell (OPC) method was used here. It consists of mounting the samples directly onto a cylindrical electret microphone and using the front air chamber of the microphone itself as the usual gas chamber of conventional photoacoustic cell[4]. As a result of a periodic heating of the sample following
the absorption of modulated light, the pressure in the microphone chamber oscillates at the chopping frequency yielding the photoacoustic signal. The experimental arrangement (Figure 1a) consisted of a 100 mW Ar laser (Omicron Model 543-AP) whose beam was modulated with a mechanical chopper (EG&G Model 650). The sample was placed directly above the opening of the microphone convering it. The signal from the microphone was connected to a lock-in amplifier (EG&G Model 5210) used to register both signal amplitude and phase.
For the present samples, the contribution to the PA signal from the thermoelastic bending is the dominant. This effect is essentially due to the temperature gradient created inside the sample along an axis perpendicular to the surface
exposed to the incident radiation [15]. Owing to the existence of
this gradient, a differential thermal expansion along sample thickness is generated. This effect induces a periodic bending of the sample in this direction (drum effect), i.e., the vibrating sample acts as a mechanical piston, producing the PA signal. According to the theoretical development proposed by Rousset
et al.[15], in the thermally thick regime (sample thickness l s
exceeds the thermal diffusion length m=(a/pf) 1/2, where f is
the modulation frequency of the incident light), the pressure fluctuation in air chamber of the PA cell resulting from the thermoelastic displacement of the sample is proportional to
+ + + −
∝ ω π φ
δ 2 exp 1 1 1
1 1/2
2 j t
x x f
p (4)
where x = lsas = ls(πf/αs)1/2 and tanφ = 1/(x-1). Eq. 3 means
that the thermoelastic contribution, at high modulation frequency such that x >> 1, varies as f-1 and its phase πφ as
−
+
=
1
1
arctan
x
oφ
φ
(5)Thus, for a thermally thick sample, if the thermoelastic contribution is dominant, the thermal diffusivity can be
evaluated from the modulation-frequency dependence of the signal amplitude, Eq.4, or its phase, Eq.5. In the derivation of Eqs. 4 and 5, Rousset and co-workers have assumed that the sample is optically opaque and that the heat flux into the surrounding air is negligible. The implicit optical opaqueness condition was ensured by the use of a thin circular absorbing Al foil (14 µm thick and 5 mm diameter) attached to the front surface of the sample using a thin layer of thermal paste to guarantee a good thermal contact between the sample and the Al foil. The thermal diffusion time in this Al foil is in the order of 13.6 ms so that the heat generated in the thin Al absorber is instantaneously transmitted to the sample.
Heat capacity measur Heat capacity measurHeat capacity measur Heat capacity measurHeat capacity measurementementementementement
The heat capacity per unit of volume, ρcp, was measured
using the temperature rise method under continuous white light illumination. Samples were painted on both surfaces with a very thin film of black paint and were adiabatically suspended in a Dewar flask, which was subsequently vacuum-sealed (~10-2 Torr) (Figure 1b). Under these conditions the
main heat-loss mechanism was by radiation. The Dewar flask has an entrance glass window through which the continuous white-light beam was focused onto one of sample surfaces. A thermocouple was attached on the opposite surface using thermal paste. In this way, the temperature evolution of the back surface could be monitored as a function of time. The surface temperature rise is given by[16]
(
τ
ρ
)
(
/τ)
0 ls cp 1 e t I
T = − −
∆ (6)
where I0 is the intensity of the incident light and τ = lsρcp/(2H)
is the rise temperature, H = 4σT03 being the radiative
heat-transfer coefficient, where σ is Stefan-Boltzmann constant and
T0 is the ambient temperature. The parameter τ is determined
by fitting the exponential data with Eq. 6.
Diffusion coefficient measur Diffusion coefficient measurDiffusion coefficient measur Diffusion coefficient measurDiffusion coefficient measurementsementsementsementsements
Permeation studies of CO2 and O2 were performed using a
sample holder having its sides sealed off one from another. The permeate gas in study was introduced on one side and
kept at a constant pressure of 0.05 atm. On the other side the concentration of the gas was measured using a photoacoustic gas analyzer (URAS 14 from Hartman and Braun) as it was being stored (Figure 2). The gas concentration rise, in these conditions, is given by[14]:
)
1
(
/0
D
t
e
C
C
=
−
− τ (7)Where C0 = gas concentration at saturation, τD= ls2/2D = gas
diffusion time, where D is the gas diffusion coefficient and ls
is the sample thickness (40µm) in this case. Thus, by monitoring the time evolution of the gas concentration the gas diffusion time, τD, can be determined and thus, the
diffusion coefficient D. All measurements were performed in room temperature (27 °C).
Results and Discussion
Material Characterization Material CharacterizationMaterial Characterization Material CharacterizationMaterial Characterization
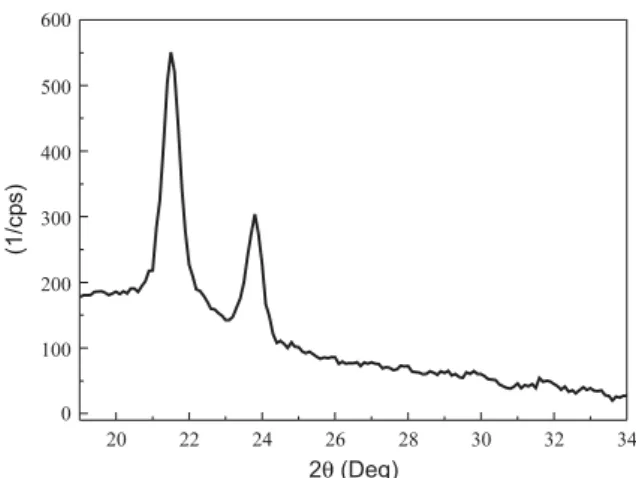
In the X-ray diffractogram of LDPE (Figure 3), charac-teristics peaks can be identified at 21.5 and 23.8 of 2θ. Sample crystallinity degree obtained from X-ray diffractogram using eq. 1 was 38% .
From thermal analysis (Figure 4), glass transition temperature, melting temperature and heat of fusion of samples were determined as – 48 °C, 113 °C and 114 J/g,
Figure 2. Experimental arrangement used for gas diffusion studies.
Figure 3. X-ray diffractogram of LDPE.
respectively. Using the DSC enthalpy of fusion and taking 290J/g [17] as the value for the fully crystalline LDPE, a value
of 40% of crystallinity was found, in agreement with X-ray diffraction.
In Figure 5 is shown a typical PA signal frequency dependence for low density polyethylene. It can be seen that for modulation frequencies higher than 100 Hz, the signal amplitude scales essentially as f -0.94, a value close to f -1.
This frequency dependence of the PA signal of a thermally thick sample confirms the thermoelastic bending as the dominant mechanism responsible for the acoustic signal[18].
Accordingly, the thermal diffusivity was evaluated fitting phase data to Eq. 5. Figure 6 shows experimental data and fitting curve (solid line). The value of the thermal diffusivity obtained from the data fitting was 1.65 x 10⁻³ cm2s-1, with an
error of 5%. This value agrees with values present in literature for pure LDPE[19].
To complete the determination of the thermal properties of the sample, we have measured the heat capacity per unit of volume. In Figure 7 is shown the back surface temperature arise as function of the time, after commencement of the sample illumination. The error in the data fit is about 10%.
Figure 7 also shows the cooling of the back surface of the sample when the illumination is switched off. The solid lines represent the best fit of the experimental data to Eq. 6 using τ as an adjustable parameter. From the value of τ we obtained the experimental value of the thermal capacity, ρcp. We found
ρcp= 2.33 J.cm-3K-1, with an error of 10%, for the LDPE
sample. The thermal conductivity k was determined using the measured values of ρcp and thermal diffusivity, a using
Eq. 3. The value obtained is 3.84 10-3 J.cm-1K-1s-1, which is
also in good agreement with values present in the literature[20].
Diffusion Coefficients Diffusion Coefficients Diffusion Coefficients Diffusion Coefficients Diffusion Coefficients
Concentrations of CO2 and O2 in the analyzer chamber in
function of time are presented in Figure 8. The fitting of experimental data to Eq. 7 allows the determination of diffusion coefficients. The values obtained for diffusion coefficients of LDPE to O2 and CO2 were 1.68 x 10⁻⁷ cm2/s and 2.77 x
10-8 cm2/s, respectively. These values agree with those
presented in literature for LDPE [20](6.9 x 10⁻⁸ cm2/s for CO 2
and 4,6 x 10⁻⁷ cm2/s for O
2). Differences can be probably
Figure 5. Modulation frequency dependence of PA signal for LDPE.
Figure 6. Dependence of PA signal phase on the chopping frequency for LDPE.
Figure 7. Back surface temperature evolution for LDPE during heating (a) and cooling (b). The solid line represents the best fit of the experimental data to Eq.6 using τ as an adjustable parameter.
attributed to differences in the thermal history of the material, since it causes variations in crystallinity degree and morphology. These features may introduce a sensitive impact in the barrier effect in the polymer, since crystallites are considered to be impermeable and morphology affects segmental chain mobility in amorphous phase, which plays important role in diffusion[21,22]. This explanation can be
supported by experimental results obtained using conventional techniques that point out a decrease of 80% in permeability of polyethylene to nitrogen, carbon dioxide and oxygen in consequence of a variation of 20% in sample crystallinity[23].
Considering this, it can be said that the photothermal method for determining diffusion coefficients in polymers gives reliable results which enlarges its horizons in the characterization of materials.
Conclusion
In this paper we have reported on the measurements of the thermal and sorption properties of Low-density Poly-ethylene packages using the PA techniques. The results agree with values available in literature using conventional techniques, which indicates the success of the methodology used.
Acknowledgments
The authors wish to thanks CAPES and CNPq for the financial support to this work.
References
1. Marais, S.; Saiter J. M.; Devallencourt, C.; Nguyen, Q.T.; Métayer, M. – Polymer Testing 21 p. 425, (2002).
2. Compañ, V.; Ribes, A.; Díaz-Calleja, R.; Riande, E. – Polymer 37 p. 2243, (1998).
3. Neogi, P. - Diffusion in Polymers; Marcel Dekker, New York, (1996)
4. Rosencwaig, A. - Photoacoustic and Photoacoustic Spectroscopy; Wiley; New York, (1980).
5. Vargas, H. and Miranda, L. C. M. - Phys. Rep. 161 p.43, (1998).
6. Almond, D. and Patel, P. - Photoacoustic and Photothermal Science and Techniques; Chapman and Hall; London, (1966).
7. Nery, J. W.; Pessoa Jr, O.; Vargas, H.; Reis, F. A. M.; Vinha, C.; Gabrielli, A. and Miranda, L. C. M. - Analyst 112 p.1487, (1987).
8. Anjo, A. M. and Moore, T. A. - Photobiology 39 p.635, (1984).
9. Busse, G. - Appl. Opt. 31 p.107, (1982).
10. Alvarado-Gil, J. J., Vargas, H.; Sanches-Sinencio, F.; Gonzales-Hernadez, J and Miranda, L. C. M. - Opt. Eng. 36, p.348, (1997).
11. Calderon, A.; Alvarado-Gil, J. J.; Gurevich, Y. G.; Cruz-Orea, A; Delgadillo, I., Vargas, H. and Miranda, L. C. M. - Phys. Rev. Lett. 25, p.5022, (1997).
12. Kinney, J. B. and Staley, R. H. - Annu. Rev. Mater. Sci. 12, p.295, (1992).
13. Torres-Filho, A.; Leite, N. F.; Miranda, L. C. M.; Cella, N.; and Vargas, H. - J. Appl. Phys. 66 p. 97, (1989).
14. Silva, M. G.; Gonçalves, S. S.; Sthel, M. S.; Schramm, D. U.; Sánchez, R. R.; Rieumont, J. B.; Vargas, H. – Rev Sci Instrum 74, p. 831, (2003).
15. Rousset, G.; Lepoutre, F. and Bertrand, L. - J. Appl. Phys. 54 p.2383, (1983).
16. Hatta I. - Rev. Sci. Instrum., 50, 292, (1979).
17. Wunderlich, B. - Thermal Analysis; Academic Press, New York, (1990).
18. Leite, N. F.; Cella, N.; Vargas, H. and Miranda, L. C. M. - J. Appl. Phys. 61 p.3025, (1987).
19. Grzegorczyk, D.; Feineman, G. - Handbook of Plastics in Eletronics, Reston, (1974).
20. Brandup, J.; Immergut, E. H. - Polymer Handbook, John Wiley & Sons, New York, (1989).
21. Aniello, C.; Guadagno, L.; Gorrasi, G. and Vittoria, V. – Polymer 41 p.2515, (2000).
22. Hedenqvist, M.; Gedde, U. W. – Prog. Poly. Sci. 21 p. 299, (1996).
23. Comyn, J. - Polymer Permeability; Elsevier, London, (1985).