DOI: http://dx.doi.org/10.1590/2446-4740.0636
*e-mail: [email protected]
Received: 18 August 2014 / Accepted: 25 May 2015
Recognition of heart sound based on distribution of Choi-Williams
Tianhua Chen*, Lingzi Xiang, Meina Zhang
Abstract Introduction: To realize noninvasive diagnosis and early diagnosis of coronary heart disease, the study proposes a new time-frequency method for analyzing heart sound signals. This method is based on Choi-Williams Distribution (CWD). Methods: CWD distribution is developed and modiied from Wigner Ville distribution
(WVD). To solve the problem of cross-term interference existing in WVD there is an improved version of WVD,
called Choi-Williams Distribution (CWD), which introduces the smoothing window as the kernel function and deals with the time-frequency analysis of heart sound signal. Results: The improved method has good
performance and can be implemented simply without much increase of operation complexity. Conclusion: In this paper, 21 cases of heart sound signals are acquired from the outpatients and hospitalized patients with coronary heart diseases. The research results of 21 cases show that the CWD method can be used to analyze
heart sounds. It accurately identiies the 9 cases of heart sounds of health people and 12 cases of heart sounds
of patients with coronary heart disease. Besides, the CWD displays obvious differences between heart sounds of healthy people and abnormal heart sounds. The contour line of heart sounds from healthy people shows the following characteristics: concise, columnar and non-divergence; while the contour line of abnormal heart sounds is divergent and has many columnar links. These research shows that CWD method can effectively distinguish heart sounds between healthy people and patients with coronary heart disease.
Keywords: Heart sound signals, Choi-Williams distribution, Biomedical signal processing, Non-invasive diagnosis, Time-frequency analysis.
Introduction
Owing to the continuous improvement of living standard and increasing life rhythm, the incidence of cardiovascular diseases is higher in recent years. Modern medical research shows that heart sound
relects the movement status of heart and cardiovascular
system, and contains a lot of information obtained from clinical diagnosis of cardiovascular disease (Zhao et al., 2005). Heart sounds diagnosis reveals the relationship between heart sounds and heart disease by using modern digital signal processing technology and biomedical engineering technology. Before the occurrence of ECG abnormalities, which are caused by diseases associated with heart, pain and other symptoms, as well as the noise and distortion of heart sounds are mainly adopted to diagnose cardiac disease in early-stage (Chen et al., 2010). Therefore, the diagnosis and treatment of cardiovascular diseases
are of great signiicance, especially the noninvasive
diagnosis technology based on modern information technology.
Heart sounds and their composition
In the cardiac cycle, heart sounds are caused by mechanical vibration of myocardial contraction
and relaxation, and the opening and closing of
valves. Blood low impacts ventricle, the aorta, etc.,
through the surrounding tissue to the chest wall and generates weak vibration signal. When you put the ear or a sensor, such as, a stethoscope close to chest wall or related parts of chest hall, we can listen or
detect heart sound signals. The irst and second heart
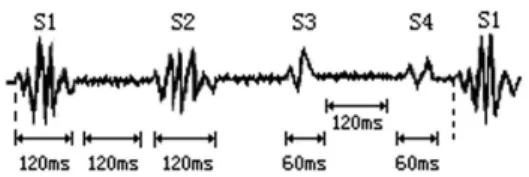
sounds can be easily detected form the normal heart sounds, while the third or the forth heart sounds can only be detected in some cases. Each component and duration of heart sounds as shown in Figure 1 (Chen et al., 2010).
S1 starts 0.02~0.04 seconds lagging behind the beginning of QRS wave in the electrocardiogram, lasting for about 0.08-0.15 seconds. It is caused by
the lowing of blood into aorta, when both the mitral
valve and the tricuspid valves close, and ventricular systole occurs. S2 starts from the tail of T wave in the electrocardiogram, caused by 1) the vibration of ventricular wall when ventricular diastole happenes
and 2) the lowing of blood from atrium into ventricle,
when both aortic valve and pulmonary valve close and atrio-ventricular valves open. S2 happens at the beginning of diastole. Its frequency is comparatively high and its duration (about 0.07~0.12 seconds) is shorter than S1.
S3 shows low-frenquency and small- amplitude. It is 0.12~0.20 seconds away from S2 behind the T wave in the electrocardiogram and lasts for 0.05~0.06 seconds. S3 is caused by the vibration of the ventricular wall. S4 lags behind P wave for 0.15~0.18 seconds, and S4 generally has small- amplitude and is caused by the
case that blood stream lows rapidly into the ventricle
and vibrates the ventricular wall.
Detection and signiicance of heart sounds Heart sounds are a kind of important physiological signals of human body. The signals contain a lot of information about the situation of heart pathology
and relect the structure of heart and cardiovascular
and its physiological and pathological information (Zang et al., 2014). Heart sounds are a kind of weak biological signals of the human body under strong noise background, and are easily affected by human factors. The change of heart sounds (including strength and property) and the presence of noise are often early symptoms of heart disease. Therefore, the analysis of
heart sounds is of great signiicance to the diagnosis
of diseases of the cardiovascular system.
The generation of coronary heart disease
Cardiovascular disease, as an important factor endangers human health, has become the major disease and important cause of death due to illness. According to the statistics from world health organization, heart disease, cerebrovascular disease, acute lung infection, copd, and AIDS associated heart diseases are top causes of death in the world (Ye et al., 2003).
Since 1985, in China, the death toll caused by heart disease has stayed irmly top three. The mortality of coronary heart disease in cities is 36.9/10 and that
in countryside is 15.6/10. And the deaths caused by Coronary heart disease account for 4.47% of the total death (male) and 3.72% (female). More than a decade of research and statistical monitoring data from the navy general hospital in Beijing also show that the incidence of cardiovascular disease in Beijing area grows continuously, with an average annual growth rate of 2.3%. The coronary heart disease (CHD) in
male rises more signiicantly than female.
Coronary heart disease is a clinical syndrome caused by the absolute or relative reduce of myocardial
blood supply. This disease is caused by the coronary
circulation change, coronary artery blood low, and
imbalance between myocardial demands, and leads to
myocardial ischemia and hypoxia of coronary artery
lesions. Coronary heart disease is mainly caused by the organic artery stenosis or occlusion, while coronary artery stenosis or occlusion can lead to the changes of heart sound signals (Guo and Yuan, 2012).
The diagnosis value of heart sounds
Diagnosis methods of Coronary heart disease can be divided into two kinds, namely, invasive diagnosis and noninvasive diagnosis (Guo and Yuan, 2012; Pang et al., 2014; Saracoglu, 2012). Noninvasive diagnosis is often based on the electrical activity and pump activities of the heart, including the electrocardiogram, dynamic electrocardiogram and phonocardiogram, radioisotope, echocardiography and modern medical imaging technology (such as NMR, CT, PET, etc.). Invasive diagnosis of coronary heart disease mainly refers to the coronary artery imaging technology, which is the most reliable method to diagnosis coronary artery disease. But imaging
belongs to traumatic examination, with certain risk. It is complex, more expensive and brings with
serious complications and even death in some cases. Therefore, it is not suitable for a wide range of census (Guo et al., 2013; Pang et al., 2014).
It needs to be paid attention to that the existence
of the lagging problem in clinical diagnosis of heart disease using ECG. But the heart sound signals can
relect the early pathology information of heart disease,
and the inside physical state of the heart will directly affect and change heart sound signals. Similar to the diagnosis of coronary artery disease, only when coronary occlusion rates more than 70 to 75 percent at the time can cause the changes of ECG, however,
When the Coronary model next reaches 25%, it can
cause heart sounds change (Chen et al, 2010; Guo and Yuan, 2012). This suggests that the analysis of
heart sound has the practical signiicance, which is
the realized foundation of early detection, diagnosis, treatment and noninvasive diagnosis of Coronary heart disease.
Methods
Time-frequency analysis of heart sounds refers to represent the non-stationary of heart sound signals using joint distribution function of the time and frequency. It analyzes and processes the signals. This method overcomes the limitations of Fourier transform type. Time-frequency analysis can be divided into linear time-frequency and bilinear time-frequency analysis.
Linear time-frequency analysis is evolved by FFT, mainly includes short time Fourier transforms (STFT), Gabor spread and wavelet transform, etc., and
satisies superposition principle. The main advantage
is the simple theory and application, but it is hard to describe the instantaneous power spectrum of signals. Bilinear time-frequency method is also known as
quadratic time-frequency analysis, which can relect
the time-frequency distribution of signal energy, but do not satisfy the superposition principle. Quadratic time-frequency analysis mainly includes Cohen class
time-frequency distribution, Wigner Ville distribution and Afine class bilinear time-frequency distribution, among which Wigner Ville distribution and its various
deformation are most commonly used.
Choi-Williams distribution
Wigner distribution was mainly used for quantum mechanics research in theoretical physics when it was
early produced; later Ville introduced this distribution to signal analyzing ield. In the 1980 s, Claasen and
Mecklenbraker published their research papers, which concretely discuss the concept, nature, purpose and
numerical calculation method of Wigner Ville distribution. Wigner Ville distribution is the distribution of signal
energy in time domain and frequency domain, which has a clear physical meaning. In the processing of nonstationary signals, this distribution is one of the most basic and commonly used transform methods. This distribution is the important approach for the analysis of non-stationary random signal and the
solution of problems existing in the application of short time Fourier transform (STFT) to certain extent.
As Wigner Ville distribution has been widely used in the ield of non-stationary random signal processing, the
distribution has attracted the attention of many scholars.
When Cohen had an in-depth study on Wigner Ville
distribution, he found that the introduction of kernel
function in Wigner Ville distribution can exporte to
other forms of time-frequency distribution, so Wigner
Ville distribution can use the following uniied form:
* ( )
( , ) ( ) ( ) ( , )
2 2
j tv f uv
p t f =∫ ∫ ∫−∞ −∞ −∞+∞ +∞ +∞s u+τs u− ϕ ττ v e− +τ − dudvdτ (1)
Where ϕ τ( , )v is the kernel function of time-frequency distribution of Cohen class.
According to uniied deinition of Cohen class time-frequency distribution, Wigner Ville distribution of S (t) signal can be easily obtained. In the deinition,
set ϕ τ( , )v =1, Wigner Ville distribution can be concluded
as follows:
* 2
( , ) ( ) ( )
2 2
j f
W t f =∫−∞+∞s u+τ s u−τ e− π τdτ (2)
Wigner Ville distribution has high time-frequency
resolution, and symmetry, time shift characteristics,
frequency shift characteristics, expansionary in time
domain and frequency domain, modularity, reversibility,
normalization, complex conjugate, etc.
The fuzzy function
In the deinition of time-frequency distribution
of Cohen class, we can assume:
* 2
( , ) ( ) ( )
2 2
j tv
Aτv =∫−∞+∞s t+τ s t−τ e− π dt (3)
( , )
Aτv is the fuzzy function in Cohen class time-frequency distribution and the instantaneous correlation
function is deined by
*
( , ) ( ) ( )
2 2
k tτ =s t+τ s t−τ (4)
Therefore, the fuzzy function can be regarded as the Fourier inverse transformation from instantaneous correlation function about the independent variable t, namely:
1
( , ) [ ( , )]
Aτv =F− k tτ (5)
Time-frequency analysis can facilitate to descript the law that the signal energy of heart sound change
with time and frequency, Wigner Ville distribution (WVD) is a typical kind of Cohen class time-frequency
distribution. It has high time-frequency resolution and time-frequency characteristic, but its disadvantage is
dificult to eliminate cross interference item. Aiming at this defect, an improved Wigner Ville distribution,
namely, Choi-Williams distribution (CWD) is put forward to analyze the heart sounds.
In order to reduce or eliminate the inluence of
cross interference terms, and introduce a smooth window function (kernel functions), for time-frequency distribution of Cohen class, when the kernel function
is 2 2/
( , ) e−τv σ
ϕ θ τ = , and satisfy theσ >0, Cohen class time-frequency distribution becomes Choi-Williams distribution (CWD) distribution. From level of signal
processing, kernel function is one low pass ilter in fuzzy
domain, and controls the smooth strength of kernel function. For some of multi-component signals, their cross terms can be obviously suppressed. The greater the parameters, the more obvious inhibitory effect of cross terms.
As CWD exhibits excellent properties, such as
invariant feature of time and frequency shift, time and frequency edges, supported time and frequency characteristics (σ >1), etc., CWD basicaly relects
the energy distribution of heart sound signals in
time-frequency plane. When 0.1≤σ≤10, Choi-Williams
suppresses more cross items. Based on a large number of normal and abnormal heart sounds signal testing, the results show that, when σ=3, the time-frequency diagram of heart sound signals can freshly show the time zone, frequency range and the size of intensity
of irst and second heart sounds signals.
To obtain the ideal effect in using Choi-Williams
distribution for heart sound signals, the conired
parameters of this distribution include σ, window type, width of time window, window type, and width of frequency window. If the types of time and frequency
window have been identiied, only three parameters
that are frequency parameter, and the width of time window and frequency window should be determined depending on the situation.
Results
Heart sound analysis experiments
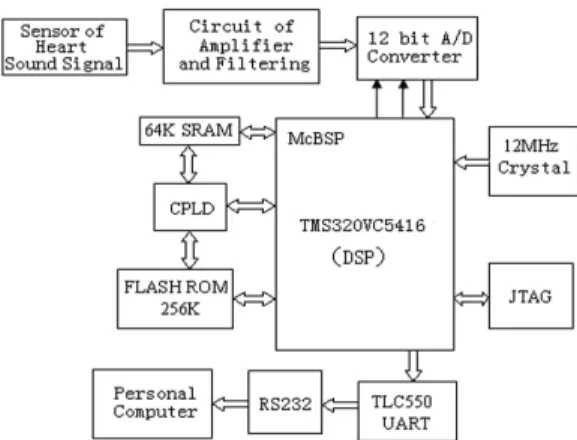
The analysis and processing of the heart sound signals are very important for diagnosing cardiovascular diseases. To acquire accurate and reliable heart signals, the project team has specially developed a heart sound acquisition system in this research. And the structure of the system is showed in Figure 2.
Heart sound sensor is also known as the transducer, which is a widely used medical sensor. It can convert the mechanical vibration sound signals formed in the impact of the blood stream on the heart wall and the
aorta to electrical signals. Ampliiers zoom in the slight
heart sound signal. Analog signals are transformed to digital signals using 12 bit A/D converter, then sent to the computer via serial communication port, and processed by computer using digital methods according to requirements. The digital methods include
the digital iltering and other analysis and processing methods. Then, pre-processing circuit ampliies and ilters the heart sound signals, and transforms analog
signals to digital signals utilizing the 12 bit A/D converter. Finally, the digital signals are transmitted
to the DSP, where heart sound signals are iltered and
then sent to computer via serial communication port, and processed by the computer.
Heart sound signals of 21 cases of were acquired
in the First Afiliated Hospital of Hunan University of Traditional Chinese Medicine, the Afiliated Hospital of Shandong Medical University and the Air Force
General Hospital by using this acquisition system, and obtained the permission of the patient. In Chinese government, there are no corresponding organizations taking charge of approving the ethics commission.
In this paper, some commonly used orthogonal wavelets in heart sound processing such as Haar, db6, sym8, coif5, etc. are acquired and compared
experimentally. As a result, db6 wavelet’s de-noising
effects are comparatively better. At the same time, the same wavelets with different decomposition
levels are compared as well. Experiments show that
when decomposition level is less than 5 layers, the effect is far from ideal; when the decomposition level equals to 5, the denoising effect is ideal; when the decomposition level is greater than 5, though the noise
cancellation works well, it ilters a considerable part
of heart sound signals at the same time. Therefore, optimal de-noising effect is obtained by using the 5-layer db6 wavelet decomposition.
Heart sound signal belongs to one time-varying and non-stationary biomedical signal. The traditional
analysis method of steady-state signal can only relect
the characteristics of the static frequency spectrum of signals. But the beating of the heart is a continuous dynamic process, if we want to obtain continuous dynamic change characteristics of the heart, we need to analyze and study the changed over- time characteristics of frequency components of heart sound. Therefore, using time-frequency analysis to study heart sound signals is an effective analysis method. Due to the good performance in analysis and processing of non-stationary signal, time-frequency
analysis has been widely used in the ield of analysis
and processing of signal in recent years, which has developed into an important branch of the signal processing disciplines.
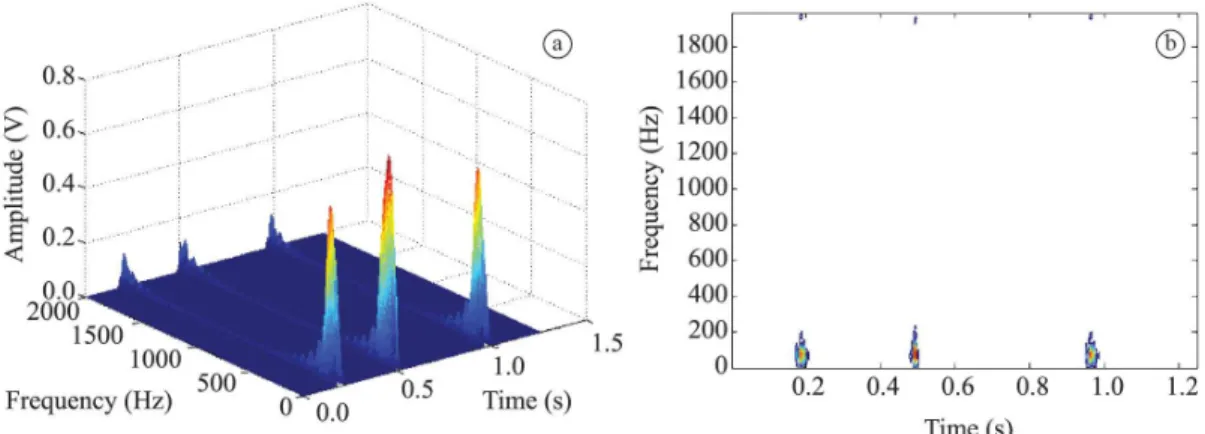
Choi–Williams distribution is utilized to analysis heart sound signals, the values of parameter for σ =3. Kaiser window is adopted in time domain and frequency
domain. The length of time window is g = 9 and the
length of frequency window is h = 27. In this research we have studied 21 cases of clinically diagnosed heart sound signals, including 12 cases of heart signals of patients with Coronary Heart Disease (CHD) and
CWD we can correctly distinguish the coronary heart sounds and healthy heart sounds. The analysis results of 5 cases of 21 cases heart sounds, including 2 cases of normal heart sounds and 3 cases of abnormal
heartsounds, as it is exempliied in Figures 3-7.
Discussion
Heart sound signals of human are biologic signals in strong noise background. Heart signals
have speciic and obvious characteristics, including
weak signals, strong noise, narrow frequency, and more randomness, that normal signals do not have.
Distribution of Choi-Williams can relect the time-varying
characteristics of the signal and the energy distribution
on time- frequency plane, which is very beneicial to
recognize the heart sound. According to distribution
of Choi-Williams of heart sounds experimental, we
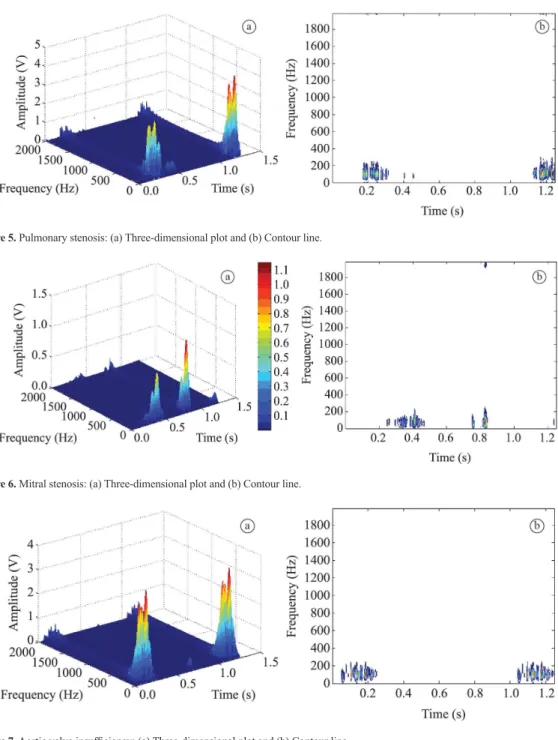
can see that the distribution of Choi-Williams from normal mind and abnormal heart sounds has obvious difference. Figures 3 and 4 show that the normal heart sounds of energy distribution are concentrated, and
Figures 5-7 show that abnormal heart sound energy distribution is dispersed apparently. These indicate that abnormal heart sounds have more heart murmurs.
The results completely accord with doctors’ clinical
diagnosis.
In this paper, 21 cases of heart sound signals were acquired from the outpatients and hospitalized patients with coronary heart diseases. The research results of 21 cases shown that the CWD method can be used to analyze the heart sounds, and the CWD displays obvious differences between heart sounds of healthy people and those abnormal heart sounds. The contour
line of heart sounds from healthy people exhibits
the following characteristics: concise, columnar and non-divergence; while the contour line of abnormal heart sounds is divergent and has many columnar links. This research shows that CWD method can effectively distinguish the heart sounds between healthy people and patients with coronary heart
disease, and can be used as an auxiliary diagnosis
for coronary heart disease.
Figure 3. Signals from normal heart sounds 1: (a) Three-dimensional plot and (b) Contour line.
Figure 5. Pulmonary stenosis: (a) Three-dimensional plot and (b) Contour line.
Figure 6. Mitral stenosis: (a) Three-dimensional plot and (b) Contour line.
Figure 7. Aortic valve insuficiency: (a) Three-dimensional plot and (b) Contour line.
Acknowledgements
The work was supported by The National College
Students’ scientiic Research and Entrepreneurial
Action Plan (SJ201401011).
References
Chen TH, Han LQ, Xing SX, Guo PY. Research of denoising method of heart sound signals based on wavelet transform. Shinese Medical Equipment Journal. 2010; 27(12):401-5.
Guo XM, Yuan ZH, Ding XR. Application of EMD and correlation dimension in classification and recognition
of heart sound. Journal of the University of Science and Technology of China. 2013; 42(6):955-60.
Guo XM, Yuan ZH. Research on heart sounds signal based on wavelet transform and empirical mode decomposition.
Zhongguo Shengwu Yixue Gongcheng Xuebao. 2012; 31(1):39-44.
Saracoglu R. Hidden Markov Model-based classification of heart valve disease with PCA for dimension reduction. Engineering Applications of Artificial Intelligence. 2012; 25(7):1523-8. http://dx.doi.org/10.1016/j.engappai.2012.07.005.
Ye XS, Feng K, Wang P. The research of diagnos is of coronary artery disease based on the application of Independent Component Analysis to heart sounds sensor
array. Chuangan Jishu Xuebao. 2003; 16(1):16-9.
Zang WY, Guo XM, Weng J. Application of improved GMM in classification and recognition of heart sound. Journal of
Vibration and Shock. 2014; 33(6):29-34.
Zhao ZD, Tang XH, Zao ZJ. Spectrum analysis of heart sound based on hilbert-huang transform. Chuangan Jishu Xuebao. 2005; 18(1):18-22.
Authors
Tianhua Chen1*, Lingzi Xiang1, Meina Zhang1
1School of Computer and Information Engineering, Beijing Technology and Business University, No.3 Shangyuancun,