DOI: http://dx.doi.org/10.1590/2446-4740.0643
*email: [email protected]
Received: 16 August 2014 / Accepted: 25 January 2015
A novel method for EMG decomposition based on matched ilters
Ailton Luiz Dias Siqueira Júnior*, Alcimar Barbosa Soares
Abstract Introduction: Decomposition of electromyography (EMG) signals into the constituent motor unit action potentials (MUAPs) can allow for deeper insights into the underlying processes associated with the neuromuscular system. The vast majority of the methods for EMG decomposition found in the literature depend on complex algorithms and speciic instrumentation. As an attempt to contribute to solving these issues, we propose a method based on a bank of matched ilters for the decomposition of EMG signals. Methods: Four main units comprise our method: a bank of matched ilters, a peak detector, a motor unit classiier and an overlapping resolution module. The system’s performance was evaluated with simulated and real EMG data. Classiication accuracy was measured by comparing the responses of the system with known data from the simulator and with the annotations of a human expert. Results: The results show that decomposition of non-overlapping MUAPs can be achieved with up to 99% accuracy for signals with up to 10 active motor units and a signal-to-noise ratio (SNR) of 10 dB. For overlapping MUAPs with up to 10 motor units per signal and a SNR of 20 dB, the technique allows for correct classiication of approximately 71% of the MUAPs. The method is capable of processing, decomposing and classifying a 50 ms window of data in less than 5 ms using a standard desktop computer. Conclusion: This article contributes to the ongoing research on EMG decomposition by describing a novel technique capable of delivering high rates of success by means of a fast algorithm, suggesting its possible use in future real-time embedded applications, such as myoelectric prostheses control and biofeedback systems. Keywords: EMG decomposition, MUAPs classiication, Matched ilters.
Introduction
An electromyographic (EMG) signal is a measure of the electrical manifestation of a muscle contraction and the result of the asynchronous summation of basic signals known as motor unit action potentials (MUAPs) (Parsaei and Stashuk, 2011; 2013).
The waveforms and rates of occurrence of MUAPs
allow for the identiication of motor disturbances
(Han et al., 2005; McGill and Marateb, 2011; Pino et al., 2008) and provide information on the underlying mechanisms of the neuromuscular control system (Barboi and Barkhaus, 2004). However, extensive processing is required to distinguish individual MUAPs from EMG signals. This process, known as “decomposition”, generally involves the following steps (Parsaei et al., 2010; Stashuk, 2001): (a) EMG data acquisition – usually by means of multiple electrodes; (b) pre-processing – to improve the signal-to-noise ratio and highlight MUAPs; (c) windowing – selection of the regions of EMG activity; (d) feature extraction – the EMG data are processed and transformed into numerical features, generally a multidimensional array; and (e) pattern recognition – detected MUAPs with similar features are separated into groups, representing the action
potentials of speciic motor units (MUs). The last
step assumes that MUAPs from the same MU would share a distinct signature that accounts for similarities in the extracted features.
To date, a number of methods for EMG decomposition have been described in the literature (Andrade et al., 2007; Christodoulou and Pattichis, 1995; De Luca et al., 2006; Sá et al., 2014; Fang et al., 1999; Florestal et al., 2006; Glaser et al., 2013; Lefever and De Luca, 1982; Mambrito and De Luca, 1984; Marateb et al., 2011; McGill and Marateb, 2011; McGill et al., 1985; Nawab et al., 2008; Rasheed et al., 2008; Ren et al., 2006; Stashuk; 2001; Xu et al., 2001; Winslow et al., 2009). Nevertheless, the vast majority of those methods are limited to
laboratory research and are usually based on speciic
instrumentation and complex algorithms that require large amounts of data to train the mathematical models (Glaser et al., 2013; Holobar et al., 2009). Additionally, traditional methods for EMG decomposition may take many hours or even days to process large sets of data, such as those obtained in the experiments reported by Kleine et al. (2012), Winslow et al. (2009), Zhou et al. (2011) and Zijdewind and Thomas (2012), that use up to 24 hours of multichannel EMG data to study different aspects of the neuromuscular process in paraplegic patients.
The increasing interest in the application of EMG signal decomposition in areas such as prosthesis control, human-machine interface and medical diagnosis is driving researchers to develop better and more accurate decomposition strategies, preferably ones capable of online processing without demanding complex instrumentation.
Matched ilters is a technique used in areas such
as radar and communication systems with great success (Lathi and Ding, 2009; Turin, 1960), relying on symbols (pulses) transmitted via noisy channels
that are detected and classiied in search of a message
in real time. Because this bears strong analogy to the detection of MUAPs in EMG signals, the authors hypothesize that this approach can also be used as a strategy to perform fast and reliable decomposition.
Furthermore, another feature of matched ilters may
also play an important role for real-world EMG decomposition: the capacity to maximize the output signal-to-noise ratio. This could prove particularly useful for real-world applications where high signal-to-noise ratios are not always achievable. Therefore, this technique may allow for the design of a method that rapidly decomposes EMG signals that does not rely upon complex instrumentation, such as multi-channel electrode arrays, paving the way for the use of MUAP-based control algorithms in devices such as myoelectric prostheses, where they still cannot be applied due to the extensive computing required by current EMG decomposition algorithms.
It is important to highlight that the expression
“matched ilter” has also been used in the literature to describe other speciic methods for EMG processing.
For instance, Studer et al. (1984) use the expression
“matched ilter” to describe a method used to adapt signal templates of a ilter bank to detect MUAPs
in EMG data. However, their technique is based on
Kalman ilters, which is considerably different from
what we proposed in this article. To the best of our
knowledge, this is the irst time matched ilters, as
described in this paper, are used for surface EMG decomposition.
Methods
EMGD-MF: a novel method for EMG
decomposition based on matched ilters
Our method for EMG decomposition can be expressed by four main units (Figure 1): (a) a bank
of matched ilters, (b) a peak detector, (c) a classiier
and (d) an overlapping resolution module. The input to the system is a single EMG channel that is
irst processed by a parallel bank of matched ilters
(Figure 1a), where each ilter is responsible for the detection of an individual MUAP. The outputs of the
ilters are then biased by a speciic value, depending on the features (templates) of each ilter, and their
maxima (peaks) are calculated (Figure 1b). At this stage a validation algorithm is also used to eliminate local maxima associated with noise and responses
to inputs too far from the ilter’s template. Finally, a classiier (Figure 1c) selects the output that best
represents the spike at the input of the bank of ilters.
To minimize errors caused by overlapping MUAPs,
the set of MUAPs detected by the classiier is sent to
a synthesizer to construct an EMG signal represented by the previously detected MUAPs, which is then subtracted from the raw EMG signal (Figure 1d).
A control block evaluates the energy of the residue and determines if it is to be sent to the input of the system, allowing for the detection of MUAPs that
were not identiied in the irst iteration.
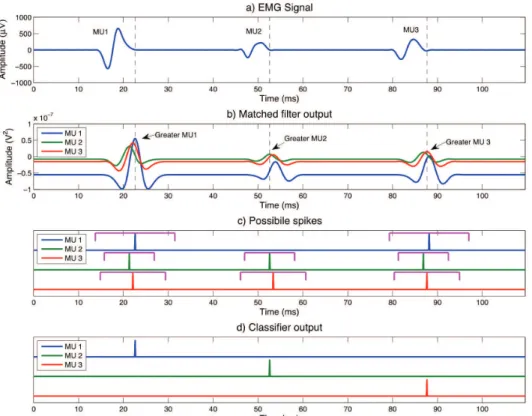
To illustrate the operation of the units, throughout this section, a synthetic EMG signal with three pseudo-MU spikes without overlapping, as shown in Figure 2a, will be used.
Bank of matched ilters
A matched ilter is the optimal linear ilter for
maximizing the output signal-to-noise ratio (SNR) of
a signal in the presence of stochastic noise. A ilter is
said to be matched to (template) if its impulse response is given by (Lathi and Ding, 2009; Turin, 1960):
( )= ⋅ (τ − )
h t k g t
(1)
where and are arbitrary constants (because k behaves like a gain applied to the template, it can be set to 1 for simplicity; similarly, can be set to the duration of ).
Therefore, if we use this ilter to detect the presence
of a known signal g(t) mixed with Gaussian noise n(t) in the input, its output would show values between two extremes: (a) minimum - if g(t) is not present (s(t) = n(t)) - and (b) maximum - if s(t)=g(t)+n(t).
Equation 2 shows a model for EMG signals proposed by De Luca et al. (2006):
( ) ( ) ( )
1 m
N j j
EMG t MUAPT t n t
=
=∑ +
(2)
where is the j-th MUAP train, is the number of active MUs and represents noise.
The trains of MUAPs can be modeled as:
( )
(
)
1
Mj
j jk jk
k
MUAPT t MUAP t
=
=∑ − δ
(3)
where corresponds to the train of MUAPs of the j-th MU, corresponds to the waveform of the k-th spike of the j-th MU, corresponds to the number of spikes generated by MUj and represents the time of each
spike. Because the waveforms of the various irings
of MUj are similar to each other, we can design a template that represents the mean waveform (template
for a ilter) and use it to identify the presence and the
time when the MUj ired, which are the key elements we are looking for.
As described earlier, an EMG signal is composed of various MUAP trains (MUAPTs). Therefore, a real-time decomposition system should be designed
as a bank of ilters working in parallel, in which each isolated ilter is designed for each MU present
Figure 2. The EMGD-MF processing a simulated signal with three MUs iring sequentially: (a) input signal; (b) output from the bank of ilters;
in the signal. This strategy was previously used in telecommunication to classify pulses in M-ary receivers. The overall process for M-ary receivers is described in Lathi and Ding (2009) and can be summarized as follows: (1) in the receiver, the input signal is applied
to a bank of matched ilters, where each ilter is designed to detect a speciic symbol, (2) the outputs
are biased by a distinct value (ai), (3) the outputs are sampled when they reach their maximum value (peak) and (4) the outputs are compared to estimate the symbol received, i.e., the template related to the
ilter with the highest output value. Steps 1, 3 and 4 are quite straightforward; however, we must deine
the bias to be applied to the output of each matched
ilter. This is an important element because every ilter will respond to every pulse, regardless if it is
its base pulse (g(t)) or not. Equation 4 deines the bias for a pulse i, where is a constant representing white noise, is the probability of the pulse (symbol)
associated with a ilter occurring in the signal, and
is the energy of the template used in the design of
the ilter (Lathi and Ding, 2009). ( )
0
1 ln 2
i i i
a = N P m −E
(4)
In the case where the probability of receiving a certain symbol is the same as that for all other pulses, is the same for all symbols and, therefore, can be removed from the equation when we are looking for differences among the outputs (as in the M-ary systems):
2
i i
E
a = −
(5)
The EMG signal is applied to the bank of matched
ilters (Figure 1a), and a bias value is added to the
outputs of each ilter, as deined in Equation 5. To
construct a ilter, one must irst model the pulse (g(t))
used to estimate the impulse response of the ilter.
As explained earlier, we can model g(t)j as a mean template waveform of the MUAPs associated with MUj. For simulated signals, for instance, g(t)j could be modeled as the average of all simulated spikes of a MUj, as described by Andrade et al. (2005). However, for real EMG signals, one must observe a certain amount of data before templates can be
modeled and used to it the ilters. Such a task may
be conducted by an expert in MUAP segmentation, who would manually mark and group the occurrences of all MUAPs, or by means of an automated tool, such as the ones described by Andrade et al. (2005), Parsaei and Stashuk (2011; 2013).
In this work, g(t)j was obtained as follows: a)
for simulated data, the waveform of the irst MUAP ired by the simulator for MUj was used as g(t)j; (b)
for the real surface EMG signal, the irst 5 seconds
of data were analyzed by a human expert, and g(t)j
was modeled as the average waveform of the MUAPs
ired by MUj.
Once the templates (g(t)j) are deined, the online
automated process can begin. Nevertheless, it is very
likely that the initial set of ilters does not contain a
representation for every possible MU in the signal and false-positives may occur. This is a trade-off for any EMG decomposition system described in the literature to date.
Figure 2b shows the response of a bank of
matched ilters designed to detect the MUAPs shown
in Figure 2a. Note that the outputs of the ilters are
biased and, for every spike, all ilters respond with
a peak slightly shifted in time due to differences in the MUAPs’ waveforms.
Peak detector
This stage (Figure 1b) is responsible for the detection
of maxima in the output of each ilter. To minimize
errors caused by high frequency oscillations, the
outputs of the ilters are irst smoothed by a 3rd order moving average ilter. Local maxima are computed
as described in Equation 6.
[ ]
{
(
[ ]1 [ ] 0)
( [ ]1 [ ] 0)}m i = fo i− −fo i < AND fo i+ −fo i <
(6)
where is a vector with the smoothed samples from
the output of the matched ilter and is the output
vector with as many elements as that have values equal to 0 or 1, where 1 indicates a local maximum at that position in .
The amplitudes of the detected peaks are then evaluated, and those showing negative values or values
lower than the bias level of the associated ilter are
rejected (Figure 2c). This process seeks to avoid local maxima associated with low amplitude peaks resulting from noise and low outputs associated with responses
to inputs too far from the ilter’s template symbol. Classiier
As shown in Figure 2c, whenever a MUAP is
presented at the input of the ilters, there is a high probability that more than one ilter will output a
non-zero response. To estimate the most probable MU
responsible for the correct output, the classiier applies
a validation algorithm to every possible spike found by the peak detectors. Candidate peaks are sequentially
tested, beginning with the irst candidate peak from the irst ilter. A region of analysis (shown as horizontal
bars above the peaks in Figure 2c) is deined around each detected peak (Di) with a width equal to twice
The peaks detected in the outputs of all ilters within
this region of analysis are compared with each other;
if the output from the ilter that originated Di has the highest amplitude, then Di is maintained for further testing; otherwise, it is discarded (indicating that another peak exists with a higher probability of being associated with the correct output). This
process is repeated for all spikes, and the inal result
is illustrated in Figure 2d.
Improving the resolution for overlapping peaks The response of the classiier for overlapping
MUAPs may vary from not detecting any MUAP to partial detection (Stashuk, 2001). In the case of partial detection, assuming that a residue obtained by the subtraction of the detected MUAP from the EMG signal contains information about the remaining overlapping MUAPs, we can increase the probability of detecting them by feeding the residue back into the system and repeating the process until its energy
reaches a pre-deined minimal value. This technique
is known as the “peel-off superposition resolution method” (Winslow et al., 2009). Next, we demonstrate how the technique is incorporated into our method.
Equation 7 describes a model for an EMG
signal window composed of overlapping MUAPs (De Luca et al., 2006; Parsaei et al., 2010; Stashuk, 2001), where denotes the waveform of the EMG
signal, is a iring of MUj, is the time ires, represents
the number of MUs that comprise the overlap, and denotes the noise.
(
)
( )1 m
N
Ov j j
j
EMG MUAP t n t
=
=∑ − τ +
(7)
Assuming that is the input to the bank of matched
ilters and the responses of ilter for a certain window of analysis (50 ms) are classiied as correct spikes,
we can reconstruct an EMG signal () based on those spikes (Figure 1d):
( )
Re 1
N
c i i i i
EMG h T t
=
=∑ − − τ
(8)
where N is the number of spikes detected by the simulator within the window of analysis, is the impulse response for the i-th detected spike, is the duration of the i-th spike and is the time it was detected.
By subtracting (8) from (7), we obtain the residue R(t): ( ) Ov Rec
R t =EMG −EMG
(9)
Assuming that waveforms of the ilter’s templates
carry strong similarities to the MUAPs in , the overlappings due to the MUAPs in would now be removed from the residue. Hence, by feeding R(t)
back into the system, we increase the probability that new MUAPs are detected.
A control block (Figure 1d) decides whether the original EMG signal or the residue will be sent to the
input of the system. In the irst iteration, the EMG
signal is the input, and then, the residue is fed back
into the ilters until a stopping condition is achieved.
Because we expect the residue’s energy to reduce as new MUAPs are detected, the process ends when its
energy does not show any signiicant change between
consecutive iterations or increases due to, for instance, a false positive.
Testing experiments
Experiments using simulated data
Simulated signals were chosen as the gold standard to evaluate the system’s performance. By controlling
the number of active MUs and their irings, it is
possible to achieve precise comparisons between the responses of the decomposition system and the actual data.
An EMG signal simulator, proposed by Andrade et al.
(2007) was used to generate the simulated EMG data. Instead of using synthetic MUAP waveforms, this simulator uses approximately 1000 real MUAP waveforms digitized at a rate of 10,040 Hz and clustered into 15 MUs. The simulator allows for
various conigurations, such as different numbers of active MUs, iring rates and signal-to-noise ratios.
In addition to the actual simulated EMG signal, the
simulator also returns the timing and identiication
of all MUAPs.
A set of 480 simulated EMG signals (30 seconds each) was generated and divided into twelve groups of 40 signals each: (GS1) - #MU = 3 to 5, SNR = 10 dB; (GS2) - #MU = 3 to 5, SNR = 20 dB; (GS3) - #MU = 6 to 8, SNR = 10 dB; (GS4) - #MU = 6 to 8, SNR = 20 dB; (GS5) - #MU = 9 to 10, SNR = 10 dB; and (GS6) - #MU = 9 to 10, SNR = 20 dB.
Signals in groups GS7 to GS12 were created similar
to GS1 to GS6, but we allow for random MUAP overlapping, whereas for GS1 to GS6, no overlapping was allowed. Note that a ‘minimum’ number and
a ‘maximum’ number of active MUs were deined
for each group. This tells the simulator to randomly select a set of MUs for the group and randomly use anything from the ‘minimum’ to ‘maximum’ of those MUs to generate each EMG signal. Additionally, in
groups GS7 to GS12, on average 42% of all observed
events (MU spikes) referred to overlappings of 2 to 8 MUs; the remaining 52% of the events referred to
Experiments with recorded data
EMG data from the public EMGLAB (http://emglab.net/) databank were used (Hogrel, 2014). One surface Laplacian electrode (5 mm inter-electrode distance) positioned over the brachial biceps was used to collect the chosen signal under low levels of isometric contraction. The signal was band-pass
iltered (10 Hz-1 kHz, 10th order Butterworth) and
sampled at 10 kHz for 120 seconds. The curator of
that database manually marked and classiied the spikes of the MUs. Four active MUs were identiied,
and the annotations (MUs and spikes) were marked on the waveform.
The template for each ilter (g(t)j) was modeled as the average of the MUAPs’ waveforms marked
by the expert for each MU during the irst 5 seconds of data, e.g., the irst 5 seconds of data were used to generate the template for each ilter and the remainder
was used for testing.
Performance indexes
The following indexes were used to evaluate the performance of the EMGD-MF system:
• Correct classiication rate:
100 Sig TP CC x N =
(10)
• Precision: 100 meth TP P x N =(11)
• False positive rate:
100 R Sig FP FP x N =
(12)
• False negative rate:
100 R Sig FN FN x N =
(13)
where TP is the number of spikes correctly detected by the EMGD-MF method (true positive = a correct
detection of a spike from a speciic MU), is the
number of spikes actually present in the signal, is the number of spikes detected by the method, FP is the number of false positives and FN is the number of false negatives.
A spike is considered valid if it coincides with the
actual iring of a MU and if it occurred at the same
time or within ±2.5 ms. This tolerance refers to one half of the typical duration of the fastest MUAPs found in skeletal muscles (Florestal et al., 2006).
Processing window
For both simulated and real EMG data, the signals were processed by the EMGD-MF system using 50 ms windows (rectangular) with 25 ms overlap. The length
of the processing window was set to be twice the duration of the slowest MUAPs found for skeletal muscles (Florestal et al., 2006). Window overlapping is important to avoid errors at the boundaries of the processing window, where MUAP waveforms might be cropped.
Results
Simulated data
All 480 simulated signals were decomposed by the system. To illustrate the process, Figure 3 shows a portion of a simulated signal with 5 active overlapping MUs and a SNR of 10 dB. A cross is drawn when the simulator generates a spike (MUAP), and a circle is drawn when it is detected by the method. Colors are used to represent different MUs. A cross drawn inside a circle of the same color indicates the precise detection of a MUAP. As shown, the method was capable of detecting the majority of the spikes within
the analysis window, failing only to detect the irst
“wave” composed of overlapping MUAPs from MUs 1 and 5, resulting in a false detection of a spike from MU 2 (most likely because those two MUAPs have
very similar shapes and both MUs ired almost exactly
at the same time, resulting in a waveform very similar to MUAPs from MU 2).
Table 1 shows the mean and standard deviation of each evaluation index calculated for the simulated signals with and without overlapping MUAPs. When overlapping did not occur, the method correctly
classiied 97.32% to 99.55% of the MUAPs found in
signals with up to 10 active MUs in the presence of high levels of noise. When decomposing simulated EMG signals with overlapping MUAPs, the method
correctly classiied more than 90% of those spikes for
up to 5 MUs in situations with considerable noise; however, as expected, the performance deteriorates with increases in the number of active MUs and noise intensity.
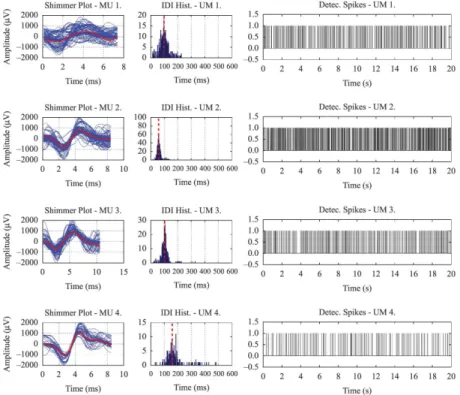
Figure 4 shows the results of the decomposition of 30 seconds of a simulated signal with 4 active MUs and random overlapping. The shimmer plots of the MUAPs’ waveforms and the average waveform for each MU are shown on the left. The histograms for the spikes of those MUs are shown in the center, and
the MUAP trains for the irst 20 seconds of data are
shown on the right. As expected, the histograms for the inter-discharge intervals (IDIs) of the 4 MUs have an approximately Gaussian shape (De Luca and Hostage, 2010). The mean iring rate for each MU, calculated as the maximum of its IDI density function (Kernel Density Estimation), shows good agreement with the actual rate calculated from the simulated signals, displayed as a vertical dotted red line over the histogram (mean errors
Real surface EMG data
Figure 5 illustrates the response of the EMGD-MF system when decomposing a small sample of a real surface EMG signal. The events (MUAPs) annotated by the specialist are shown as crosses, and those
detected by the EMGD-MF are shown as circles. Visual inspection shows acceptable agreement between the systems’ output and the specialist’s annotations for MUs 1 (blue), 2 (red) and 3 (green). Divergences can be found with regard to MU 4 (black). A closer inspection
Figure 3. The EMGD-MF processing a simulated EMG signal with 5 active overlapping MUs and a SNR of 10 dB. The actual spikes are marked with a cross, and those detected are represented as circles.
Table 1. Mean and standard deviation of the evaluation indexes for the response of the EMGD-MF system when decomposing 480 simulated signals with and without MUAP overlap and different noise levels.
MUs SNR Without MUAP Overlap (%) With MUAP Overlap (%)
CC P FPR FNR CC P FPR FNR
3-5 20 99.55 (0.58) 99.10 (3.80) 1.08 (4.67) 0.45 (0.58) 92.78 (5.21) 95.10 (8.22) 5.64 (11.73) 7.22 (5.21) 3-5 10 99.15 (1.57) 97.00 (11.66) 6.39 (29.66) 0.85 (1.57) 90.13 (8.29) 91.75 (12.57) 11.65 (33.48) 9.91 (8.28) 6-8 20 99.43 (0.51) 99.39 (3.93) 0.84 (5.72) 0.57 (0.51) 80.57 (9.30) 86.99 (10.65) 13.17 (13.99) 19.44 (9.28) 6-8 10 97.32 (5.87) 94.13 (14.18) 11.39 (36.94) 2.68 (5.85) 74.37 (12.86) 79.34 (16.44) 26.61 (52.54) 25.66 (12.84) 9-10 20 99.17 (0.73) 99.71 (10.75) 5.58 (20.58) 0.83 (0.73) 70.74 (11.62) 80.73 (12.35) 18.32 (15.38) 29.27 (11.63)
shows that the spikes of MU 4 have low energy and their amplitudes are very close to the base line noise, leading to this poorer performance.
The same indexes used for simulated signals were also used to verify the agreement between the responses of the method and the annotations of the human expert. The results (mean (standard deviation))
show the following: (i) correct classiication rate: 76.73% (9.90); (ii) precision: 77.60% (18.04); (iii) false
positive rate: 26.4% (28.2); and (iv) false negative
rate: 23.27% (9.90).
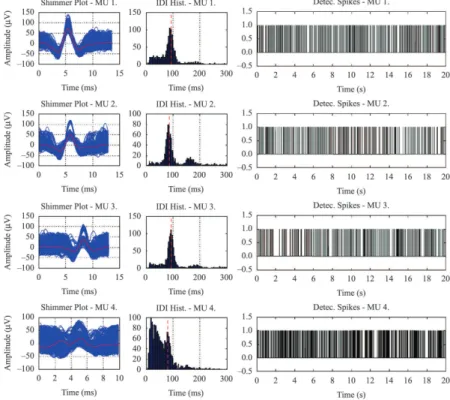
Figure 6 shows the results of the EMG decomposition provided by the EMGD-MF system for the whole data
set (120 seconds). The shimmer plots (with the MUAPs and the average waveform) for each MU are shown on the left. Although the results may also be biased by possible errors made by the expert when marking the MUAPs, the histograms of the IDIs for MUs 1, 2 and 3 follow the expected Gaussian distribution.
The mean iring rate for those MUs, calculated as
the maximum of their IDI density functions (Kernel Density Estimation), show mean errors between
0.73% and 1.32% when these rates are compared to
those found by the human expert (vertical red line on the histograms). However, the histogram for MU 4 is not consistent with a Gaussian distribution, most
Figure 5. A sample of a real EMG signal and the annotations of MUAPs made by an expert (crosses) versus the results obtained by the EMGD-MF system (circles).
likely due to the low amplitude of its MUAPs being close to the noise level of the signal.
The model was implemented in Matlab® (The MathWorks Inc, Natick, Massachusetts, USA) on a desktop computer (Intel® i5 2.3 GHz Processer, 8 GbGB RAM). On average, 50 ms windows were processed under 5 ms.
Discussion
Our results demonstrate that the EMGD-MF method can provide a viable alternative to decompose EMG signals with high accuracy. On average, the method
achieved rates of success greater than 97% when
no overlapping was present in simulated signals.
Correct classiication of up to 92.78% was achieved
for simulated signals with up to 5 overlapping MUs and a 20 dB SNR. When processing a real surface
EMG signal, the method matches 76.73% of the
annotations of a human expert. The histograms of the
MUs’ iring rates show the expected Gaussian behavior. However, the method has shown some dificulties
with low energy MUAPs close to the base noise level. Previous studies have also reported such problems (Parsaei and Stashuk, 2011; Florestal et al., 2009), and a viable solution should rely upon pre-processing techniques to improve the SNR (Andrade et al., 2006;
2007; Sá et al., 2014).
Similar to other strategies for EMG decomposition described in the literature (Florestal et al., 2009; Glaser et al., 2013; Parsaei and Stashuk, 2011; Studer et al., 1984; Winslow et al., 2009), our method also requires previous knowledge of the MUAPs’
waveforms to generate a template for each ilter.
Additionally, at this point, the algorithm is not yet capable of identifying MUAPs different than those previously known. Therefore, this version of the system must be used in cases where the level of muscle contraction remains constant or decreases over time. Note that this is also the case for other works described in the literature (Glaser et al., 2013; Parsaei and Stashuk, 2011). The authors are currently
working on strategies to deine new ilters dynamically
as new MUs are recruited during the contraction. The initial approach is based on an EMG segmentation algorithm that runs in parallel with EMGD-MF. The segments and the outputs of the system are continuously monitored to detect segments with features that are too far from the existing templates. Whenever that is
the case, a new ilter is programmed with a template
for that segment and added to the bank. In doing so, the EMGD-MF has the potential to start operation as “empty”, being constructed as the signal is processed. A potential impact of this method could be on the
maximum speed of execution – as the number of
ilters increases, the overall computational cost should
also increase. Nevertheless, the authors believe that future hardware based on parallel processors (already common in the market) can minimize this effect. This technique is currently under investigation and will be the subject of a future publication.
Because the methods found in the literature for EMG decomposition are considerably different
from each other, most of them requiring speciic
hardware and different techniques for data acquisition
(multichannel/array electrode conigurations, etc.),
direct comparisons are not always possible and could be prone to questioning. However, as we show next, a general comparison based on results obtained when similar data are used (same SNR and same number of active MUs) shows that the performance of the EMGD-MF algorithm matches those of current methods described in the literature.
A number of methods for EMG decomposition have been proposed over the past decade. Although some have shown impressive performance during controlled experiments, there are important limitations that need to be addressed. For instance, Florestal et al. (2009) proposed a method for EMG decomposition
that can correctly classify 75% of the MUAPs
present in EMG signals with up to 95% accuracy. However, when all MUs (12 in this case) are taken into account, the rates of success vary from 53% to 100%. Furthermore, their best results were found when processing data collected by matrices of electrodes. Recently, Glaser et al. (2013) proposed a system for online MUAP decomposition that uses a preliminary training stage for which a packet of at least 3 seconds of EMG data is required. This method achieves correct
classiication rates of up to 99% for signals with SNRs
of 20 dB, but for contractions of low intensity and with only 5 active MUs. Furthermore, these results were obtained from signals collected by two grids of monopolar electrodes, each containing 6×5 electrodes. However, the EMGD-MF algorithm can decompose EMG signals from single channels and achieve high rates of success in similar condition (similar SNR, number of active MUAPs and overlapping). It should also be noted that, similar to our method, the system proposed by Florestal et al. (2009) is not able to detect spikes of MUs that did not appear during the
irst 3 seconds of training.
computation, in favor of a classiier that uses digital ilters at its core. In doing so, the architecture of the
EMGD-MF system enables the use of a number of computing optimization techniques existing in current digital signal processing systems (DSPs), such as concurrent and parallel processing, which can boost the performance as required. Our experiments were executed in Matlab® on a standard desktop computer, and on average, a 50 ms window was processed in under 5 ms.
Current strategies for myoelectric control of prosthetic devices (Masters et al., 2014; Simon et al., 2011) having average delays of up to 100 ms are considered acceptable for the response time between the user’s control (muscle contractions sampled at 25 ms-50 ms windows) and the prosthesis activation.
Nevertheless, researchers in the ield still face the
challenge of choosing the best set of features to be used to achieve dexterous control of advanced prosthetic devices (Masters et al., 2014). The use of traditional features such as waveform envelop, means and zero crossing is limited and cannot extract a great deal of information from within the EMG signal. The authors believe that strategies based on detailed information, such as the motor unit recruitment ratio, may allow for more sophisticated control. However, to be deployed as a viable method, the algorithms for EMG decomposition should be able to run on limited resources (embedded microprocessors/DSPs) and deliver fast response times. Because the EMGD-MF algorithm requires only 5 ms to process a 50 ms window (even on a non-optimized system – standard desktop computer running Matlab®) and encapsulates features that allow for its implementation on standard DSP systems, the authors believe that it has great potential to be applied in future myoelectric control systems based on MUAP activation.
When considering the ability of the EMGD-MF to
predict the mean iring rate of different MUAPs, the
results show that the system is capable of delivering good estimates, with mean errors below 3.28%. The
mean iring rate of MUs is one of the most important
results an EMG decomposition system can output because this information allows for clinical use of the technique and is related to the integrity of both
the muscle ibers and the neuromotor recruitment
pattern (Stashuk, 2001).
As shown, this article contributes to studies on EMG decomposition by describing a novel technique capable of achieving high rates of success under high levels of noise. A limitation of the method is the possibility of false positives due to the presence of MUAPs that are not related to those programmed
into the bank of matched ilters. A possible solution
would require the use of supervised methods in which
the response of the classiier is constantly evaluated based on past history and a new ilter is dynamically
programmed whenever necessary. This work is in progress and will be the subject of future publication.
Acknowledgements
The authors would like to thank FAPEMIG-MG-Brazil,
CNPq-Brazil and CAPES-Brazil for inancial support.
References
Andrade A, Nasuto S, Kyberd P, Sweeney-Reed C, Van Kanijn F. EMG signal filtering based on Empirical Mode Decomposition. Biomedical Signal Processing and Control. 2006; 1(1):44-55. http://dx.doi.org/10.1016/j.bspc.2006.03.003.
Andrade A, Nasuto S, Kyberd P. An automatic system for clustering and visualization of motor unit action potentials based on generative topographic mapping. 3rd IEE International Seminar on Medical Applications of Signal Processing (Ref No 2005-1119). 2005 Nov 3-4. IET; 2005. 125-30.
Andrade AO, Nasuto SJ, Kyberd P. Extraction of motor unit action potentials from electromyographic signals through generative topographic mapping. Journal of the Franklin Institute. 2007; 344(3-4):154-79. http://dx.doi.org/10.1016/j. jfranklin.2006.10.006.
Barboi AC, Barkhaus PE. Electrodiagnostic testing in neuromuscular disorders. Neurologic Clinics. 2004; 22(3):619-41, vi. http://dx.doi.org/10.1016/j.ncl.2004.03.007. PMid:15207878
Christodoulou C, Pattichis C. A new technique for the classification and decomposition of EMG signals. Proceedings of the IEEE International Conference on Neural Networks. 1995 Nov/Dec; Perth. IEEE; 1995; 5. p. 2303-5.
De Luca CJ, Adam A, Wotiz R, Gilmore LD, Nawab SH. Decomposition of surface EMG signals. Journal of Neurophysiology. 2006; 96(3):1646-57. http://dx.doi. org/10.1152/jn.00009.2006. PMid:16899649
De Luca CJ, Hostage EC. Relationship between firing rate and recruitment threshold of motoneurons in voluntary isometric contractions. Journal of Neurophysiology. 2010; 104(2):1034-46. http://dx.doi.org/10.1152/jn.01018.2009. PMid:20554838
Fang J, Agarwal GC, Shahani BT. Decomposition of multiunit electromyographic signals. IEEE Transactions on Bio-Medical Engineering. 1999; 46(6):685-97. http:// dx.doi.org/10.1109/10.764945. PMid:10356875
Florestal JR, Mathieu PA, Malanda A. Automated decomposition of intramuscular electromyographic signals. IEEE Transactions on Bio-Medical Engineering. 2006; 53(5):832-9. http://dx.doi.org/10.1109/TBME.2005.863893. PMid:16686405
journal of the International Society of Electrophysiological Kinesiology. 2009; 19(1):1-9. http://dx.doi.org/10.1016/j. jelekin.2007.04.001. PMid:17513128
Glaser V, Holobar A, Zazula D. Real-time motor unit identification from high-density surface EMG. IEEE transactions on neural systems and rehabilitation engineering : a publication of the IEEE Engineering in Medicine and Biology Society. 2013; 21(6):949-58. http://dx.doi.org/10.1109/ TNSRE.2013.2247631. PMid:23475379
Han JJ, Carter GT, Weiss MD, Shekar C, Kornegay JN. Using electromyography to assess function in humans and animal models of muscular dystrophy. Physical Medicine and Rehabilitation Clinics of North America. 2005; 16(4):981-97, x. http://dx.doi.org/10.1016/j.pmr.2005.08.001. PMid:16214055
Hogrel JY. EMGLAB: A forum for sharing software, data, and information related to EMG decomposition. Online dataset R011. 2014. [cited: 30 july 2014]. Available at: http://www.emglab.net.
Holobar A, Farina D, Gazzoni M, Merletti R, Zazula D. Estimating motor unit discharge patterns from high-density surface electromyogram. Clinical neurophysiology : official journal of the International Federation of Clinical Neurophysiology. 2009; 120(3):551-62. http://dx.doi. org/10.1016/j.clinph.2008.10.160. PMid:19208498
Kleine BU, Boekestein WA, Arts IM, Zwarts MJ, Schelhaas HJ, Stegeman DF. Fasciculations and their F-response revisited: high-density surface EMG in ALS and benign fasciculations. Clinical neurophysiology : official journal of the International Federation of Clinical Neurophysiology. 2012; 123(2):399-405. http://dx.doi.org/10.1016/j. clinph.2011.06.032. PMid:21820354
Lathi BP, Ding Z. Modern digital and analog communication systems. 4th ed. New York: Oxford University Press USA; 2009.
LeFever RS, De Luca CJ. A procedure for decomposing the myoelectric signal into its constituent action potentials — Part I: technique, theory, and implementation. IEEE Transactions on Bio-Medical Engineering. 1982; 29(3):149-57. http:// dx.doi.org/10.1109/TBME.1982.324881. PMid:7084948
Mambrito B, De Luca CJ. A technique for the detection, decomposition and analysis of the EMG signal. Electroencephalography and Clinical Neurophysiology. 1984; 58(2):175-88. http://dx.doi.org/10.1016/0013-4694(84)90031-2. PMid:6204844
Marateb HR, Muceli S, McGill KC, Merletti R, Farina D. Robust decomposition of single-channel intramuscular EMG signals at low force levels. Journal of Neural Engineering. 2011; 8(6):066015. http://dx.doi.org/10.1088/1741-2560/8/6/066015. PMid:22063475
Masters MR, Smith RJ, Soares AB, Thakor NV. Towards better understanding and reducing the effect of limb position on myoelectric upper-limb prostheses. EMBC 2014: Proceedings of the 36th Annual International Conference of the IEEE Engineering in Medicine and Biology Society; 2014 Aug 26-30; Chicago. 2014. p. 2577-80.
McGill KC, Cummins KL, Dorfman LJ. Automatic decomposition of the clinical electromyogram. IEEE Transactions on Bio-Medical Engineering. 1985; 32(7):470-7. http://dx.doi.org/10.1109/TBME.1985.325562. PMid:3839488
McGill KC, Marateb HR. Rigorous a posteriori assessment of accuracy in EMG decomposition. IEEE transactions on neural systems and rehabilitation engineering : a publication of the IEEE Engineering in Medicine and Biology Society. 2011; 19(1):54-63. http://dx.doi.org/10.1109/TNSRE.2010.2056390. PMid:20639182
Nawab SH, Wotiz RP, De Luca CJ. Decomposition of indwelling EMG signals. Journal of Applied Physiology. 2008; 105(2):700-10. http://dx.doi.org/10.1152/ japplphysiol.00170.2007. PMid:18483170
Parsaei H, Stashuk DW, Rasheed S, Farkas C, Hamilton-Wright A. Intramuscular EMG signal decomposition. Critical Reviews in Biomedical Engineering. 2010; 38(5):435-65. http://dx.doi.org/10.1615/CritRevBiomedEng.v38.i5.20. PMid:21175408
Parsaei H, Stashuk DW. Adaptive motor unit potential train validation using MUP shape information. Medical Engineering & Physics 2011; 33(5):581-9. http://dx.doi. org/10.1016/j.medengphy.2010.12.012. PMid:21269867
Parsaei H, Stashuk DW. EMG signal decomposition using motor unit potential train validity. IEEE transactions on neural systems and rehabilitation engineering : a publication of the IEEE Engineering in Medicine and Biology Society. 2013; 21(2):265-74. http://dx.doi.org/10.1109/TNSRE.2012.2218287. PMid:23033332
Pino LJ, Stashuk DW, Boe SG, Doherty TJ. Motor unit potential characterization using “pattern discovery”. Medical Engineering & Physics. 2008; 30(5):563-73. http://dx.doi. org/10.1016/j.medengphy.2007.06.005. PMid:17697793 Rasheed S, Stashuk D, Kamel M. A software package for interactive motor unit potential classification using fuzzy k-NN classifier. Computer Methods and Programs in Biomedicine. 2008; 89(1):56-71. http://dx.doi.org/10.1016/j. cmpb.2007.10.006. PMid:18054118
Ren X, Hu X, Wang Z, Yan Z. MUAP extraction and classification based on wavelet transform and ICA for EMG decomposition. Medical & Biological Engineering & Computing. 2006; 44(5):371-82. http://dx.doi.org/10.1007/ s11517-006-0051-3. PMid:16937179
Sá AAR, Soares AB, Andrade AO, Nasuto S. Decomposition of surface electromyographic signal using Hidden Markov Model. Journal of Health Science. 2014; 2:28-40.
Simon AM, Hargrove LJ, Lock BA, Kuiken TA. Target Achievement Control Test: evaluating real-time myoelectric pattern-recognition control of multifunctional upper-limb prostheses. Journal of Rehabilitation Research and Development. 2011; 48(6):619-27. http://dx.doi.org/10.1682/ JRRD.2010.08.0149. PMid:21938650
11(3):151-73. http://dx.doi.org/10.1016/S1050-6411(00)00050-X. PMid:11335147
Studer RM, de Figueiredo RJP, Moschytz GS. An algorithm for sequential signal estimation and system identification for EMG signals. IEEE Transactions on Bio-Medical Engineering. 1984; 31(3):285-95. http://dx.doi.org/10.1109/ TBME.1984.325267. PMid:6546925
Turin G. An introduction to matched filters. I.R.E. Transactions on Information Theory. 1960; 6(3):311-29. http://dx.doi. org/10.1109/TIT.1960.1057571.
Winslow J, Dididze M, Thomas CK. Automatic classification of motor unit potentials in surface EMG recorded from thenar muscles paralyzed by spinal cord injury. Journal of
Neuroscience Methods. 2009; 185(1):165-77. http://dx.doi. org/10.1016/j.jneumeth.2009.09.012. PMid:19761794
Xu Z, Xiao S, Chi Z. ART2 neural network for surface EMG decomposition. Neural Computing & Applications. 2001; 10(1):29-38. http://dx.doi.org/10.1007/s005210170015.
Zhou P, Barkhaus PE, Zhang X, Rymer WZ. Characterizing the complexity of spontaneous motor unit patterns of amyotrophic lateral sclerosis using approximate entropy. Journal of Neural Engineering. 2011; 8(6):066010. http:// dx.doi.org/10.1088/1741-2560/8/6/066010. PMid:22049095 Zijdewind I, Thomas CK. Firing patterns of spontaneously active motor units in spinal cord-injured subjects. The Journal of Physiology. 2012; 590(Pt 7):1683-97. http:// dx.doi.org/10.1113/jphysiol.2011.220103. PMid:22310313
Authors
Ailton Luiz Dias Siqueira Júnior1,2*, Alcimar Barbosa Soares1
1Faculty of Electrical Engineering, Federal University of Uberlândia – UFU, Campus Santa Mônica, Bloco 1E, CEP
38400-902, Uberlândia, MG, Brazil.