Journal of Aerospace Technology and Management V. 2, n. 1, Jan. – Apr. 2010 59
Adriana Medeiros Gama* Institute of Aeronautics and Space São José dos Campos – Brazil [email protected]
Mirabel Cerqueira Rezende Institute of Aeronautics and Space São José dos Campos – Brazil [email protected]
*Author for correspondence
Complex permeability and
permittivity variation of carbonyl
iron rubber in the frequency range
of 2 to 18 GHz
Abstract: The complex dielectric permittivity (e) and magnetic permeability
(μ) of Radar Absorbing Materials (RAM) based on metallic magnetic
particles (carbonyl iron particles) embedded in a dielectric matrix (silicon rubber) have been studied in the frequency range of 2 to 18 GHz. The relative permeability and permittivity of carbonyl iron-silicon composites for various mass fractions are measured by the transmission/relection method using a vector network analyzer. The concentration dependence of permittivity and permeability on the frequency is analyzed. In a general way, the results show that e´ parameter shows a more signiicant variation
among the evaluated parameters (e”, μ”, μ’). The comparison of dielectric
and magnetic loss tangents (e”/e” and μ”/μ’, respectively) shows more
clearly the variation of both parameters (e and μ) according to the
frequency. It is also observed that higher carbonyl iron content fractions favor both dielectric and magnetic loss tangents.
Keywords: Carbonyl iron, Silicon, Permeability, Permittivity, Radar Absorbing Materials (RAM).
INTRODUCTION
Magnetic granular composites consisting of metallic magnetic particles embedded in a dielectric matrix have been widely used in electromagnetic applications such as electromagnetic wave absorber (also named Radar Absorbing Material, RAM) and electromagnetic shielding materials (Park, Choi and Kim, 2000). With the fast advancement of wireless communication and defense industry, radar absorbing materials are becoming more and more important in both civil and military applications, respectively (Liu et al., 2003; Feng, Qiu and Shen, 2007; Yusoff et al., 2002).
In general, RAM can be divided into two types: dielectric and magnetic ones. For single-layer microwave absorbers that have mainly magnetic losses in comparison to those that have mainly dielectric losses, broader bandwidth and higher absorption at smaller layer thickness can be achieved (Giannakopouou, Kontogeorgakos and Kordas, 2003). In this way, it can be cited carbonyl iron as a typical magnetic particle used in the magnetic RAM processing, attending the microwave frequency range. This magnetic iller type presents as main characteristics high Curie temperature (~1000K), good thermal stability, that allows its application at higher temperatures and high speciic saturation magnetization intensity (4pMs) (Deng et al.,
1999). Thus, this magnetic particle has been widely used in the electromagnetic shielding and in RAM processing (Liu et al., 2003; Yong, Afsat and Grignon, 2003).
This paper shows a study involving the evaluation complex magnetic permeability (μ = μ’ - jμ’’) and dielectric
permittivity (e = e’ - je’’) behaviors of an elastomeric
RAM processed with different carbonyl iron contents, in the frequency range of 2 to 18 GHz.
EXPERIMENTAL
Carbonyl iron powder was chosen as absorbing iller and silicon rubber was used as polymeric matrix. Both components are commercially available. The densities of the employed carbonyl iron and silicon matrix are 7.8 and 1.28 g/cm3, respectively. The carbonyl iron contents into
the processed elastomeric RAM were 30, 35, 40, 45, 50, 55, 60, 65 and 70% in mass concentration. The elastomeric RAM were prepared by conventional mechanical mixture of the two raw materials. The homogeneous mixtures were molded in a coaxial die with inner diameter of 3 mm and outer diameter of 7 mm. The polymer curing was performed at room temperature for about 24 hours. At the end, lexible cylindrical composite specimens were produced.
The S parameters (scattering parameters) were measured and used to calculate the complex magnetic permeability Received: 29/09/09
Accepted: 13/11/09
Journal of Aerospace Technology and Management V. 2, n. 1, Jan. – Apr. 2010
60
Gama, A.M., Rezende, M.C. and dielectric permittivity of all the prepared RAM
samples. The measurements were performed according to the transmission/relection method using an HP 8510C vector network analyzer, adapted with an APC7 coaxial transmission line, in the frequency range of 2 to 18 GHz. Figure 1 shows a schematic representation of the measurement system utilized.
Figure 1: Representation of the transmission/relection line Source: Bartley (2006).
The Nicolson-Ross modeling was applied in μ and e
calculations (Bartley and Begley, 2006).
RESULTS AND DISCUSSION
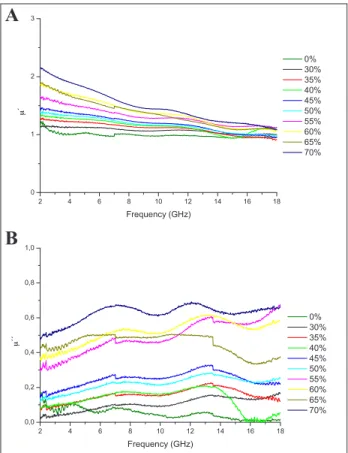
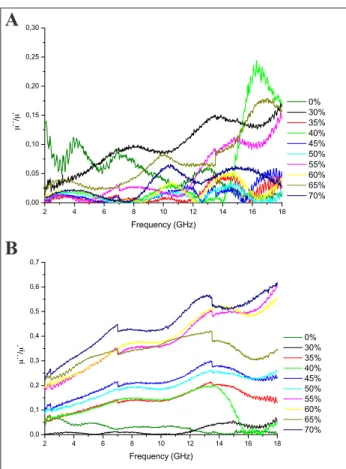
The real (storage) and imaginary (loss) permeability (μ’ and μ’’) and dielectric permittivity (e´ and e´´) behaviors are shown in Figures 2 and 3, respectively. Figure 4 shows the dielectric (tan de = e’’/e’) and magnetic (tan dm =
μ’’/μ’) loss tangents.
Figures 2 and 3 show that μ’ and e’ components for the pure silicon rubber (0% mass concentration) present the lowest values. With the increase of the frequency, μ’ values approach to 1.0 and e´ varies around 2.6. The imaginary components (μ” and e”) also present the lowest values for these parameters (from 0.0 to –1.2 and from 0.0 to 0.7, respectively). In the same way, the loss tangents present the lowest values. These behaviors mean that the pure silicon matrix presents low magnetic and dielectric losses.
´
2 4 6 8 10 12 14 16 18 0
2 4 6 8
e
Frequency (GHz)
0% 30% 35% 40% 45% 50% 55% 60% 65% 70%
2 4 6 8 10 12 14 16 18 0,0
0,3 0,6 0,9 1,2 1,5
e
´´
Frequency (GHz)
0% 30% 35% 40% 45% 50% 55% 60% 65% 70%
Figure 2: (a) Real and (b) imaginary dielectric permittivity of RAM (30 to 70% mass concentration) studied.
A
B
2 4 6 8 10 12 14 16 18 0
1 2 3
μ
´
Frequency (GHz)
0% 30% 35% 40% 45% 50% 55% 60% 65% 70%
2 4 6 8 10 12 14 16 18 0,0
0,2 0,4 0,6 0,8 1,0
μ
´´
Frequency (GHz)
0% 30% 35% 40% 45% 50% 55% 60% 65% 70%
A
B
Journal of Aerospace Technology and Management V. 2, n. 1, Jan. – Apr. 2010 61 Complex permeability and permittivity variation of carbonyl iron rubber in the frequency range of 2 to 18 GHz
Figure 3a shows that the real permeability (μ’) values present a slight increase with the magnetic iller concentration increase into the RAM sample. For example, at 2 GHz, μ’ is equal to 1.2 and 2.2 for the samples with 30 and 70% of carbonyl iron, respectively. On the other hand, this magnetic parameter decreases gradually until nearly 1.0, as the frequency increases. This observation is expected considering the typical behavior of magnetic materials with the frequency increase. It is known that this property decreases with the frequency increase due to the decreasing of both effects domain-wall motion and relaxation effects (Gama, 2009). Similar behavior is reported in the literature (Feng et al., 2006).
In general, the imaginary permeability (μ’’) (Fig. 3b) presents a behavior similar to that observed for μ’ (Fig. 3a). In this case, the increase of the imaginary parameter with the increase of magnetic iller concentration is also veriied. However, considering the frequency increase, this parameter presents a behavior distinct from that observed for μ’. In this case, μ’’ generally shows a slight increase until 14 GHz and, afterwards, this property decreases.
Comparing Figures 2 and 3, it is observed that the real permittivity (e’) presents a more accentuated increase with the carbonyl iron concentration increase in relation
to that observed for μ’. Moreover, for a same mass fraction, the e’ parameter keeps almost constant with the frequency variation. The e’ variation with the carbonyl iron mass fraction is attributed to the polarization of the dielectric dipoles of the iller in the RAM. In this case, it is considered that the dipoles are in-phase with the oscillation of the electrical ield vector of the electromagnetic wave. On the other hand, the dielectric losses (e”) show an increase with both iller concentration and frequency. This behavior is more accentuated for the mass fractions above 55% and suggests that the loss processes during the dipole oscillation, under the electromagnetic wave inluence, is more signiicant for higher frequencies, in accordance with Feng et al. (2006).
The magnetic loss tangent (μ’’/μ’) plots (Fig. 4b) show a slight increase concomitant to the frequency increase that is attributed to spin inversion losses (Feng et al., 2006).
The dielectric loss tangent (e’’/e’) curves (Fig. 4a) present a conclusive behavior only for the more concentrated samples (65 and 70%) that show an increase of this parameter concomitant to the frequency increase. Less concentrated samples present, in a general way, values in the range of 0.00 and 0.05.
Nelson (2005) reported that the dielectric losses present different loss mechanisms with the increase of frequency. When the frequency is relatively low (below GHz), the losses are determined mainly by the conductance and are independent of the frequency. Conversely, in frequencies in the microwave range, the losses involve two loss mechanisms: polarization relaxation and electrical conductance (Gama, 2009; Nelson, 2005). Thus, the two dielectric loss peaks at about 10.0 and 15.0 GHz (Fig. 4a) can be attributed to these two loss mechanisms.
CONCLUSIONS
The results of this study involving the electromagnetic properties of radar absorbing materials based on carbonyl iron/rubber show the dependence of both complex magnetic permeability (μ) and dielectric permittivity (e) parameters on the frequency, in the range of 2 to 18 GHz. Firstly, the complexity involving the behavior of these parameters in the microwave frequency range is observed . It is also observed that e’ parameter shows the most signiicant variation among the evaluated parameters (e”, μ”, μ’), with the carbonyl iron concentration. The comparison of dielectric and magnetic loss tangents (e”/e’ and μ”/μ’, respectively) shows more clearly the variation of both parameters (e and μ) with the frequency. It is also observed that higher carbonyl iron content fractions favor both dielectric and magnetic loss tangents. Finally, based on the literature data, it is possible to suggest that the dielectric Figure 4: (a) Dielectric and (b) magnetic loss tangents of the
RAM (30 to 70% mass concentration) studied.
2 4 6 8 10 12 14 16 18 0,00
0,05 0,10 0,15 0,20 0,25 0,30
μ
´´
/μ
´
Frequency (GHz)
0% 30% 35% 40% 45% 50% 55% 60% 65% 70%
2 4 6 8 10 12 14 16 18 0,0
0,1 0,2 0,3 0,4 0,5 0,6 0,7
μ
´´
/
μ
´
Frequency (GHz)
0% 30% 35% 40% 45% 50% 55% 60% 65% 70%
A
Journal of Aerospace Technology and Management V. 2, n. 1, Jan. – Apr. 2010
62
Gama, A.M., Rezende, M.C. loss mechanisms for the RAM, in the microwave range,
involve polarization relaxation, electrical conductance and spin inversion for magnetic losses.
ACKNOWLEDGEMENTS
The authors acknowledge the inancial assistance of Financiadora de Estudos e Projetos (FINEP) (Process number 1757-6) and the National Council for Research and Development (CNPq) (Process number 305478/09-5).
REFERENCES
Bartley, P.; Begley, S., 2006, “Materials measurement”, Available at: <http://www.die.uniroma1.it/personale/ frezza/biblioteca/dispense/MisureMateriali.pdf>.
Deng, L.J., et al., 1999, “The development and application of magnetic materials in the ield of RAM”, J Funct Mater, Vol. 30, No. 2, pp. 118-121.
Feng, Y.B., et al., 2006, “Electromagnetic and absorption properties of carbonyl iron/rubber radar absorbing materials”, IEEE Transactions on Magnetics, Vol. 42, No.3, pp. 363-368.
Feng, Y.B.; Qiu, T.; Shen, C.Y., 2007, “Absorbing properties and structural design of microwave absorbers based on carbonyl iron and barium ferrite”, Journal of Magnetism and Magnetic Materials, Vol. 318, No. 1-2, pp. 8-13.
Gama, A.M., 2009, “Comportamento da permissividade e permeabilidade complexas, de 2 a 18 GHz, de absorvedores de micro-ondas à base de ferro carbonila e ferrita de MnZn”, Tese de doutorado, ITA.
Giannakopouou, T.; Kontogeorgakos, A.; Kordas, G., 2003, “Single-layer Microwave absorbers: inluence of dielectric and magnetic losses on the layer thickness”, J Magn Mater, Vol. 263, pp. 173.
Liu, A.X., et al., 2003, “Preparation and microwave absorbing property of nanosize PSZFe magnetic particles”, Acta Poly Sin. No. 5, pp. 757-760.
Nelson, S.O., 2005, “Density-permittivity relationships for powdered and granular materials”, IEEE Trans Instrum Meas., Vol. 54, No. 5, pp. 2033-2040.
Park, M.J.; Choi, J.; Kim, S.S., 2000, “Wide bandwidth pyramidal absorbers of granular ferrite and carbonyl iron powders”. IEEE Transactions on Magnetics, Vol. 36, No.
5, pp. 3272-3274.
Yong, W.; Afsat, M.N.; Grignon, R., 2003, “Complex permittivity and permeability of carbonyl iron powders at microwave frequencies”, IEEE Antennas and Propagation Society Int Symp, Vol. 4, pp. 619-622.