ISSN 0104-6632 Printed in Brazil
www.abeq.org.br/bjche
Vol. 31, No. 02, pp. 303 - 312, April - June, 2014 dx.doi.org/10.1590/0104-6632.20140312s00002659
Brazilian Journal
of Chemical
Engineering
ERROR PROPAGATION IN OPEN
RESPIROMETRIC ASSAYS
C. C. Lobo
1, N. C. Bertola
1and E. M. Contreras
2*1
Centro de Investigación y Desarrollo en Criotecnología de Alimentos, (CIDCA), CONICET, Facultad de Ciencias Exactas, UNLP, 47 y 116 (B1900AJJ), La Plata, Argentina.
2
Instituto de Investigaciones en Ciencia y Tecnología de Materiales, (INTEMA), CONICET, Phone/Fax: + 54 223 4816600, Mar del Plata, Av. Juan B. Justo 4302 (B7608FDQ), Mar del Plata, Argentina.
E-mail: [email protected]
(Submitted: April 16, 2013 ; Revised: June 18, 2013 ; Accepted: July 23, 2013)
Abstract - This work deals with the calculation of the uncertainty of the exogenous respiration rate (Rex) and
the total oxygen consumed (OCT) derived from a single open respirometric profile. Uncertainties were
evaluated by applying a linear error propagation method. Results show that standard deviations (SD) of Rex
and OCT depend not only on the SD of the dissolved oxygen (σC) and kLa (σkLa), but also on the SD of the
derivative term (dC/dt) of the oxygen mass balance equation (σb). A Monte Carlo technique was employed to
assess σb; a power law expression for the dependence of σb as a function of σC, the time window (tw) and the
sampling rate (Δt) was proposed. The equations obtained in the present work are useful to calculate suitable conditions (e.g., biomass concentration, kLa) that minimize the coefficient of variation corresponding to Rex
and OCT.
Keywords: Respirometry; Error propagation; Respiration rate; Oxygen consumption.
INTRODUCTION
Respirometry is a well-established procedure in the field of biological wastewater treatment. Respi-rometric methods have been used to determine pa-rameters of kinetic models that describe the aerobic biodegradation of wastewaters, single compounds, or mixtures of chemicals (Cokgor et al., 2009; Orhon
et al., 2009). These techniques were also employed to evaluate the biodegradable fraction of wastewaters (Lagarde et al., 2005), and to monitor the acclimation process of an activated sludge to a new environment (Carvalho et al., 2004; Aktas, 2012). Additionally, several on-line respirometer-based biosensors in wastewater treatment plants have been developed. Based on the comparison between the actual respira-tion rate of the activated sludge with a given set point value (e.g., the historical respiration rate), these biosensors allow the early detection of a toxic waste-water (Sollfrank and Gujer, 1990; Vanrolleghem et
al., 1994). However, in order to avoid false alarms, the evaluation of the error associated with the meas-urement of the actual respiration rate is crucial to distinguish between a real event (e.g., a toxic wastewater) and aleatory fluctuations of the indicator used for toxicity (e.g., the decrease of the respiration rate).
Brazilian Journal of Chemical Engineering
obtain the expressions to estimate the error of the measurements of R and OC derived from a respi-rometric profile.
MATERIALS AND METHODS
Principle of the Open Respirometer
Batch respirometric tests are a powerful tool for the measurement of the respiration rate of both pure and mixture cultures, such as activated sludge. Al-though several respirometric principles are avail-able (Vanrolleghem and Spangers, 1998), nowadays the open (flowing gas/static liquid) respirometer (Vanrolleghem, 2002) is one of the most used for research applications (Contreras et al., 2008a,b; Lobo
et al., 2013).
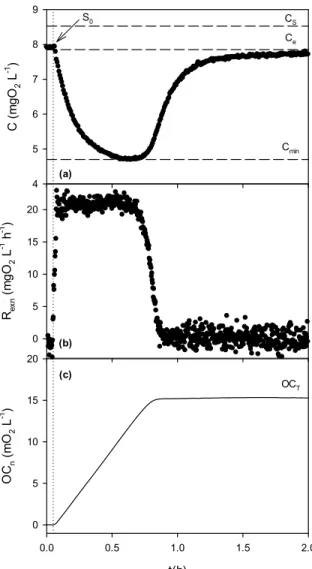
Figure 1 shows an example of the dissolved oxygen profile (Fig. 1(a)) and the respiration rate (Fig. 1(b)) as a function of time during a typical respirometry. When a pulse of an oxidizable substrate is added (t = 0.05 h), C decreases to reach a minimum value Cmin
= 4.7 mgO2 L-1 due to the increase of the respiration
rate associated with the oxidation of the external substrate. After this transient period, the respiration rate remains almost constant up to the substrate depletion. In some cases, experimental conditions are selected to achieve a constant biomass concentration (X) throughout the experiment, simplifying the interpretation of the obtained respirometric profile. For example, the use of a culture medium devoid of the nitrogen source, or an initial substrate concentra-tion (S0) much lower than X, both prevent a
significative increase of X during the experiment. Additionally, these conditions also lead to short assay times, minimizing the possible decay of biomass. If X remains constant throughout the experiment, the dissolved oxygen concentration after the substrate depletion will be equal to the dissolved oxygen concentration before the substrate addition.
The change of the dissolved oxygen concentra-tion (C) as a funcconcentra-tion of time (Fig. 1(a)) is deter-mined by two competing processes, namely, the oxygen supply and the microbial respiration. Generally, aeration conditions (e.g., air flow rate, agitation) are constants during a typical experiment; however, the respiration rate depends on the availability of an oxidizable substrate. Two processes are responsible for the observed respiration rate. In the absence of substrates, the microbial oxygen uptake rate reflects the endogenous respiration rate (Ren) associated with
maintenance processes; in this case, the biomass itself serves as the oxidizable substrate.
t(h)
0.0 0.5 1.0 1.5 2.0
OC
n
(m
O2
L
-1 )
0 5 10 15 20 Rex
n
(m
g
O2
L
-1 h -1 )
0 5 10 15 20
C (
m
g
O2
L
-1 )
4 5 6 7 8 9
Ce
Cmin
OCT
S0 CS
(a)
(b)
(c)
Figure 1: Example of a typical respirogram: a) dissolved oxygen (C), b) exogenous respiration rate (Rexn), and c) oxygen consumed (OCn) as a function
of time. Dotted line indicates the addition of 4-hydroxybenzoate. Experimental conditions: pH = 7, X = 1.8 gTSS L-1, S0 = 20 mg L-1, CS = 8.5 mgO2 L-1,
kLa = 6.8 h-1, Ce = 7.9 mgO2 L-1, Δt = 1 s, tw = 60 s.
Conversely, the exogenous respiration rate (Rex)
is defined as the oxygen uptake rate related to the oxidation of an external substrate (Contreras et al., 2008a,b; Lobo et al., 2013). Considering these proc-esses, the dissolved oxygen mass balance in the respirometer is:
(
)
L S en ex
dC
k a C C R R
dt = − − − (1)
where kLa is the volumetric oxygen mass transfer
coefficient, and CS is saturation dissolved oxygen
the absence of substrate Rex = 0; thus, C reaches a
constant value (Ce) due to the equilibrium between
oxygen transfer and endogenous respiration:
(
)
en L S e
R =k a C −C (2)
Combination of Eqs. (1) and (2) yields the fol-lowing expression:
(
)
ex L e
dC R k a C C
dt
= − − (3)
In the absence of an external substrate (Rex = 0),
the actual values of kLa, CS, and Ce in an open
respirometer can be obtained by several methods. For example, by stopping the oxygen supply, the first term on the right hand side of Eq. (1) becomes zero. Then, at a certain t = t0 the air supply is
recom-menced and C increases according to Eq. (1) (Ros, 1993; Vanrolleghem, 2002). Considering the two above mentioned aeration conditions and assuming that kLa, CS, and Ren are constants within the tested
time interval, integration of Eq. (1) leads to the fol-lowing expression:
( )
L 0
S en 0
L
k a t t
S en 0 0
L
1
C R t t t
k a C
1
C R t e t t
k a
− −
⎧ − ⎛ + ⎞ <
⎪ ⎜ ⎟
⎪ ⎝ ⎠
= ⎨
⎡ ⎤
⎪ − + ≥
⎢ ⎥
⎪ ⎣ ⎦
⎩
(4)
Thus, kLa, CS, and Ren values can be obtained by
fitting Eq. (4) to the data corresponding to dissolved oxygen concentration as a function of t before and after t0; then, from these parameters, Ce can be
calculated using Eq. (2). To determine Rex by means
of Eq. (3), a numerical differentiation, such as a moving regression window, is required:
(
)
wexn L e n t , t
R =k a C −C −b Δ (5)
where Rexn is the exogenous respiration rate
evalu-ated around the point n, which corresponds to the process time t = (n-1)Δt, Δt is the interval between two successive data (e.g., the sampling frequency), tw
is the time window, and
W
t , t
b Δ is the slope of the
regression line within tw.
Another important parameter that can be de-rived from a typical respirometric profile is the total oxygen consumed (OCT) to oxidize a given
amount of the tested substrate (Lobo et al., 2013). By
definition, the oxygen consumed (OC) as a function of time during the degradation of the exogenous substrate is
t ex 0
OC=
∫
R dt (6)Combining Eqs. (3) and (6), and considering that at t = 0, C1 = Ce, the following equation was obtained:
(
)
t
L e
0
t
L e e
0
dC
OC k a C C dt
dt
k a C t C dt C C
⎡ ⎤
= ⎢ − − ⎥
⎣ ⎦
⎛ ⎞
⎜ ⎟
= − − +
⎜ ⎟
⎝ ⎠
∫
∫
(7)
Taking into account t = (n-1)Δt, and applying the trapezoidal rule (Euler method) to the integral in Eq. (7):
(
)
(
)
n 1n L e e n i
i 2
n e
1
OC k a t C n 1 C C C
2
C C
−
=
⎡ ⎤
= Δ ⎢ − − + − ⎥
⎢ ⎥
⎣ ⎦
− +
∑
(8)
where OCn corresponds to OC evaluated at the point
n. When the exogenous substrate is depleted, Rex is
zero, thus, Cn = Ce. Based on these considerations,
the total oxygen consumed (OCT) can be calculated
as follows:
(
)
N 1T L e i
i 2 N 1
L e i
i 2
OC k a t N 2 C C
k a t NC C
−
=
−
=
⎡ ⎤
= Δ ⎢ − − ⎥
⎢ ⎥
⎣ ⎦
⎛ ⎞
≅ Δ ⎜⎜ − ⎟⎟
⎝ ⎠
∑
∑
(9)
Brazilian Journal of Chemical Engineering RESULTS AND DISCUSSION
Uncertainty of Respirometric Measurements
Equations (5) and (9) demonstrate that sources of error in the calculation of Rex and OCT are the error
associated with the measurements of C, kLa, and W
t , t
b Δ . Uncertainty of Rex, and OCT can be
evalu-ated by applying the linear error propagation method to Eqs. (5), and (9), respectively. Uncertainties were extrapolated from first-order local sensitivity func-tions using the following expression (Lucas and Prinn, 2005; Pasternack et al., 2006):
i
2 M
2 2
V
i i 1
V
θ =
⎛∂ ⎞
σ = ⎜ ⎟ σ
∂θ
⎝ ⎠
∑
(10)where
i
V
∂
∂θ is the first-order sensitivity of some
variable V (e.g., Rex, OCT) to the parameter θi (e.g.,
C, kLa), σ2Vand i 2
θ
σ are the variances of V and θi
respectively, and the summatory is over the M parameters of the equation used to calculate V (Saltelli et al., 2005).
In order to use Eq. (10) to evaluate the variances corresponding to Rex, (σ2Rexn) and OCT (σOC2 T), an
estimation of the variances associated with the measurements of C (σC2), kLa (σ2k aL ), and btW, tΔ
(σ2b) is necessary. With regard to the measurement of the dissolved oxygen concentration (C), we must distinguish between signal noise and accuracy of the dissolved oxygen probe. While signal noise can be reduced using several smoothing techniques (Hardle, 1991), accuracy depends on the probe characteristics. According to the specifications provided by several manufacturers, the accuracy of a typical optical dissolved oxygen probe within the range 0 - 10 mgO2 L-1 is ±0.1 mgO2 L-1 (YSI, 2013). Besides, the
literature has given less attention to the error associated with the volumetric oxygen mass transfer coefficient. Gogate and Pandit (1999) studied several of the methods that are commonly used for the measurement of the mass transfer coefficient; these authors concluded that, within the range of the operating conditions encountered in fermentor opera-tion, errors less than 10% of kLa can be expected.
Similar results were reported by Puskeiler and Weuster-Botz (2005). However, at the laboratory scale, kLa errors are usually lower. Moreover, the
error associated with kLa can be assumed to be
proportional to its value, the proportionality constant being the coefficient of variation of kLa (CVkLa). For
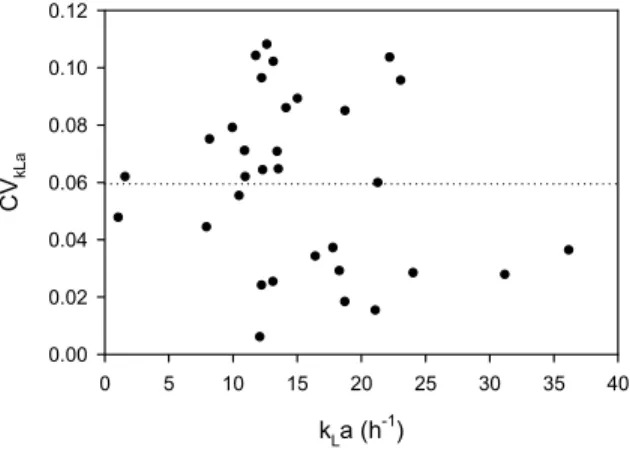
example, Figure 2 shows that CVkLa measured in our
respirometer (500 mL working volume) was approxi-mately 6% of the measured value. Based on the above mentioned considerations, the following stan-dard deviations were assumed in this work: σC = 0.1 mgO2 L-1, σkLa = CVkLa kLa, where CVkLa = 0.06.
kLa (h-1)
0 5 10 15 20 25 30 35 40
CV
kL
a
0.00 0.02 0.04 0.06 0.08 0.10 0.12
Figure 2: Coefficient of variation of kLa (CVkLa) as a
function of the kLa value in a 500-mL respirometer.
All measurements are triplicates at least. The dotted line indicates the overall mean value of CVkLa.
Evaluation of the Standard Deviation of the Deriva-tive Term
W
t , t
(b Δ ) by a Monte Carlo Technique
The estimation of the standard deviation of the derivative term
W
t , t
b Δ (σb) was assessed using a
Monte Carlo technique. For a given set of values corresponding to the time window (tw), and the
interval between two successive data (Δt), a noiseless profile of the dissolved oxygen concentration (C) was calculated assuming a linear decrease of C as a function of t with a constant slope (b) within tw. Then, for each C value, a Gaussian noise with σC = 0.1 mgO2 L-1 was added. Finally, from the
linear regression of the dissolved oxygen concentra-tion with the added noise as a funcconcentra-tion of time, the slope
w
t , t
b Δ was calculated (Figure 3). This
proce-dure was repeated 10000 times to obtain the distribution of
w
t , t
b Δ , statistical relevant estimations
of the mean, and the standard deviation of
w
t , t
b Δ
t(s)
0 10 20 30 40 50 60
C(m
g
L
-1 )
9.7 9.8 9.9 10.0 10.1 10.2 10.3
Figure 3: Example of the implementation of the Monte Carlo method to assess the standard deviation of bt , twΔ (
2 b
σ ). Conditions: tw = 60 s, Δt = 1 s, b = 10
mgO2 L-1 h-1, σC = 0.1 mgO2 L-1. Circles: noiseless
dissolved oxygen data. Tringles: data with a Gaussian noise. The continuous line represents the first order regression of the data with Gaussian noise to obtain
W
t , t
b Δ .
Figure 4 shows that a Gaussian distribution of the standard deviation of bt , twΔ (σb) was obtained by the
Monte Carlo method.
10000 runs
btw,Δt (mgO2 L-1 h-1)
5 6 7 8 9 10 11 12 13 14 15
fr
eq
uency
0 200 400 600 800 1000 1200
Figure 4: Distribution of bt , twΔ obtained with 10000
Monte Carlo runs. Tested conditions were the same as in Fig. 3. The continuous line represents the Gaussian curve. In this case, σb = 2.6 mgO2 L-1 h-1.
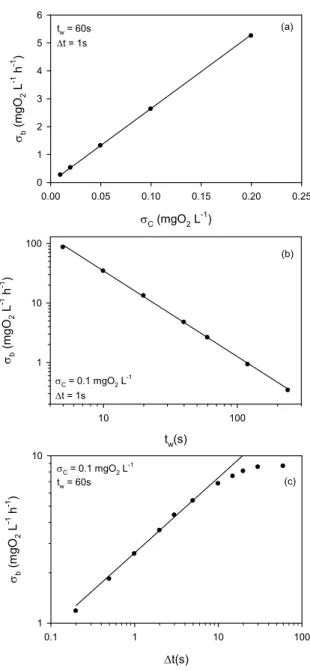
Simulations show that σb did not depend on the dissolved oxygen concentration (C), or on the actual slope (b). Conversely, Figure 5(a) shows a linear increase of σb as a function of σC. Moreover, Figures 5(b) and 5(c) show that, in the cases when tw/Δt was
higher than 10 (e.g., more than 10 points were used to calculate the slope
w
t , t
b Δ of the regression line),
σb has a power law dependence on tw, and Δt. Based
Δt(s)
0.1 1 10 100
σb
(m
gO
2
L
-1 h -1 )
1 10
tw(s)
10 100
σb
(mgO
2
L
-1 h -1 )
1 10 100
σC (mgO2 L -1
)
0.00 0.05 0.10 0.15 0.20 0.25
σb
(m
gO
2
L
-1 h -1 )
0 1 2 3 4 5 6
tw = 60s
Δt = 1s
σC = 0.1 mgO2 L -1
Δt = 1s
σC = 0.1 mgO2 L -1
tw = 60s
(a)
(b)
(c)
Figure 5: Effect of a) σC, b) tw, and c) Δt, on σb.
Each point corresponds to σb of 10000 Monte Carlo runs. Lines indicate σb values calculated by Eq. (11).
on these considerations, the following empirical equation was proposed to calculate σb as a function of σC, tw, and Δt:
b C wt t
β γ
σ = ασ Δ (11)
where σb, σC, tw, and Δt were expressed in mgO2 L-1
h-1, mgO2 L-1, and s, respectively. Equation (11) was
fitted to the data generated using the Monte Carlo method and the following coefficients were obtained:
Brazilian Journal of Chemical Engineering
deviation (σb) of the slope
w
t , t
b Δ obtained from the
regression line of the dissolved oxygen (C) as a function of the standard deviation of C (σC), the time window (tw) and the sampling rate (1/Δt).
While σC is an intrinsic feature of the DO probe, tw, and Δt can be selected to minimize σb. Because of
the aleatory noise of C, if the time window is small, then large variations on the derivative (therefore, on the respiration rate) are obtained. In most cases, this problem may be overcome by using digital filters or larger time windows (Savitzky and Golay, 1964; Bromba and Zlegler, 1981). Although there are several methods to select the optimal window size of digital filters (Vivo-Truyols and Schoenmakers, 2006), the selection of very large values of tw may
produce a flattened effect on Rex curves, masking the
actual behavior of the respiration rate as a function of time. Moreover, large tw values in combination
with a high sampling rate (e.g., a very low Δt value) produce very large data files, which are difficult to process due to computer limitations. The optimal selection of tw and Δt to evaluate the derivative arises
from a compromise between data noise characteris-tics, size of the data file, and accuracy in the estimation of the respiration rate (Marsili-Libelli and Tabani, 2002). It must be emphasized that, once tw,
and Δt are selected, σb only depends on σC; thus, because the accuracy of a typical optical dissolved oxygen probe is constant when operating in the range 0 - 10 mgO2 L-1, σb is also a constant.
Evaluation of the Variances Corresponding to Rexn, and OCT
Once the standard deviations of C (σC,), kLa
(
L
k a
σ ), and
w
t , t
b Δ (σb) are known, variances
corre-sponding to Rexn, and OCT were calculated by
applying Eq. (10) to Eqs. (5), and (9), respectively:
(
) (
)
(
)
exn
2 2
2
R kLa L e n
2 2
C L b
CV k a C C
2 k a
σ = −
+ σ + σ
(12)
(
)
(
)
T
2 2
2
OC CVkLaOCT 2 C Lk a t N
σ = + σ Δ (13)
The first term in Eq. (12) represents the contribution of the error in kLa to the total variance
of Rexn. This term changes throughout the experiment
from zero (Cn = Ce) to a given maximum (at Cn =
Cmin). The second term arises from the imprecision
of the DO. The third term in Eq. (12) represents the inaccuracy resulting from the estimation of the derivative and it depends on tW and Δt, as was
discussed previously. Equation (13) shows that the variance of the total oxygen consumed (OCT) is
comprised of two terms. The first one depends on the variance of kLa and is proportional to OCT; the
second term depends on the variance of C and is proportional to kLa and to the product Δt N, which
represents the total time of the respirogram. For ex-ample, considering the experimental conditions used in the respirogram shown in Figure 1 (kLa = 6.8 h-1,
Ce = 7.9 mgO2 L-1, tw = 60 s, Δt = 1 s), according to
Eq. (12), σb = 2.6 mgO2 L-1 h-1; thus, σRexnranges from
2.8 (at Cn = Ce) to 3.1 (at Cn = Cmin) mgO2 L-1 h-1.
Figure 1(c) shows that OC reaches a maximum value of 15.8 mgO2 L-1 at t = 1 h due to the substrate
deple-tion and then it remains constant; at this time, the product ΔtN = 1 h, resulting in
T
OC
σ = 1.4 mgO2 L-1
(Eq. (13)).
From a practical standpoint, the parameters that can be selected by the operator to obtain the most suitable results using an open respirometer are the initial substrate concentration (S0), the biomass
con-centration (X), the oxygen transfer coefficient (kLa),
and the dissolved oxygen sampling interval (Δt). Note that not all parameters are independent of each other. Equation (13) shows that, among others, the variance of OCT depends on the value of OCT, and
on the product Δt N, which represents the total time of the experiment. Because both OCT and the total
time are proportional to S0, σOCT increases as a
function of S0. As an example, the following case
study is used to derive the relation between these parameters.
Case Study: the Monod Model
The most used equation to represent the dependence of the substrate consumption rate as a function of the initial exogenous substrate concentration is the Monod equation. This equation can be employed to interpret the dissolved oxygen profile obtained from an open respirometric assay. In some cases, such as the example shown in Figure 1, it can be assumed that KS << S for most of the assay
Sm
dS
q X
dt ≈ − (14)
(
) (
)
L S en O/S Sm
dC
k a C C q Y q X
dt ≈ − − + (15)
where S is the substrate concentration that limits the respiration rate, qSm is the specific maximum
sub-strate consumption rate, qen is the specific
endoge-nous respiration rate, and YO/S is the substrate
oxidation coefficient. Before the addition of S, the dissolved oxygen concentration in the absence of substrate (Ce) is:
en
e S
L
q X
C C
k a
= − (16)
After the susbtrate addition, the respiration rate increases up to a maximum value (Rex-max)
ex max O/S Sm
R − =Y q X (17)
and C reaches a minimum (Cmin)
(
)
min S en O/S Sm C
L
X
C C q Y q C
k a
= − + ≥ (18)
In most respirometric assays, experimental condi-tions are usually selected to maintain the dissolved oxygen above a certain critical concentration (e.g., CC = 2 mgO2 L-1) to avoid the oxygen limitation of
the respiration rate. Thus, Eq. (19) imposes a severe restriction on the suitable values of X and kLa.
The total time necessary to achieve the susbtrate depletion (Δt N) can be calculated by integration of Eq. (14):
0 Sm
S t N
q X
Δ = (19)
where S0 is the initial substrate concentration.
Finally, assuming that the substrate oxidation coeffi-cient (YO/S) is a constant, the total oxygen consumed
(OCT) is:
T O/S 0
OC =Y S (20)
Equations (16) to (20) can be combined with Eqs. (12) and (13) to obtain the following:
(
)
(
)
2 2
Re x max kLa O/S Sm
2 2
C L b
CV Y q X
2 k a
−
σ =
+ σ + σ
(21)
(
)
T
2 2
2 0
OC kLa O/S 0 C L
Sm
S
CV Y S 2 k a
q X
⎛ ⎞
σ = + ⎜⎜σ ⎟⎟
⎝ ⎠ (22)
Equation (21) shows that σ2Re x max− is a function of the biomass concentration (X), and of the oxygen transfer coefficient (kLa); moreover, σOC2 T (Eq. 22)
also depends on the initial substrate concentration (S0). Although equations (21) and (22) are a function
of YO/S and qSm, these coefficients can be easily
obtained from a respirogram:
T O/S
0
OC Y
S
= (23)
ex max Sm
O/S
R q
Y X
−
= (24)
For example, according to Figure 1, Rex-max = 22
mgO2 L -1
h-1, and OCT = 15.8 mgO2 L -1
; considering that S0 = 20 mgS L-1, and X = 1.8 gTSS L-1,
accord-ing to Eqs. (23) and (24), values correspondaccord-ing to YO/S and qSm are 0.79 mgO2 mgS-1, and 15.5 mgS
gTSS-1 h-1, respectively.
Combining Eqs. (21) to (24), the expressions for the coefficients of variation corresponding to Rex-max,
and OCT (CVR, CVOC) can be obtained:
Re x max R
ex max
2 2
2 C L b
kLa
O/S Sm O/S Sm
CV R
k a
CV 2
Y q X Y q X
− − σ =
⎛ σ ⎞ ⎛ σ ⎞
= + ⎜⎜ ⎟⎟ +⎜⎜ ⎟⎟
⎝ ⎠ ⎝ ⎠
(25)
T
2
OC 2 C L
OC kLa
T O/S Sm
k a
CV CV 2
OC Y q X
σ ⎛ σ ⎞
= = + ⎜⎜ ⎟⎟
⎝ ⎠ (26)
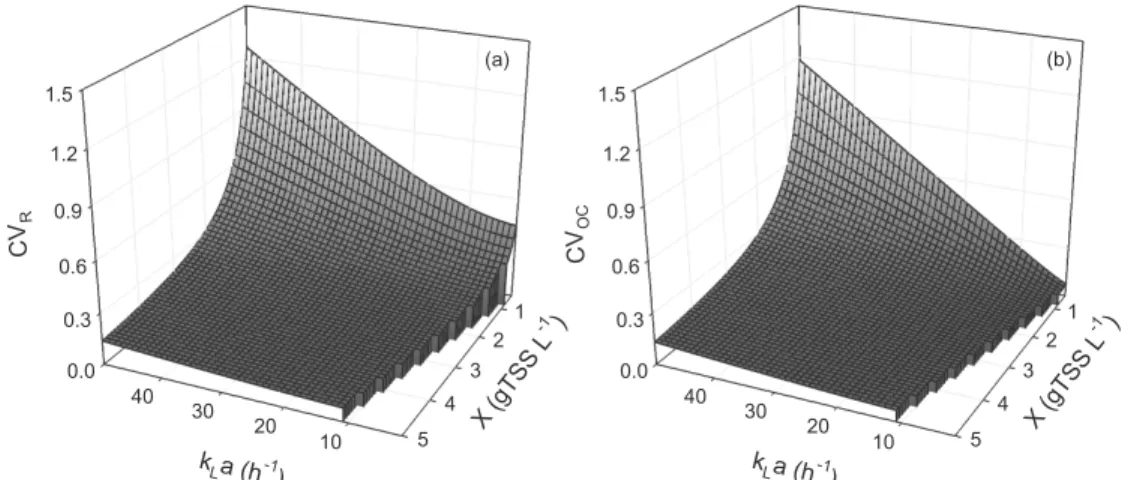
Equations (25) and (26) demonstrate that, in order to minimize CVR and CVOC, high values of X and
low values of kLa are necessary. However, these
conditions may also lead to dissolved oxygen values lower than the critical value (Eq. 18) (Fig. 6). Thus, the equations obtained in the present work are useful to obtain the suitable operative conditions (X, kLa)
that minimize CV values corresponding to Rex-max,
Brazilian Journal of Chemical Engineering
0.0 0.3 0.6 0.9 1.2 1.5
1 2 3 4
5 10 20 30 40
C
VR
X ( gTS
S L
-1)
k
La (h-1)
0.0 0.3 0.6 0.9 1.2 1.5
1 2 3 4
5 10 20 30 40
C
VO
C
X ( gTS
S L
-1 )
k
La (h-1)
(a) (b)
Figure 6: Effect of the volumetric mass transfer coefficient (kLa) and the biomass concentration
(X) on the coefficient of variation corresponding to (a) Rex-max, and (b) OCT calculated using Eqs.
(25) and (26), respectively. Conditions: CVkLa = 0.06, σC = 0.1 mgO2 L-1, σb = 2.6 mgO2 L-1 h-1,
Cs = 8.5 mgO2 L -1
, qen = 2 mgO2 gTSS -1
h-1, YO/S = 0.79 mgO2 mgS -1
, qSm = 15.5 mgS gTSS -1
h-1. Discontinuities indicate the (kLa, X) pairs for which Cmin < CC = 2 mgO2 L-1 (Eq. 18).
CONCLUSIONS
In this work, expressions were obtained for the evaluation of the standard deviation (SD) corre-sponding to the exogenous respiration rate (Rex) and
the total oxygen consumed (OCT) derived from a
single open respirometric profile.
Standard deviations of Rex and OCT not only
depend on the SD of the dissolved oxygen (σC) and kLa (σkLa), but also on the SD corresponding to the
derivative term (σb) of the oxygen mass balance equation of the respirometer.
The implemented Monte Carlo technique al-lowed calculating σb; an empirical power law expres-sion for the dependence of σb as a function of σC, the time window (tw) and the sampling rate (Δt) was
obtained.
The expressions obtained in the present work demonstrate that high values of X and low values of kLa are necessary to minimize the coefficient of
variation (CV) of Rex-max and OCT. However, these
experimental conditions may also lead to dissolved oxygen concentrations that could limit the substrate oxidation rate. For this reason, the equations ob-tained are useful to achieve the suitable operative conditions that minimize the CV of Rex-max, and OCT.
ACKNOWLEDGEMENTS
This work was supported by the Consejo Nacional de Investigaciones Científicas y Técnicas (CONICET),
by the Universidad Nacional de la Plata (UNLP), and by the Agencia Nacional de Promoción Científica y Tecnológica (ANPCyT), Argentina.
NOMENCLATURE
Latin Letters
w
t , t
b Δ slope of the regression line mgO2 L-1 h-1
C dissolved oxygen concentration
mgO2 L-1
CC critical dissolved oxygen
concentration
mgO2 L-1
Ce equilibrium dissolved
oxygen concentration
mgO2 L-1
Cmin minimum dissolved oxygen
concentration
mgO2 L-1
CS saturation dissolved oxygen
concentration
mgO2 L-1
CVkLa coefficient of variation of kLa
CVOC coefficient of variation of
OCT
CVR coefficient of variation of
Rex-max
kLa volumetric oxygen mass
transfer coefficient
h-1 N total number of data
OC oxygen consumed mgO2 L-1
OCT total oxygen consumed mgO2 L-1
qen specific endogenous
respiration rate
qSm maximum specific substrate
consumption rate
mgS gTSS-1 h-1 Ren endogenous respiration
rate
mgO2 L-1 h-1
Rex exogenous respiration rate mgO2 L-1 h-1
S0 initial substrate concentration mgS L-1
t time h
tw time window used for the
regression line
s
X biomass concentration gTSS L-1 YO/S substrate oxidation
coefficient
mgO2 mgS-1
Greek Letters
α, β, γ empirical coefficients of Eq. (11)
Δt time interval between two data
s
σb standard deviation of the slope of the regression line
mgO2 L-1 h-1 σC standard deviation of C mgO2 L-1 σkLa standard deviation of kLa h-1
T
OC
σ standard deviation of OCT mgO2 L-1 σRexn standard deviation of Rex at
the point n
mgO2 L-1 h-1
REFERENCES
Aktas, O., Effect of S0/X0 ratio and acclimation on
respirometry of activated sludge in the come-tabolic biodegradation of phenolic componuds. Bioresource Technology, 111, 98-104 (2012). Bromba, M. A. U., Zlegler, H., Application hints for
Savitzky-Golay digital smoothing filters. Ana-lytical Chemistry, 53, 1583-1586 (1981).
Carvalho, G., Novais, J. M., Pinheiro, H. M., Vanrolleghem, P. A., Model development and application for surfactant biodegradation in an acclimatising activated sludge system. Chemos-phere, 54, 1495-1502 (2004).
Cokgor, E. U., Insel, G., Aydin, E., Orhon, D., Res-pirometric evaluation of a mixture of organic chemicals with different biodegradation kinetics. Journal of Hazardous Materials, 161, 35-41 (2009). Contreras, E. M., Albertario, M. E., Bertola, N. C.,
Zaritzky N. E., Modelling phenol biodegradation by activated sludges evaluated through respi-rometric techniques. Journal of Hazardous Mate-rials, 158, 366-374 (2008a).
Contreras, E. M., Ruiz F., Bertola, N. C., Kinetic modeling of inhibition of ammonia oxidation by nitrite under low dissolved oxygen conditions.
Journal of Environmental Engineering, 134, 184-190 (2008b).
Dochain, D., Vanrolleghem, P. A., Van Daele, M., Structural identifiability of biokinetic models of activated sludge respiration. Water Research, 29, 2571-2578 (1995).
Guisasola, A., Baeza, J. A., Carrera, J., Sin, G., Vanrolleghem, P. A., Lafuente, J., The influence of experimental data quality and quantity on pa-rameter estimation accuracy. Andrews inhibition model as a case study. Education for Chemical En-gineers, 1, 139-145 (2006).
Gogate, P. R., Pandit, A. B., Survey of measurement techniques for gas–liquid mass transfer coeffi-cient in bioreactors. Biochemical Engineering Journal, 4, 7-15 (1999).
Hardle, W., Smoothing Techniques: With Imple-mentation. In S. Springer-Verlag New York, Inc. (1991).
Lagarde, F., Tusseau-Vuillemin, M-H., Lessard, P., Héduit, A., Dutrop, F., Mouchel, J-M., Variability estimation of urban wastewater biodegradable fractions by respirometry. Water Research, 39, 4768-4778 (2005).
Lobo, C. C., Bertola, N. C., Contreras, E. M., Stoichiometry and kinetic of the aerobic oxida-tion of phenolic compounds by activated sludge. Bioresource Technology, 136, 58-65 (2013). Lucas, D. D., Prinn, R. G., Parametric sensitivity and
uncertainty analysis of dimethylsulfide oxidation in the clear-sky remote marine boundary layer. Atmospheric Chemistry & Physics, 5, 1505-1525 (2005).
Marsili-Libelli S., Tabani F., Accuracy analysis of a respirometer for activated sludge dynamic model-ling. Water Research, 36, 1181-1192 (2002). Orhon, D., Cokgor, E. U., Insel, G., Karahan, O.,
Katipoglu, T., Validity of Monod kinetics at dif-ferent sludge ages - Peptone biodegradation under aerobic conditions. Bioresource Technology, 100, 5678-5686 (2009).
Pasternack, G. B., Gilbert, A. T., Wheaton, J. M., Buckland, E. V., Error propagation for velocity and shear stress prediction using 2D models for environmental management. Journal of Hidrology, 328, 227-241 (2006).
Petersen, B., Gernael, K., Vanrolleghem, P. A., Practical identifiability of model parameters by combined respirometric-tritimetric measurements. Water Science & Technology, 43, 347-355 (2001). Puskeiler, R., Weuster-Botz, D., Combined sulfite
method for the measurement of the oxygen trans-fer coefficient kLa in bioreactors. Journal of
Brazilian Journal of Chemical Engineering
Ros, M., Respirometry of Activated Sludge. Technomic Publishing Co., Inc. Basilea, Switzerland (1993). Saltelli, A., Ratto, M., Tarantola, S., Campolongo, F.,
Sensitivity analysis for chemical models. Chemi-cal Reviews, 105, 2811-2828 (2005).
Savitzky, A., Golay, M. J. E., Smoothing and differ-entiation of data by simplified least squares pro-cedures. Analytical Chemistry, 36, 1627-1639 (1964).
Sollfrank, U., Gujer, W., Simultaneous determina-tion of oxygen uptake rate and oxygen transfer coefficient in activated sludge systems by an on-line methods. Water Research, 24, 725-732 (1990). Vanrolleghem, P. A., Principles of Respirometry in
Activated Sludge Wastewater Treatment. Dis-sertation. Department of Applied Mathematics, Biometrics and Process Control. Gent University (2002).
Vanrolleghem, P. A., Kong, Z., Rombouts, G., Verstraete, W., An on-line respirographic biosensor for the characterization of load and toxicity of wastewaters. Journal of Chemical Technology & Biotechnology, 59, 321-333 (1994).
Vanrolleghem, P. A., Spangers, H., A hybrid respi-rometric method for more reliable assessment of activated sludge model parameter. Water Sicence and Technology, 37, 237-246 (1998).
Vanrolleghem, P. A., Van Daele, M., Dochain, D., Practical identifiability of biokinetic models of activated sludge respiration. Water Research, 29, 2561-2570 (1995).
Vivo-Truyols, G., Schoenmakers, P. J., Automatic selection of optimal Savitzky-Golay smoothing. Analytical Chemistry, 78, 4598-4608 (2006). YSI, The Dissolved Oxygen Handbook. YSI Inc.