*e-mail: [email protected]
Received: 30 July 2013 / Accepted: 12 January 2014
Wi-Bio: management policy aimed at the establishment of networks
for patient monitoring using IEEE 802.11
Vinícius Samuel Valério de Souza*, Ricardo Alexsandro de Medeiros Valentim, Gláucio Bezerra Brandão, Luiz Felipe de Queiroz Silveira, Marcel da Câmara Ribeiro Dantas, Pedro Thiago Valério de Souza
Abstract Introduction: Patient monitoring will tend to decline in the coming years due to a shortage of physical and human resources in hospitals. Therefore, several studies deine alternatives to improve patient monitoring using wireless networks. In these studies, a wireless network is used to transfer data generated by medical sensors without interacting with the trafic in the data network of the hospital. However, this approach should be avoided because there are demands for integration between user applications and patient monitoring. Therefore, this paper deines a patient monitoring system, called Wi-Bio, directed to the establishment of IEEE 802.11 networks that allows trafic generated by user applications. Methods: The formal validation of Wi-Bio was made through the design of Petri nets, and performance analysis was performed through simulations of the Network Simulator 2 tool. The adoption of this approach is justiied by the fact that Petri nets allow veriication of logical correctness of the designed systems, while simulations allow behavioral analysis of Wi-Bio in overload scenarios where many patients are monitored. Results: The results conirmed the validity of the designed Petri nets and showed that Wi-Bio is able to accomplish the temporal goals imposed by medical sensors, thereby promoting eficient integration of trafic present in the data network and the patient monitoring network. Conclusion: As described, Wi-Bio fulilled its objectives and motivates future studies aimed at complementing the obtained results.
Keywords Patient monitoring, Wi-Bio, IEEE 802.11, Petri nets and Network Simulator 2.
Introduction
Motivated by the emergence of new technologies and communication paradigms, several companies have committed efforts to develop systems that promote the improvement of processes deined in hospital automation (Araújo et al., 2012). A good indicator is the Continua Alliance, a consortium of over 200 companies that are investing in creating solutions aimed at improving the care of personal health services (Continua…, 2013).
Despite the existence of this trend to incorporate technological aspects in the medical ield, patient monitoring is usually conducted manually in hospitals, where members of the healthcare team must personally examine patients to verify their state of health (Varshney, 2006). The adoption of this procedure, however, will tend to compromise the quality of monitoring in the coming years because the shortage of physical and human resources in hospitals will increasingly overload members of the healthcare team (Ko et al., 2010a).
Given the issues outlined, it is clear that there is demand for solutions that promote improvements in the patient monitoring process carried out in hospitals. Because this monitoring is usually conducted through medical sensors, the use of wireless networks in the
automation of this process has become an interesting solution because through these networks, members of the healthcare team can follow up on patients’ vital signs without having to personally examine them (Ko et al., 2010a; Varshney, 2006).
Although wireless networks are an attractive solution, patient monitoring systems that work on such networks must meet a number of requirements for implementation in hospital environments. Some of these requirements are as follows (Chipara et al., 2009; Ko et al., 2010a; Moraes et al., 2010; Shin and Ramanathan, 1994; Varshney, 2006):
• Time restrictions: the generation of data by medical sensors usually occurs at periodic time intervals that can be set either by the sensor itself or by members of the healthcare team. In such sensors, the data generated have real-time constraints because the data are only valid during the time interval in which they are generated. Thus, the delivery of such data should occur deterministically and within their respective expiry dates;
deinition of procedures aimed at energy savings in these sensors;
• Robustness: hospital environments have characteristics that hinder data transmission through wireless links, such as metal doors, doors with EM shielding, among others. Therefore, monitoring systems should be robust with respect to transmission errors present in these communication scenarios; • Scalability: in emergency situations (such
as natural disasters), it is common to have a high number of inpatients in hospitals. Thus, monitoring systems must be able to guarantee delivery of data generated by medical sensors even under overload conditions;
• Mobility: quality of monitoring should be maintained even when there is mobility of patients in the hospital.
Currently there are several commercial platforms that use wireless networks to automate patient monitoring in hospitals (A&D Medical, 2013; LifeSync, 2013; Nonin Medical, 2013). The interoperability of these platforms has been problematic due to lack of standardization in technology and procedures used in the acquisition, transmission and formatting of data generated by medical sensors (Schnayder et al., 2005). Accordingly, to promote such integration, HL7 (Health Level 7) has committed efforts to build a framework designed to standardize features, such as the sharing, exchange and retrieval of medical information in hospital environments (Health…, 2013).
In addition to the commercial platforms, there are several papers in the literature that deine more sophisticated solutions to the patient monitoring process using wireless networks. Schnayder et al. (2005), for example, speciies CodeBlue as an ad hoc monitoring network formed by medical sensors that send and forward data transmitted by other sensors. In this work, because medical sensors perform data forwarding, their radio communication should always remain turned on, thus requiring high energy consumption of their batteries (Ko et al., 2010a).
Chipara et al. (2009) deined a solution composed of an infrastructured wireless network in which the medical sensors connect to a backbone to send data. The nodes of the backbone, in turn, forward the data received from the sensors to a collection station that is responsible for transmitting the data to the members of the health team at the hospital. In this work, through the use of the backbone, medical sensors do not perform the routing of data transmitted by other sensors. Therefore, these medical sensors can turn off their radios when they have no data
to transmit, with the aim of saving energy in their batteries (Ko et al., 2010a).
Similarly, Ko et al. (2010b) deined MEDiSN, which uses an architecture similar to that described in Chipara et al. (2009). The main difference between these two works lies in the fact that the algorithm used by the nodes of the backbone was improved in MEDiSN to reduce the loss of messages during routing of data received from the medical sensors to the collection stations.
Both studies presented solutions that have a common characteristic: the wireless network is used exclusively for the transfer of data generated by medical sensors. However, within the daily operations of hospitals, there may be stations (computers, smartphones, etc.) running various user applications (voice calls, ile transfer, video conferencing, etc.). In addition, there is a possibility of some of these stations running applications whose tasks are directly related to patient monitoring, such as alarm notiication (Araújo et al., 2012) and the detection of abnormalities in vital signs of patients (Carvalho et al., 2012), among others. In both cases, the applications running in these stations will generate data that must be transmitted over the network, which as stated above, will not be possible in the architectures deined by the works cited because on these architectures, the wireless network is allocated only to medical sensors. This paper deines a system for patient monitoring called Wi-Bio, which has the following objectives: to meet the requirements imposed by the cited hospital automation environments (real-time constraints, energy savings, and scalability, among others) and to allow the harmonious coexistence between the data generated by user applications and the medical sensors on the same wireless network.
Methods
Technologies used in the Wi-Bio project
IEEE 802.11 has two operating modes: ad hoc and infrastructured (Institute..., 2007). In ad hoc mode, the stations use the coordination function DCF (Distributed Coordination Function), through which they send data independently using the CSMA/CA (Carrier Sense Multiple Access/Collision Avoidance) algorithm (Institute..., 2007). However, in infrastructured mode, the network is divided into cells that are coordinated independently by devices called PCs (Pontual Coordinators), which are responsible for dividing the communication time of each cell into superframes comprised of two periods: CP (Contention Period) and CFP (Contention Free Period) (Institute..., 2007). During CP, the stations of each cell use DCF, and the cell works similarly as deined in the ad hoc operation mode (Institute..., 2007). During CFP, the stations of each cell use the coordination function PCF (Pontual Coordination Function) (Institute..., 2007), through which the PC controls the data transmission within the cell by polling stations (Institute..., 2007).
According to Ko et al. (2010b), the presence of a network infrastructure decreases the loss of data transmitted over wireless links. Therefore, the Wi-Bio works using resources deined in infrastructured operation mode described in IEEE 802.11 standard.
Although it has a number of advantages over the ad hoc operating mode, the infrastructured operation mode deined in IEEE 802.11 has several aspects that prevent its use in patient monitoring applications:
• High energy consumption at stations: in IEEE 802.11, the sending and receiving of data demand high energy consumption at stations (Varshney, 2006), which could be reduced by the switching off of radio communication at such stations during the time intervals in which the stations are not broadcasting (Ko et al., 2010a). Such an approach, however, cannot be adopted in IEEE 802.11 because radio shutdown could result in the loss of information transmitted over the network, whereas the stations can receive frames at any instant of time;
• Non-deterministic data delivery: in DCF, stations send data independently, which may result in collisions between frames transmitted by the wireless network (Moraes et al., 2010). At this point, to avoid further collisions, the exponential recoil mechanism (backoff) used in CSMA/CA introduces random waiting times at stations so that they can carry out new attempts to send frames that collided (Institute..., 2007). The adoption of this strategy, however, incorporates non-determinism in the delivery of data, a feature that is not interesting for
applications having real-time restrictions (Moraes et al., 2010; Ni et al., 2004); • Scalability issues: in PCF, the polling
mechanism requires that the stations only send data with prior authorization held by the PC; data are sent in the order in which such stations entered the cell (Institute..., 2007). Although this mechanism avoids the occurrence of collisions, it has scalability issues because the waiting time to be authorized for the stations that came in last in the cell is proportional to the number of existing stations in it. Thus, if such stations have data with real-time constraints, the delivery times of such data can expire due to the time that the stations must wait for authorization. Given the above mentioned aspects, an alternative to address these problems would be to use the addendum IEEE 802.11e (Institute..., 2005) instead of the IEEE 802.11 standard. The IEEE 802.11e deines the HCF (Hybrid Coordination Function) as a function of coordination aimed at providing QoS (Quality of Service) in IEEE 802.11 networks by specifying two access mechanisms: the EDCA (Enhanced Distributed Channel Access) and HCCA (HCF Controlled Channel Access) (Institute..., 2005). In EDCA, the stations send data independently, but before being sent, the data are mapped into predeined categories of access (voice, video, best effort and background trafic) that have different priorities for medium access (Institute..., 2005). In HCCA, the PC controls the data transmission by polling the stations of the cell. When authorizing the stations, the CP allocates time slots called TxOp (Transmission Opportunity) to the stations, by means of which they may send various types of data over the network (Institute..., 2005).
Although it has improvements over IEEE 802.11, IEEE 802.11e also has aspects that do not make it interesting for patient monitoring applications. For example, similar to IEEE 802.11, IEEE 802.11e has issues regarding the consumption of energy at stations. Moreover, as occurs in the DCF and PCF, the EDCA has been shown to be ineficient in the delivery of data that have real-time constraints (Moraes et al., 2006), and HCCA presents scalability problems (Moraes et al. 2010).
irmware upgrade of the entities that will compose the cells. Moreover, such changes are transparent to applications that use protocols belonging to the other layers of the TCP/IP model because they do not modify the headers and the services offered by such protocols.
Architecture and elements of Wi-Bio
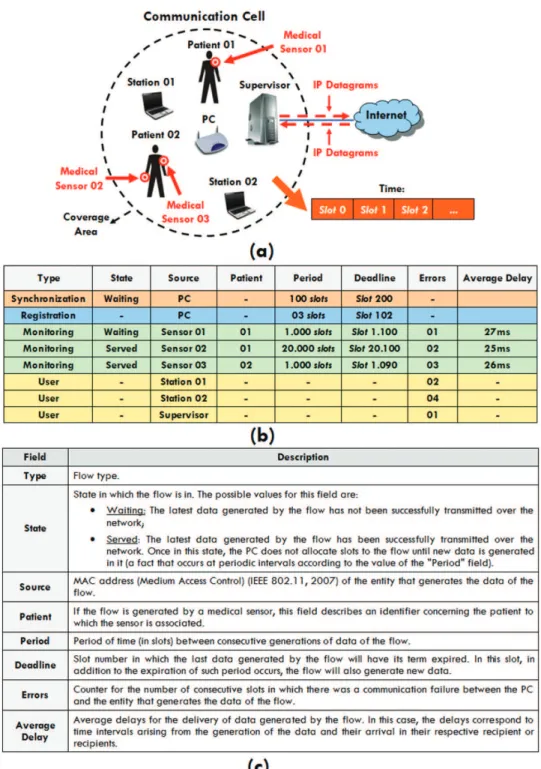
A Wi-Bio network is divided into communication cells similar to that shown in Figure 1a, in which, in addition to user stations, medical sensors and the PC, each cell has an element named Supervisor which is responsible for the following tasks:
• Storage of data generated by medical sensors: on Wi-Bio, the data generated by medical sensors that belong to a cell are forwarded to the Supervisor that stores the data in a predeined database;
• Provision of remote patient monitoring: as illustrated in Figure 1a, the PC has Internet access, through which it can send the data (which describe the measurements made by medical sensors) stored in its database to the health care staff outside of the cell, making it possible to monitor the health status of patients without having to personally examine them; • Provision of integration with user stations located outside the cell: on Wi-Bio, the PC can route IP (Internet Protocol) datagrams over the Internet to allow the exchange of data between user stations located inside and outside of the communication cell. Thus a user station belonging to the cell can send IP datagrams to the Supervisor that upon detecting that they are intended for stations located outside the cell, can direct the datagrams through the Internet to their recipients (similarly, the Supervisor may receive IP datagrams originating from stations outside the cell and can direct them into the local communication cell through the wireless network).
In the proposed architecture, a cell is limited by the coverage area of the PC, which requires the completion of prior planning on the quantity, location and coniguration of existing cells, aiming to avoid problems such as interference between neighboring cells and the presence of places where there is no cell connectivity, among others (Varshney, 2006). In addition to outlining the cell, the PC coordinates the exchange of messages held in the cell by dividing the communication time into slots of ixed duration. Within each slot, some element (sensor, station, Supervisor or the PC itself) is authorized to send data over the network. To accomplish this authorization, the PC
maintains a table with the speciication of active data lows in the elements of the cell; the format and description of this table are shown in Figures 1b and c, respectively.
Inside the cell, user stations can generate multiple data lows from applications that may be running, while medical sensors generate only one low that describes the monitoring of patients’ vital signs. Thus, as illustrated in Figure 1b, the rows of the table related to medical sensors describe parameters for the lows generated by the sensor, while the rows concerned with user stations are only relevant for the PC to know which of the stations are active in the cell.
Speciication/formal validation and description of the types of lows deined in Wi-Bio
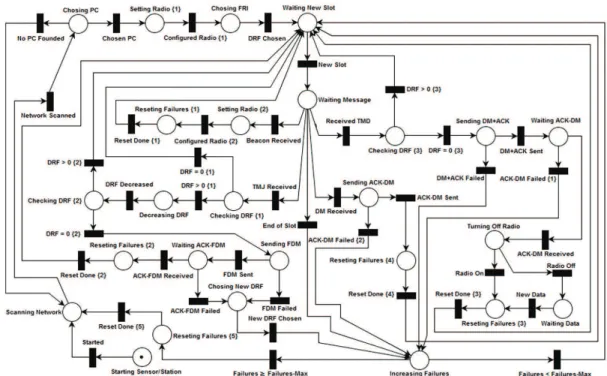
The formal speciication and validation of Wi-Bio were performed through the development and analysis of models in Petri Nets (Petri, 1962) because such networks allow us to check the logical correctness of the modeled systems upon detection of aspects such as the absence/presence of deadlocks and the safety and limitation of models, among others. Moreover, such networks are widely used for the description of protocols and communication systems (Cassandras and Lafortune, 2008; Godoy et al., 2010; Junqueira and Miyagi, 2009). The tool used when projecting the Petri nets of Wi-Bio was PIPE2 3.0 (Dingle et al., 2009).
As illustrated in Figure 1b, Wi-Bio deines several types of lows that can be present in the table of the PC; the low types are described in the subsections below. Information about the types and the format of messages deined by Wi-Bio can be visualized in Figure 2. A description of the ields that compose the messages is listed in Table 1. In addition, Figures 3 and 4 illustrate Petri nets for activities performed by the PC and by the sensors/stations of the cells within the slots, respectively.
Synchronization low
The synchronization low is generated by the PC, and its data have the following objectives: to notify the existence of the PC, to synchronize the elements of the cell and to report the values of its coniguration parameters (length of slot, transmission rates used, among others).
Figure 1. a) Communication cell; b) Flow table; c) Description of the low table.
Beacon frame in broadcast (transition “Beacon Sent”). In turn, when a sensor/station (Figure 4) receives this frame (transition “Beacon Received”), the sensor/ station conigures its radio communication according to the parameters described (transition “Conigured Radio {2}”).
Registration low
“Chosen PC”) and conigures its radio, adjusting it to the chosen PC (transition “Conigured Radio {1}”).
On Wi-Bio, each sensor/station has a variable named DRF (Description Requisition Factor) that controls the time instant at which it tries to register in the cell coordinated by the chosen PC. After setting up its radio, the sensor/station randomly selects a positive integer value for its DRF, which lies between 1 and a constant predeined in the sensors/stations, called DRFLIMIT (transition “DRF Chosen”). After performing the random selection, the sensor/station will decrease the value of its DRF in the slots allocated to the registration low and when the value of this variable reaches zero, the sensor/station will attempt to register in the cell.
On Wi-Bio, the registration is low generated by the PC to allow the registration of new sensors/
stations in the cell. Thus, when the PC (Figure 3) assigns a slot to the registration low, it expects a DIFS interval (Distributed InterFrame Space) (Institute..., 2007) and broadcasts a frame of DATA (Institute …, 2007) containing a TMJ (Token Message Joining) that notiies the allocation of the slot to the registration low (transition “TMJ Sent”).
When a sensor/station (Figure 4) receives the TMJ (transition “TMJ Received”), the sensor/station checks if it is already registered in the cell (as mentioned, the sensor/station will be registered only when its DRF reaches zero), and if it is not registered (transition “DRF > 0 {1}”), the sensor/station will decrease its DRF (transition “DRF Decreased”). If the DRF of the sensor/station equals zero (transition “DRF = 0 {2}”), it waits a DIFS interval and sends a DATA frame to the PC containing an FDM (Flow’s Description
Figure 2. (a) Message exchange – Synchronization low; (b) Format of the messages – Synchronization low; (c) Message exchange – Registration
Table 1. Description of the messages deined in Wi-Bio.
Beacon
Beacon This ield is equivalent to the beacon frame deined in IEEE 802.11 standard (IEEE 802.11, 2007). Through this ield, sensors and stations can synchronize themselves with the PC of the cell.
TSLOT Duration of a slot deined by the PC (calculated according to Equation 1).
ACKLIMIT Time interval that the sensors/stations must wait by an ACK frame (IEEE 802.11, 2007), after performing the sending of a DATA frame (IEEE 802.11, 2007) or of a DATA + ACK (IEEE 802.11, 2007)
DATAMAX Maximum size (in bytes) that can be sent within a DM.
TMJ/TMD (Token Message Joining/Token Message Data) ID-MESS Code that identiies that the message is a TMJ/TMD.
FDM (Flow’s Description Message) ID-MESS Code that identiies that the message is a FDM.
TYPE Code that identiies the type of a low (“Monitoring” or “User”) generated by the sensor/station that sent the FDM. SRC MAC address of the sensor/station that sent the FDM.
PAT Patient identiier of the sensor that sent the FDM (this ield is used only when the FDM refers to a low of type “Monitoring”).
PER Generation period of the data in the low (this ield is used only when the FDM refers to a low of type “Monitoring”). DEADLINE Deadline of the irst data generated in the low (this ield is used only when the FDM refers to a low of type
“Monitoring”).
DM (Data Message) ID-MESS Code that identiies that the message is a DM.
SRC/DST MAC (Medium Access Control) address (IEEE 802.11, 2007) of the source/destination of the data described in the DM.
PAT Identiication code of the patient to which the medical sensor that generated the DM is associated with. DATA Data/alarms generated by the source sensor/station.
LOCAL Localization of the source sensor/station.
Message) which describes the parameters of the low of data generated therein (transition “FDM Sent”).
When the PC (Figure 3) receives an FDM (transition “FDM Received”), it expects a SIFS interval (Short InterFrame Space) (Institute..., 2007) and sends an ACK frame (Institute..., 2007) to the sensor/station, acknowledging the receiving of this message (transition “ACK-FDM Sent”). Then, the PC checks if the sensor/station that sent the FDM is already registered into the cell, and if not (transition “Non-Registered”), it performs its registration by creating a new entry in its low table (transition “New Flow Registered”), with values initialized from the values contained in the FDM received (the “State” ield is initialized with the value “Waiting”).
In the registration process described so far, it may occur that distinct sensors/stations have their DRF zeroed in the same slot, resulting in collisions between the FDM sent by each of sensors/stations. Moreover, even if such collisions do not occur, other factors that compromise the transmission of the messages by the wireless network may occur, such as interference and noise, among others. Thus, as illustrated in Figure 4, if any of these situations occur (transitions “FDM Failed” and “ACK-FDM Failed”), the sensor/station picks a new random value for its DRF (transition “New DRF Chosen”) and again tries to register into the cell.
Monitoring/User low
User and monitoring lows are generated by the user stations and medical sensors in the cell, respectively. When the PC (Figure 3) allows a monitoring/user low in the slot, it waits a DIFS interval and sends to the sensor/station a DATA frame containing a TMD (Token Message Data), which notiies the sensor/station that it can send data over the network (transition “TMD Sent”).
When the sensor/station (Figure 4) receives a TMD (transition “Received TMD”), it checks if it is registered into the cell and, if it is indeed (transition “DRF = 0 {3}”), waits a SIFS interval and sends to the PC a DATA+ACK frame (Institute..., 2007) containing the acknowledgment of the TMD received (ACK) and a DM (Data Message) that describes the data/alarms generated by the sensor/station (transition “DM+ACK Sent”).
When the PC (Figure 3) receives a DM+ACK (transition “DM+ACK Received”), it waits a SIFS interval and sends a DATA+ACK frame containing a copy of the DM (DATA) received and the ACK that acknowledges its receipt (transition “DM+ACK Sent”). At this point, the copy of the DM is directed to some destination in the cell, whose MAC address (Medium Access Control) (Institute..., 2007) was informed in the DM received (Figure 2f) (in DMs generated by medical sensors, the receiving ield describes the MAC address of the Supervisor of the cell).
When the recipient of the DM (Figure 4) receives this message (transition “DM Received”), it waits a SIFS interval and sends an ACK frame (transition “ACK-DM Sent”) to the PC. In turn, when the sensor/ station (Figure 4) that sent the DM receives the ACK from this message (transition “ACK-DM Received”), it can (transition “Radio Off”) or not (transition “Radio On”) turn off its radio communication. In general, this shutdown is interesting to the medical sensors, as it allows them to save their battery supply (Ko et al., 2010a). Once turned off, the radio of the sensor/station is only turned on again when new data are generated (transition “New Data”).
Importantly, the energy savings obtained by turning off the radio in medical sensors occurs because the Wi-Bio is designed so that these sensors do not receive data during the time intervals in which no information is transmitted (a fact that as described above, is not found in the IEEE 802.11/11e). However, if this aspect had not been contemplated by Wi-Bio, such termination could only have been accomplished by using some synchronization protocol to avoid the loss of messages sent to the sensors during periods when their radios were turned off.
Calculating the duration of slots (TSLOT)
Inside the cell, the sensors/stations in Beacon frames (Figure 2b) are informed of the duration of a slot (TSLOT), which is calculated by the PC to allow for the exchange of messages carried in the slots allocated to the monitoring/user low (Figure 2e).
As mentioned, the Wi-Bio uses resources deined in the IEEE 802.11 standard, which speciies several addendums that have different values for the transmission rates used and the duration of DIFS, PIFS and SIFS intervals, among other aspects (Institute..., 2007; Varshney, 2006). Therefore, when calculating
TSLOT, the PC considers all of the particulars on the addendum used in the cell; therefore, TSLOT can be deined by the following equation:
2 *
SIZ SIZ
SLOT LIMIT
RATE
TMD + DM
T = DIFS + SIFS + + ACK
PC (1)
where TMDSIZand DMSIZ correspond to the sizes (in bits) of the frames that encapsulate a TMD and a DM, respectively, PCRATE corresponds to the transmission rate of the PC (in bps), and ACKLIMIT corresponds to the maximum duration (in seconds) that the elements of the cell should wait to receive ACK frames (as shown in Figure 2b, ACKLIMIT is also included in the Beacon frames).
Management of communication failures in Wi-Bio
Wi-Bio deines a number of procedures present in the PC and the sensors/stations, with the aim of treating
possible communication failures due to the wireless channel. As illustrated in Figure 1b, the low table of the PC (Figure 3) has a ield called “Errors” that describes the amount of consecutive slots in which there was a communication failure between the PC and the stations/sensors. At this point, whenever a failure occurs (transition “DM+ACK Failed {1}”), the PC increments the value of the “Errors” ield associated with the sensor/station where the failure occurred (transition “Incremented Errors”) and compares the new value of this ield to a constant previously set on the PC, called “ErrorsMax”. In this comparison, if the
value of “Errors” is greater than or equal to “ErrorsMax”
(transition “Errors ≥ Errors-Max”), the PC considers that the sensor/station is inactive and removes its low in the table (transition “Flow Removed”).
Similarly, sensors/stations have a variable called “Failures” that describes the number of consecutive slots in which there were communication failures between sensors/stations and the PC. Given this, whenever a fault occurs (transitions “End of Slot”, “FDM Failed”, “ACK-FDM Failed”, “DM+ACK Failed”, “ACK-DM Failed {1}”, “ACK-DM Failed {2}”), the sensor/station increments its variable “Failures” (place “Failures Incremented”) and compares its new value to a constant previously deined in each sensor/station, called “FailuresMax”. If “Failures” is greater than or equal to “FailuresMax” (transition “Failures ≥ Failures-Max”), the sensor/ station assumes that the PC is unavailable and restarts the passive network scanning.
Speciic features of Wi-Bio in relation to other works in the literature
Algorithm used for the allocation of slots to
the lows of the communication cell
As illustrated in Figure 3, after the slot is started (transition “New Slot”), the PC updates its lows table (transition “Table Updated”) and tries to allocate the slot to some real-time low of the cell (Synchronization or Monitoring) located in a state of “Waiting” (transitions “Synchronization Chosen” and “Monitoring Chosen”). At this point, if there is more than one real-time low in this state, the PC adopts the following strategies to choose which low should be permitted:
• EDF Algorithm (Earliest Deadline First): in real-time cases, the main concern is the delivery of data within their respective expiry dates. Thus, the irst strategy adopted corresponds to the use of the EDF scheduling algorithm (Liu and Layand, 1973), in which the slot is always assigned to the low with the smallest value in the “Deadline” ield in the lows table of the PC (Figure 1b);
• Quality of the links: in addition to meeting the deadlines, the PC tries to incorporate robustness to the possible errors in the transmission that may occur during the transmission of messages within the cell through the non-allocation of slots to sensors/stations whose links are in poor working condition. At this point, if two or more lows have the same value in the “Deadline” ield, the PC allocates the slot to the low that has the lowest value in the “Errors” ield;
• Delivery delays: apart from meeting deadlines and being robust to transmission errors, the PC also tries to deliver the data generated by sensors/ stations with the lowest possible latency. Thus, if two or more real-time lows have the same values in the ields “Deadline” and “Errors”, the PC authorizes the low that has the largest value in the “Average Delay” ield.
In the algorithm described, it may occur that all existing real-time lows are in the “Served” state. In such cases (transition “Real-Time Flows Served”), the PC deines that, while any of these lows return to the “Waiting” state, the slot allocation will occur through polling, where User and Registration lows form a circular queue which deines the order in which they will be authorized in the slots (transitions “Station Chosen” and “Stations Polling of Accomplished”). By adopting this strategy, the PC offers the possibility of slots to be allocated to user stations, thus enabling the coexistence of the trafic generated from these stations and medical sensors on the same wireless network.
Stability criteria of Wi-Bio
As stated, the PC uses the EDF, a real-time task scheduling algorithm, aimed at promoting the delivery
of data generated by the existing real-time lows in the cell within the deadlines. In this algorithm, the tasks to be scheduled are always activated at periodic intervals of time, and when activated, they have deadlines to complete (Liu and Layand, 1973). Therefore, EDF always allocates resources to the task that has the nearest deadline and speciies the use of a task as the percentage of time that it needs for its processing to be completed within the stipulated time for each activation (Liu and Layand, 1973). Thus, given a set of N real-time tasks, the use of the i-th task of this set (Ui) is deined as follows (Liu and Layand, 1973):
i i
i
C U =
P (2)
where Pi and Ci correspond to the task activation period and to the time required for the task to be completed in each activation (Liu and Layand, 1973), respectively. Therefore, the use of the set of N real-time tasks (U) can be given by (Liu and Layand, 1973):
1 1 or ∑ ∑ N N i i
i= i= i
C U = U U =
P (3)
Equation 3 represents the ability of the EDF to meet the constraints imposed by the N real-time tasks to be scheduled because in order for the restrictions to be satisied, the following stability criterion must be checked (Liu and Layand, 1973):
U≤1 (4)
Limits of Wi-Bio in meeting the deadlines set
by the real-time lows
In worst case scenarios, all real-time lows of the cell are in the state “Waiting”, and all of the links are in poor working condition. Therefore, it is interesting to deine what criteria Wi-Bio must meet to ensure the delivery of data generated by real-time lows within the prescribed period even in the occurrence of worst-case situations.
Inside the cell, the PC considers real-time lows as tasks to be scheduled by the EDF algorithm. As mentioned earlier, the maximum number of slots that the PC can allocate to a low, before removing the low, is limited by the amount of ErrorsMax. Thus, the maximum computing time that a low/task can receive in Wi-Bio is equal to ErrorsMax (Ci = ErrorsMax), and the use required by the set of the N tasks/existing real-time lows in the cell can be calculated as follows:
1 ∑ N Max TR i= i Errors U =
P (5)
where Pi is obtained from the “Period” ield in the
Equation 5 depicts the maximum utilization required by the real-time lows in worst case scenarios. Based on the constraint described in Equation 4, to ensure that the active real-time lows in the cell have met their constraints even in the occurrence of these scenarios, the following stability criterion must be checked:
1 ≤
TR
U (6)
Strategies and tools used to measure the performance of Wi-Bio
Performance analysis of Wi-Bio was performed by the simulation of test scenarios designed through the Network Simulator 2 (NS2) tool (Fall and Varadhan, 2011), which generates trace iles that describe all events that occurred in the simulated networks.
Software was developed in Java to extract data from the generated trace iles, and based on the extracted data, charts and tables were raised in SCILAB 5.3.2 containing measures of performance of Wi-Bio.
Figure 5a illustrates the test scenario adopted in the simulations, which sought to portray a real patient monitoring environment corresponding to a loor of the nurses sector at the University Hospital Onofre Lopes (HUOL) located in Natal/RN. As illustrated, we considered the existence of 72 patients who move randomly in this scenario and have an associated pulse oximeter and an EKG monitor (Electrocardiogram). The data generation rates adopted in these sensors were 20 s (Schnayder et al., 2005) and 1 s (Ko et al., 2010b), respectively. Furthermore, we also considered the existence of 3 user stations and assumed that Stations 2 and 3 were used by visitors of this hospital who were taking a PCMU voice call (RFC 4856, Internet…, 2007) among themselves, while Station
1 was used by a member of the health care team who communicated every 100 ms with the Supervisor to receive the location of patients initially located in Room 1 (patients 1-6). The adoption of these types of trafic at the user stations is justiied by the fact that they possess high transmission rates, which demand a network with high bandwidth (Moraes et al., 2010). Thus, when considering such trafic, the results obtained in the simulations will portray the eficiency of Wi-Bio in the management of transmission of data generated by user applications over the same network used by medical sensors.
In NS2, the simulation of IEEE 802.11 networks considers the addendum IEEE 802.11a (Institute..., 2007) as standard (Fall and Varadhan, 2011); therefore, the sensors/stations deined in the test scenario used this addendum. Moreover, with the aim of incorporating practical aspects of wireless communications (mobility, noise, among others) within the simulation, the network links were mapped on the model described in Silveira (2002), considering a signal-to-noise ratio of 0 dB. In this model, each link is mapped to a Markov chain similar to that illustrated in Figure 5b, and the procedure that contemplated all aspects present in IEEE 802.11a was chosen.
In the test scenario, the loor was considered as a single communication cell, for which the values for the portion size of data encapsulated in a DM (DATA ield in Figure 2f) and for TSLOT were 230
bytes and 1 ms, respectively. Moreover, to generate a suficiently large number of packets in the sensors and stations, the scenario was simulated such that both patient monitoring and trafic generation in user stations lasted 6 hours, during which each ECG monitor generated 21.600 packages, each pulse oximeter generated 1.080 packets, stations 2 and 3 generated 1.080.000 packets each and the Supervisor sent 216.000 packets to station 1. In addition to these aspects, the scenario was also simulated considering that the stations/sensors used the HCCA access scheme deined in the IEEE 802.11e. This simulation did not consider the EDCA because it presents problems for the eficient delivery of data that have real-time constraints (Moraes et al., 2006).
Results
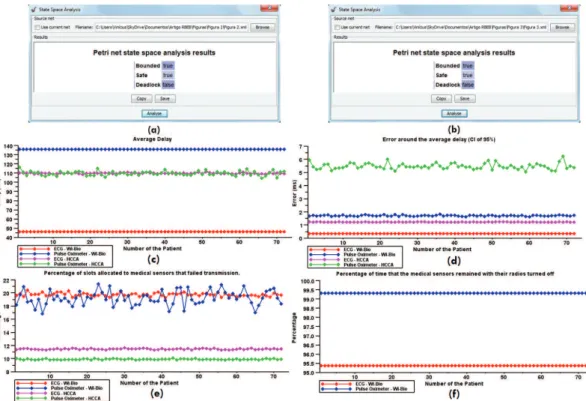
Figure 6 shows the results of the analysis of Petri nets from the PC (item “a”) and from the sensors/stations (item “b”) and illustrates performance measures obtained for the sensors associated with patients deined in the test scenario. In this igure, the values expressed in the charts of the average delay (item “c”) deine Conidence Intervals (CI) of 95% in each sensor; the error values of these intervals are illustrated in item “d”. The charts in item “f” illustrate the percentage of time that the sensors remained with
their communication radios off during the simulation. These percentages, in virtue of IEEE 802.11e not having power saving mechanisms, are only presented for the simulation of Wi-Bio.
Figure 7 shows charts depicting the temporal behavior of Wi-Bio and of the HCCA. In this igure, the charts related to the monitoring low (items “a” and “c”) are presented for each sensor type deined in the test scenario (ECG and pulse oximeters), and the charts related to user lows (items “b “and” “d”) depict the quality of voice calls made between stations 2 and 3 and the trafic effectiveness of the location of patients between the Supervisor and the station 1. Furthermore, Figure 7 also illustrates a table depicting the values obtained for a series of performance measures extracted from simulations (“e”).
Discussion
Analysis of the models on Petri nets and
monitoring lows
Regarding Petri nets designed for the PC (Figure 3) and sensors/stations (Figure 4), Figures 6a and 6b show that both were limited (bounded), safe and with no deadlocks, which ensures logic compliance with the developed models (Cassandras and Lafortune, 2008) and ensures proper functioning of the elements that compose the communication cells.
Regarding the monitoring lows, the irst analysis corresponds to meeting the real-time constraints imposed by medical sensors, which consists of two aspects: meeting deadlines for the delivery of the data generated in these sensors and determining the execution of such delivery. Figures 6d, 7c and 7e show that simulations of Wi-Bio and HCCA present no losses of deadlines, but with respect to determinism, Wi-Bio, once it achieved lower values for the errors of the conidence intervals deined and the standard deviation of delivery delays, was more stable than HCCA.
Apart from fulilling the real-time constraints, another analysis performed corresponds to the eficiency of the power saving mechanism deined in Wi-Bio. In this analysis, as illustrated in Figure 6f, all sensors remained with their communication radios off for over 95% of the simulation time, proving the effectiveness of the power saving mechanism for these sensors.
Figure 6. (a) Analysis of the Petri net of the PC; (b) Analysis of the Petri net of a sensor/station; (c) Average delay delivery of the data generated
in medical sensors; (d) Error around the average delay delivery of the data generated in medical sensors (CI of 95%); (e) Percentage of slots
allocated to medical sensors that failed transmission; (f) Percentage of time that the medical sensors remained with their radios turned off.
Figure 7. Simulation results over time; (a) Average delay – Monitoring low; (b) Average delay – User low; (c) Standard deviation of the
and for pulse oximeters, the network links were more problematic in the simulation of Wi-Bio. Despite this fact, it was able to accomplish the delivery of data generated by medical sensors within the deadlines, demonstrate a more deterministic behavior compared to HCCA and prove itself eficient in energy consumption.
Finally, one last point that deserves to be analyzed concerns the delivery delays, as shown in Figures 6c and 7a. For EKG monitors and pulse oximeters, the delays were lower in the simulations of the Wi-Bio and HCCA, respectively. However, according to Shin and Ramanathan (1994), provided that the real-time constraints imposed by medical sensors are met, the patient monitoring applications are tolerant to delays in delivery of data generated in these sensors. Therefore, although Wi-Bio had a lower performance for pulse oximeters, it was eficient in the delivery of data generated in these sensors.
Analysis of user lows
Regarding user lows, three aspects were analyzed: delivery delays and determining and meeting the deadlines stipulated by the data generated in the lows. The charts in Figure 7b show a comparison of the various trafic types deined in the test scenario (voice call and location); Wi-Bio showed smaller delivery delays than HCCA. In addition, as shown in Figure 7d, the standard deviation of these delays was also lower in Wi-Bio, thus demonstrating its superior performance with respect to determinism.
With regard to meeting deadlines, a PCMU voice call generates samples every 20 ms (RFC 4856, Internet…, 2007); the samples must be delivered to the recipients within this generation period (Moraes et al., 2010). Figure 7e shows that approximately 9.39% of voice packets have lost their deadlines with Wi-Bio, while in HCCA, this loss was approximately 89.09%. According to Kostas et al. (1998), the maximum acceptable loss rate for voice calls over IP networks is approximately 10%. Thus, apart from Wi-Bio presenting a far superior performance compared to HCCA, Wi-Bio is within tolerable limits of loss rate. A similar analysis can be performed for the packets generated by the supervisor in the location low; the packets are generated every 100 ms, and when they are generated, they must be delivered to the station 1 within that period. Figure 7e shows that the performance of Wi-Bio was again much higher than that of HCCA because the loss rates for packets were 2.92% and 45.37%, respectively.
Based on the results obtained, it is clear that Wi-Bio fulilled the requirements imposed by hospital automation environments, proved its capability in integrating the trafic generated by user applications and medical sensors on the same wireless network and presented a performance superior to HCCA in
most of the analyzed requisites. However, Wi-Bio acts only in the coordination of message exchange carried inside of the cell and does not deine aspects such as format of the existing tables in the database of the Supervisor, network infrastructure and procedures related to the exchange of IP datagrams between the supervisor and the elements (user stations and/or members of the health care team) outside of the cell, and mechanisms aimed at security and conidentiality of data sent over the network, among others. Thus, future work can address these issues and develop solutions aimed at their implementation.
The authorization of user lows in Wi-Bio occurs through the polling of stations registered into the cell, but just like the monitoring lows, the data generated from these stations may have deadlines (as in voice calls/video, for example). Thus, future studies may deine solutions that enable more eficient management of trafic generated by user lows in Wi-Bio.
In addition to the items described so far, other studies can investigate aspects of Wi-Bio that have not been veriied in this paper, such as simulations of scenarios that go beyond the limits of stability described in Equation 6, analysis of the eficiency of the delivery of alarms generated in the sensors, and the modeling of elements of the cell using timed Petri nets, among others.
Acknowledgment
We acknowledge the Laboratory for Technological Innovation in Healthcare (LAIS) and the University Hospital Onofre Lopes (HOUL) for supporting the development of this research by providing the infrastructure.
References
A&D Medical. UA-767 Wireless blood pressure monitor. [Internet]. [cited 2013 Oct 09]. Available from: http://www. quickmedical.com/LifeSource/UA767pc.html.
Araújo BG, Valentim RAM, Lacerda JMT, Carvalho DR, Dantas MCR, Diniz J Jr. Modelo arquitetural para geração de alertas aplicado ao monitoramento de pacientes em ambiente hospitalar. Revista Brasileira de Engenharia Biomédica. 2012; 28(2):169-78.
Carvalho DR, Araújo BG, Lacerda JMT, Dantas MCR, Valentim RAM. Uma arquitetura para detecção online de transientes em sinais de eletrocardiograma sobre o protocolo PM-AH. Revista Brasileira de Engenharia Biomédica. 2012; 28(4):346-54. http://dx.doi.org/10.4322/rbeb.2012.041
Cassandras CG, Lafortune S. Introduction to discrete event systems. 2nd ed. Springer; 2008. http://dx.doi. org/10.1007/978-0-387-68612-7
Symposium proceedings [electronic resource]. 2009 Nov 14; 2009:103-7. PMid:20351831 PMCid:PMC2815421. Continua Health Alliance [Internet]. [cited 2013 Aug 09]. Available from: http://www.continuaalliance.org/. Dingle NJ, Knottenbelt WJ, Suto T. PIPE2: A tool for the performance evaluation of generalized stochastic Petri nets. [Internet]. [cited 2013 Oct 19]. Available from: http:// www.doc.ic.ac.uk/~wjk/publications/dingle-knottenbelt-suto-per-2009.pdf.
Fall K, Varadhan K. The ns manual. The VINT project [Internet]. 4 Nov 2011 [cited 2012 Dec 26]. Available from: http://www.isi.edu/nsnam/ns/doc/ns_doc.pdf.
Godoy EP, Lopes WC, Sousa RV, Porto AJV, Inamasu RY. Modelagem e simulação de redes de comunicação baseadas no protocolo CAN – Controller Area Network. Revista Controle & Automação. 2010; 21(4):425-38. http://dx.doi. org/10.1590/S0103-17592010000400008
Health Level Seven. [Internet]. [cited 2013 Oct 10]. Available from: http://www.hl7.org/.
Institute of Electrical and Electronics Engineers – IEEE. IEEE Std 802.11-2007: Telecommunications and information exchange between systems - local and metropolitan area networks – speciic requirements. Part 11: Wireless LAN Medium Access Control (MAC) and Physical Layer (PHY) speciications. IEEE; 2007. (Revision of IEEE 802.11-1999). Institute of Electrical and Electronics Engineers – IEEE. IEEE Std 802.11e-2005: Wireless LAN Medium Access Control (MAC) and Physical Layer (PHY) speciications amendment 8: Medium Access Control (MAC) quality of service enhancements. IEEE; 2005.
Internet Engineering Task Force - IETF. Media Type Registration of Payload Formats in the RTP Proile for Audio and Video Conferences. IETF Trust; 2007. Request for Comments: 4856.
Junqueira F, Miyagi PE. Modelagem e simulação distribuída de sistema produtivo baseado em rede de Petri. Revista Controle & Automação. 2009; 20(1):1-19. http://dx.doi. org/10.1590/S0103-17592009000100001
Ko J, Chenyang L, Srivastava MB, Stankovic JA, Terzis A, Welsh M. Wireless sensor network for healthcare. Proceedings of IEEE. 2010a; 98(11):1947-60. http://dx.doi.org/10.1109/ JPROC.2010.2065210
Ko J, Lim JH, Chen Y, Musaloiu-E R, Terzis A, Masson GM, Gao T, Destler W, Selavo L, Dutton RP. MEDiSN: Medical Emergency Detection in Sensor Networks. ACM Transactions on Embedded Computing Systems (TECS). 2010b; 10(1):1-28. http://dx.doi.org/10.1145/1814539.1814550
Kostas TJ, Borella MS, Sidhu I, Schuster GM, Grabiec J, Mahler J. Real-Time voice over packet-switched networks. IEEE Networks. 1998; 12(1):18-27. http:// dx.doi.org/10.1109/65.660003
Liu CL, Layland JW. Scheduling algorithms for multiprogramming in a hard-real-time environment. Journal of the ACM (JACM). 1973; 20(1):46-61. http://dx.doi.org/ 10.1145/321738.321743
LifeSync. LifeSync wireless ECG system [Internet]. [cited 2013 Oct 09]. Available from: http://www.lifesynccorp. com/products/wireless-system.html.
Moraes R, Portugal P, Vasques F. Simulation analysis of the IEEE 802.11e EDCA protocol for an industrially-relevant real-time communication scenario. In: IEEE Conference on Emerging Technologies and Factory Automation: Proceedings of IEEE Conference on Emerging Technologies and Factory Automation (ETFA); 2006 Sept 20-22; Prague, Czech Republic. IEEE; 2006. p. 202-9.
Moraes R, Vasques F, Portugal P. Survey of real-time communication in CSMA-based networks. Network Protocols and Algorithms. 2010; 2(1):158-83. http://dx.doi.org/10.5296/ npa.v2i1.327
Ni Q, Romdhani L, Turletti T. A survey of QoS enhancements for IEEE 802.11 wireless LAN. Journal of Wireless Communications and Mobile Computing. 2004; 4(5):547-66. http://dx.doi.org/10.1002/wcm.196
Nonin Medical. Avant Medical 4000 wireless tabletop pulse oximeter [Internet]. [cited 2013 Oct 09]. Available from: http://www.nonin.com/ProductDetail.aspx?ProductID=12.
Petri CA. Kommunikation mit automaten [PhD thesis]. Bonn: Darmstadt University of Technology; 1962. Schnayder V, Chen B, Lorincz K, Fulford-Jones TRF, Welsh M. Sensor network for medical care. Technical Report TR-08-05, Division of Engineering and Applied Sciences, Havard University [Internet]. 2005. Available from: http://www. eecs.harvard.edu/~konrad/papers/codeblue-techrept05.pdf.
Shin KG, Ramanathan P. Real-time computing: a new discipline of computer science and engineering. Proceedings of the IEEE. 1994; 82(1):6-24. http://dx.doi. org/10.1109/5.259423
Silveira LFQ. Desempenho de sistemas com codiicação Wavelet e Diversidade Espácio-Temporal em canais sujeitos ao desvanecimento Rayleigh plano [dissertação]. Campina Grande: Universidade Federal de Campina Grande; 2002. 100p.
Varshney U. Patient monitoring using infrastructure-oriented wireless LANs. International Journal of Electronic Healthcare. 2006; 2(2):149-63. PMid:18048241.
Authors
Vinícius Samuel Valério de Souza*, Ricardo Alexsandro de Medeiros Valentim, Gláucio Bezerra Brandão, Luiz Felipe de Queiroz Silveira, Marcel da Câmara Ribeiro Dantas, Pedro Thiago Valério de Souza