Cláudia Cossentino Bruck Marçal
Marco Aurélio Peres
Programa de Pós-Graduação em Saúde Coletiva. Centro de Ciências da Saúde. Universidade Federal de Santa Catarina. Florianópolis, SC, Brasil
Correspondence:
Cláudia Cossentino Bruck Marçal R. Presidente Coutinho, 579 Sala 604 – Centro
88015-230 Florianópolis, SC, Brasil E-mail: claudiabruck@gmail.com Received: 6/7/2010
Approved: 14/11/2010
Artigo baseado na dissertação de mestrado de Marçal CCB apresentada ao Programa de Pós-Graduação em Saúde Coletiva da Universidade Federal de Santa Catarina em 2009.
Article available from: www.scielo.br/rsp
Self-reported voice problems
among teachers: prevalence
and associated factors
ABSTRACT
OBJECTIVE: To estimate the prevalence of self-reported voice problems and to identify associated factors.
METHODS: A cross-sectional study was carried out in a sample of 393 public elementary and middle school teachers in Florianópolis, Southern Brazil, in 2009. A self-administered questionnaire was used. A multivariable Poisson regression model was performed to estimate prevalence ratios and their related 95% confi dence intervals.
RESULTS: The prevalence of voice problems was 47.6% (95%CI 42.6;52.5). In the fi nal adjusted analysis the following variables remained associated with a higher prevalence of voice problems: being female and the presence of rhinitis/sinusitis and pharyngitis.
CONCLUSIONS: A high prevalence of self-reported voice problems was found among the teachers studied.
DESCRIPTORS: Voice Disorders, epidemiology. Faculty. Occupational Health. Cross-Sectional Studies.
INTRODUCTION
Voice problems are common disorders among teachers who are professional voice users where the voice is a key instrument in their work.9
Dysphonia is any change in voice due to a functional and/or organic disorder of the vocal tract that prevents natural production of voice. It can manifest as several symptoms such as tiredness or strain while talking, hoarseness, persistent throat clearing or cough, sensation of chest tightness or heaviness in the throat, voice failures, among others.2,9 A 2006 study found an association
between voice disorders and professional voice use.a A review of Brazilian and
international studies on vocal disorders among teachers showed a prevalence ranging between 20% and 89%.12
High vocal demand, sociodemographic factors and risks directly related to work organization and environment are all related to the occurrence of dysphonia. While working teachers are exposed to other harmful factors in the workplace that can affect their general and vocal health by creating competing sounds and leading to greater vocal strain and demand. Environments with internal and external background noise, classrooms with inadequate acoustics, excessive number of students in a classroom, exposure to dirt and chalk in the classroom
are some of the harmful agents that can negatively affect teachers’ vocal health.3 Age-related changes,
gender-related differences in human vocal anatomy, allergies, upper respiratory infections, drug use, smoking and dehydration of vocal fold surface have also been associ-ated with voice disorders.9-11
The multifactorial nature of causes of dysphonia, its high prevalence and limited knowledge about vocal output have encouraged speech and language therapists (SLTs) to develop collective works with teachers. A sound knowledge of the professional use of voice as well as of the work environment and job characteristics can help planning specifi c prevention actions targeted to this professional group2,3 such as Workplace Health
and Wellness Program at local public schools in the city of Florianópolis, Southern Brazil.
This study aimed to estimate the prevalence of self-reported voice problems and to identify associated factors among teachers.
METHODS
A cross-sectional study including teachers actively working in 36 public elementary and middle schools (grades 1 to 9) was conducted in the city of Florianópolis. Florianópolis had an estimated population of 416,269 inhabitants in 2007 and a literacy rate of 96.7%. There were 107 public schools, of which 36 elementary and middle schools and 71 preschools with 3,945 teachers, 31.8% of them permanent and 68.2% replacement/ contracted. Elementary/middle school teachers accounted for a third of all teachers working in public schools, of which 56% were permanent, 38% replace-ment and 6% relocated.b
All teachers actively working in 2009 were eligible to participate in the study, regardless of the type of their employment contract, totaling 1,044.
Physical education, sign language, support rooms, and foreign language teachers and those performing administrative activities were excluded from the study because the characteristics of their work organization, physical workplace and vocal demand were different from those of the target population.
For sample size estimation, a universe of 1,044 teachers was used based on the lowest self-reported prevalence of voice problems in the literature7 (17%), with a
sampling error of three percentage points, 95% confi -dence level (α = 5%) and 10% added to compensate for losses and non-responses, totaling 420 teachers. For operational reasons, a new sample size was then esti-mated considering a sampling error of four percentage
b Municipal Administration of Florianópolis. Perfi l de Florianópolis. Florianópolis. [cited 2009 Nov 05]. Available from: http:/portal.pmf. sc.gov.br/arquivosl/arquivos/pdf/05 11 2009 13.00.43.d53d27cbe464ff1805a76dbb9631cf6c.pdf/
points, which meant reducing the precision of the prevalence estimate.
Systematic sampling was carried out. The sample frac-tion was calculated using the following formula: k = N/n = 1,044/420 = 2.48 ~ 3. The sample was drawn from a single list of eligible teachers in alphabetical order and every third name was selected.
Data was collected using a self-administered question-naire, which was pre-tested in a sample of 20 teachers from a state public school with similar characteristics as those defi ned in the present study. Questionnaires from other similar studies were the basis for the devel-opment of the study instrument used.3,6 The
question-naire comprised questions on demographic and socio-economic characteristics (gender, age, marital status, education level, family income in the month prior to the study, number of persons living in the respondent’s household); information on the teacher’s work organi-zation at school (type of employment, years working as a teacher, number of classes, number of students per class, total hours worked per week); information about their work environment (noise levels, room acoustics, dirt and chalk dust, moisture, resting area, rest break, relationship with colleagues, performance monitoring, teacher-student relationship, school violence); informa-tion on health behaviors and self-reported morbidities (hydration level, hypertension, diabetes, rhinitis/ sinusitis, asthma, hearing loss, depression, pharyngitis, ulcers, gastritis, physical activity, alcohol use, smoking) and self-reported voice problems.
Data was collected from May to July 2009 and data collection was repeated in August to minimize losses. The school management authorized the researchers to conduct the study prior to data collection. The ques-tionnaires were delivered to school coordinators who handed them out and returned them 15 days later. The study was conducted in schools where teachers worked and anonymity of institutions and respondents was assured. The questionnaires were coded and placed into sealed envelopes with instructions for question-naire completion and a consent form enclosed. The dependent variable was self-reported voice problem (yes/no) “in the last four weeks” obtained by asking the following question: “Do you have any voice problem?”.
Data were analyzed using Stata version 9.0.
categorical variables for analysis. All categories with few responses were combined (classroom noise levels – “negligible” + “acceptable;” outside school noise levels – “unacceptable” + “high;” and moisture in the classroom – “always” + “often;” good relationship with colleagues – “no” + “sometimes;” water intake during the day – “none” + “less than 1 L;” and alcohol use – “daily” + “weekends”). The outcome prevalence was estimated based on the independent variables by testing differences between proportions using Pearson’s chi-square test and the chi-square for linear trend if applicable.
For the analysis of factors associated with self-reported voice problems, Poisson regression with robust vari-ance was performed and the reference category was no voice problems. The magnitude of the association of each factor with voice problems was assessed by crude and adjusted prevalence ratios (PR) and their related 95% confi dence intervals (95% CI) and p-value (Wald test). The analyses followed a theoretical hierarchical model where the variables were arranged in four blocks. The fi rst block, more distal, included demographic and socioeconomic variables, which conditioned the variables in block 2, work organization, and block 3, environmental (physical and psychosocial) factors, which in turn had an effect on the variables in block 4 (health-related behaviors and self-reported morbidi-ties) and the study outcome. Variables with p < 0.20 in the bivariate analysis were selected to be included in the multiple analysis, and those with p ≤ 0.05 in the hierarchical blocks remained in the fi nal model. The study was approved by the Human Research Ethics Committee of the Pro-Reitoria de Pesquisa e Extensão da Universidade Federal de Santa Catarina (protocol no. 237/2008). All participants signed a free consent form.
RESULTS
Of 420 teachers randomly selected, 393 (93.6%) completed the questionnaire. Of the 27 (6.4%) teachers who did not participate in the study, four were on sick leave, fi ve were on maternity leave, three were on leave due to voice problems and 15 refused to participate. The prevalence of self-reported voice problems was 47.6% (95%CI 42.6;52.5). Table 1 shows that most of the study sample were female (86.8%), 57.1% were married, and over half had specialization. The mean age was 40.2 years (SD 7.8) and average per capita income was 1765.08 reais (SD 1,038.43). The prevalence of self-reported voice problems was higher among women (p = 0.021) and those in the fi rst tertile of per capita
income (p = 0.013).
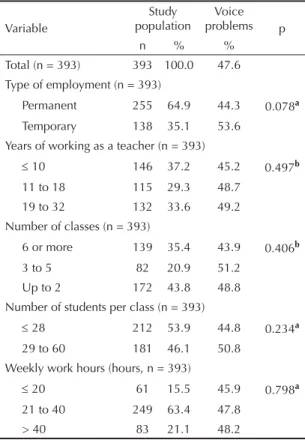
Regarding the characteristics of work organization (Table 2), 63.4% of the respondents worked 21 to 40 hours weekly, 64.9% were permanent teachers, and 53.9% had 28 or fewer students per class. No variable in
this group was statistically associated with self-reported voice problems.
Table 3 shows that more than half of the respondents rated the noise level in the classroom and in the school area as high or unacceptable. Over 60% reported frequent or continuous exposure to dirt and chalk dust in the classroom. The following variables were associated with the study outcome: unacceptable noise levels in the classroom (p = 0.019), unacceptable noise levels in the school area (p = 0.004), constant exposure to dust in the classroom (p = 0.007), no break between classes (p = 0.002), constant monitoring of their performance (p = 0.036), strained teacher-student relationship (p < 0.001) and school violence (p = 0.003).
As for health-related behaviors and self-reported morbidities (Table 4), 80.0% of the teachers reported drinking water during classes, but 62.0% reported drinking less than one liter of water a day. The most frequently reported comorbidities were rhinitis/sinus-itis (47.0%) and depression (27.6%). The presence of morbidities such as rhinitis/sinusitis (p < 0.001),
Table 1. Prevalence of voice problems according to individual characteristics among teachers of local public schools. Florianópolis, Southern Brazil, 2009.
Variable
Study population
Voice problems p
n % %
Total (n = 393) 393 100.0 47.6
Sex (n = 393)
Male 52 13.2 32.7 0.021a
Female 341 86.8 49.9 Age (years, n = 393)
23 to 37 134 34.1 45.5 0.074b
38 to 43 119 30.3 49.6 44 to 62 140 35.6 47.9
Marital status (n = 392)
Married 226 57.2 55.7 0.819a
Single 119 30.1 29.4 Divorced 44 11.0 11.7
Widowed 3 0.7 0.5
Education level (n = 393)
Graduate degree 74 18.8 33.8 0.080a
Specialization 256 65.1 51.6 College degree 63 16.0 47.6 Per capita income (reais, n = 257)
> 2,000.00 71 27.6 36.6 0.013b
1,200.00 –| 2,000.00 99 38.5 45.5 200.00 –| 1,200.00 87 33.9 56.3
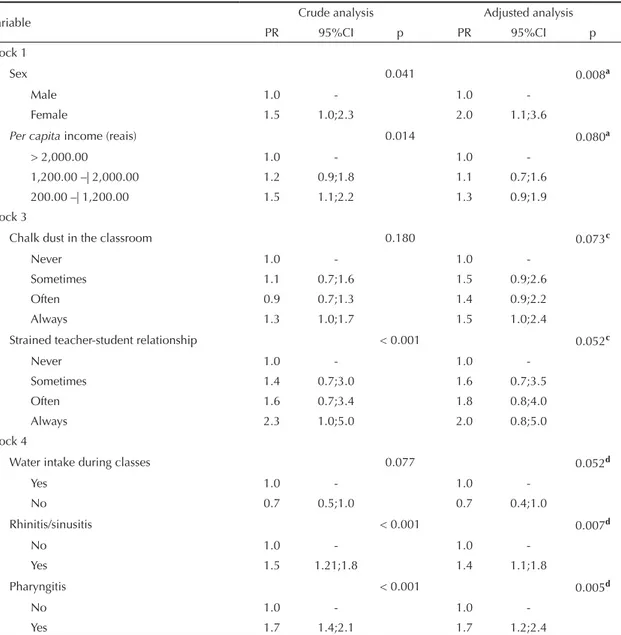
depression (p = 0.001) and pharyngitis (p < 0.001) and physical inactivity (p = 0.043) were associated with higher prevalence of self-reported voice problems. In the fi nal adjusted model (Table 5) being female (PR 2.0 [95%CI 1.1;3.6]), reporting rhinitis/sinusitis (PR 1.4 [95%CI 1.1;1.8]) and pharyngitis (PR 1.7 [1.2;2.4]) remained associated with higher prevalence of self-reported voice problems.
DISCUSSION
The prevalence of self-reported voice problems was 47.6%, very close to that found in similar studies carried out in cities of the state of Rio Grande do Sul,c Bahia,
Northeastern Brazil,d and Pará, Northern Brazil,8 and
much higher than 17%7 used in the estimate of the study
sample, though it should be noted that different defi ni-tions of voice problems and methods were used.3,6,16
Despite these diffi culties in comparing results, the high prevalence of vocal problems in teachers is a consensus in Brazil and in other countries.2,9,10
Female teachers more often reported more voice prob-lems than their male colleagues,10,14 which is partly
explained by gender-related differences of the larynx. For example, hyaluronic acid, a protein that increases water fl ow to the lamina propria of vocal folds leading to fewer traumas during emission, is more abundant in males. The glottic proportion in the female larynx is smaller, which may hinder phonic adaptations for heavy voice use.1 Social and cultural factors, expressed by
specifi c characteristics and the potentially demanding female social role may also contribute to voice prob-lems among women.15 In addition, it should be noted
the small number of men included in the study sample. There was found a signifi cant association between self-reported voice problems and rhinitis/sinusitis and phar-yngitis. Other studies also showed a positive association between dysphonia and respiratory problems such as allergic rhinitis13 and pharyngitis.4 Exposure to dirt and
chalk dust in the classroom increases the likelihood of developing upper airway conditions. These respiratory problems are associated with environmental conditions and affected by individual predisposing factors.4
The present study did not fi nd an association between self-reported vocal problems and work organization (years working as a teacher and workload), which is consistent with other studies.2,4 This fi nding may
be explained by the healthy worker effect, since the development of severe vocal problems may lead to a career change, or even early retirement.4,16 It may also
be that during the course of their careers, teachers tend to develop compensatory strategies or techniques to minimize the diffi culty in voice production, which may have an effect on their perception of voice quality.13,16
Besides, this fi nding may have resulted from an homo-geneous distribution of the population according to the variables workload and years working as a teacher. The prevalence of self-reported voice problems was associated with low per capita income in the crude analysis. Income is a determinant of the health-disease process, and those with lower income tend to get sick more often, are more susceptible to diseases and are more exposed to several risk factors.5
In the crude analysis, the prevalence of self-reported voice problems was signifi cantly higher among teachers who reported exposure to dirt and chalk dust and unac-ceptable noise levels in the classroom and in the school area. These environmental conditions of dust and noise negatively interfere with learning activities, and similar data were reported to have a signifi cant association in other studies.3,9
c Peter V. Relação entre disfonia referida e potenciais fatores de risco no trabalho em professores do ensino fundamental de Porto Alegre- RS [Master’s dissertation]. Porto Alegre: Universidade Federal do Rio Grande do Sul; 2004.
d Thomé CR. A voz do professor: relação entre distúrbio vocal e fatores psicossociais do trabalho [Master’s dissertation]. São Paulo: Pontifícia Universidade Católica de São Paulo; 2007.
Table 2. Prevalence of voice problems according to job characteristics among teachers of local public schools. Florianópolis, Southern Brazil, 2009.
Variable
Study population
Voice problems p
n % %
Total (n = 393) 393 100.0 47.6 Type of employment (n = 393)
Permanent 255 64.9 44.3 0.078a Temporary 138 35.1 53.6
Years of working as a teacher (n = 393)
≤ 10 146 37.2 45.2 0.497b 11 to 18 115 29.3 48.7
19 to 32 132 33.6 49.2 Number of classes (n = 393)
6 or more 139 35.4 43.9 0.406b 3 to 5 82 20.9 51.2
Up to 2 172 43.8 48.8 Number of students per class (n = 393)
≤ 28 212 53.9 44.8 0.234a
29 to 60 181 46.1 50.8 Weekly work hours (hours, n = 393)
≤ 20 61 15.5 45.9 0.798a
21 to 40 249 63.4 47.8 > 40 83 21.1 48.2
Teachers strain their voice in noisy environments for long periods and do not have enough time to rest or recover it and are often exposed to stressful situa-tions.9 Although the association lost signifi cance in
the adjusted model, there were few reports of rest breaks between classes, and bearing in mind the school day-today and total workload of teachers, it can be assumed that teachers work two to three shifts daily with vocal overload.3
A study found an increased prevalence of vocal symp-toms between 1998 and 2001, and concluded that the deterioration of working conditions during the 1990s with increasing inappropriate behaviors and noise levels in the classroom can be all be stressors among teachers.11 In the present study, even though on
border-line statistical signifi cance, persistent strained teacher-student relationship was associated with the outcome. Recent studies have showed an association between strained relationship with students and lower voice-related quality of life and reported voice symptoms.6,7
A study has reported a positive association with water intake for maintaining and improving vocal quality,17
however our study did not corroborate this fi nding. Given the cross-sectional design of this study a cause and effect relationship cannot be established. It is believed that people with voice problems drink more water to alleviate their voice symptoms. However,
Table 3. Prevalence of voice problems according to work environment characteristics among teachers of local public schools. Florianópolis, Southern Brazil, 2009.
Variable
Study population
Voice problems p
n % %
Total (n = 393) 393 100.0 47.6 Noise level in the classroom (n = 393)
Acceptable 109 28.0 69.6 0.019b High 254 64.5 45.7
Unacceptable 34 8.5 73.5 Internal noise in the school (n = 393)
Negligible 23 6.0 39.1 0.004b
Acceptable 154 39.1 44.2 High 175 44.5 44.6 Unacceptable 41 10.4 78.0 External noise in the school (n = 392)
Negligible 57 14.5 52.6 0.479b
Acceptable 237 60.5 44.3
High 110 28 52.7
Room acoustics (n = 374)
Poor 182 48.7 50.0 0.415b Fairly adequate 145 38.8 43.4
Adequate 47 12.5 46.8 Dirt in the classroom (n = 387)
Never 25 6.5 40.0 0.007b
Sometimes 123 32.0 43.9 Often 176 45.5 44.3 Always 63 16.0 68.3 Chalk dust in the classroom (n = 391)
Never 67 17.1 44.8 0.169b
Sometimes 47 12.1 48.9 Often 163 41.6 42.3 Always 114 29.2 57.0 Moisture in the classroom (n = 377)
Never 108 28.6 52.8 0.570b
Sometimes 181 48.0 42.0 Often 88 23.4 54.6 Resting area (n = 393)
No 96 24.4 52.1 0.310a
Yes 297 75.6 46.1 Rest breaks between classes (n = 392)
Often 62 16.0 38.7 0.002b
Sometimes 182 46.0 42.3
No 148 38.0 58.1
Good relationship with colleagues (n = 390)
Sometimes 19 4.8 50.0 0.623b
Often 132 34.0 47.7 Always 239 61.2 46.9 To be continued
Table 3 continuation
Variável
Study population
Voice problems p
n % %
Performance monitoring (n = 372)
Never 42 11.3 33.3 0.036b
Sometimes 175 47.0 45.1
Often 114 30.6 49.1
Always 41 11.1 56.1
Strained teacher-student (n = 390)
Never 17 4.4 29.4 < 0.001b
Sometimes 174 44.6 42.0
Often 130 33.0 47.7
Always 69 18.0 68.1
School violence (n = 390)
Never 217 55.6 41.9 0.003b
One episode 67 17.0 49.3
Fairly regular
episodes 89 23.0 58.4
Frequent
episodes 17 4.4 64.7
the reverse causality bias cannot be ruled out when examining the associations between the outcome and the variables presence of rhinitis/sinusitis, presence of pharyngitis, frequent exposure to chalk dust in the classroom and strained teacher-student relationship. The Municipal School Department of Florianópolis, together with the Workplace Health and Wellness Program, launched the Campaign for Vocal Health Promotion in 2008, which may have infl uenced the results of this study.
The study sample size was adequate to estimate the prevalence of voice problems, and it was randomly drawn with high response rate, which indicates internal validity. Losses and refusals occurred randomly at a low rate minimizing selection bias.
A major limitation of this study related to the exclusion of teachers on medical leave, which probably underes-timated the actual prevalence of the outcome studied. Also, studies based on self-administered questionnaires are prone to the existence of self-report bias.
We used the time frame “in the last four weeks” for self-report of voice problems that allows adequate recall by the teachers and can improve the quality of information provided.
The study results showed that voice problems in teachers can be associated with gender-related factors and self-reported morbidities and, on borderline statistical signifi cance, with psychosocial and work environment aspects as well. These fi ndings reinforce the need for actions for promoting voice health among teachers so that there is a good interaction between the teachers, their working conditions and their general and voice health.
These actions should involve structural changes in the workplace as well as increased awareness about voice care among teachers through workshops to develop
Table 4. Prevalence of voice problems according to health-related behaviors and self-reported morbidities among teachers of local public schools. Florianópolis, Southern Brazil, 2009.
Variable
Study population
Voice problems p
n % %
Total (n = 393) 393 100.0 47.6
Water intake during classes (n = 389)
Yes 311 80.0 50.5 0.057a
No 78 20.0 38.5
Amount of water intake during the day (liters, n = 393)
<1 248 63.0 47.7 0.896b
1 to 2 130 33.0 48.5
> 2 15 4.0 40.0
Hypertension (n = 393)
No 351 89.3 47.6 0.996a
Yes 42 10.7 47.6
Diabetes (n = 393)
No 379 96.4 47.0 0.203a
Yes 14 3.6 64.3
Rhinitis/sinusitis (n = 393)
No 208 53.0 38.5 < 0.001a
Yes 185 47.0 57.8
Asthma (n = 393)
No 340 86.5 45.9 0.087a
Yes 53 13.5 58.5
Hearing loss (n = 393)
No 345 87.8 46.1 0.087a
Yes 48 12.2 58.3
Depression (n = 392)
No 284 72.4 42.3 0.001a
Yes 108 27.6 61.1
Pharyngitis (n = 393)
No 360 91.6 44.7 < 0.001a
Yes 33 8.4 78.8
Ulcers (n = 393)
No 375 95.4 46.9 0.239a
Yes 18 4.6 61.1
Gastritis (n = 393)
No 289 73.5 46.4 0.421a
Yes 104 26.5 51.0
Weekly physical activity (n = 391)
≥ 3 times 72 18.4 41.7 0.043b 1 to 2 times 194 49.6 44.3
Inactive 125 32.0 55.2
To be continued
Table 4 continuation
Variable
Study population
Voice problems p
n % %
Alcohol use (n = 393)
Never 156 40.0 48.7 0.764a
Sometimes 162 41.0 45.1
Often 75 19 52.6
Smoking (n = 393)
No 355 90.3 47.3 0.754a
Yes 38 9.7 50.0
knowledge and perception regarding voice production and health promotion.
Further studies are needed to better understand factors
related to voice health so that prevention actions can be developed targeting psychosocial and environment aspects and effective interventions can be implemented in the workplace.
Table 5. Prevalence ratios and confi dence intervals for the association between voice problems and associated variables among teachers of local public schools. Florianópolis, Southern Brazil, 2009.
Variable Crude analysis Adjusted analysis
PR 95%CI p PR 95%CI p
Block 1
Sex 0.041 0.008a
Male 1.0 - 1.0
-Female 1.5 1.0;2.3 2.0 1.1;3.6
Per capita income (reais) 0.014 0.080a
> 2,000.00 1.0 - 1.0
-1,200.00 –| 2,000.00 1.2 0.9;1.8 1.1 0.7;1.6 200.00 –| 1,200.00 1.5 1.1;2.2 1.3 0.9;1.9 Block 3
Chalk dust in the classroom 0.180 0.073c
Never 1.0 - 1.0
-Sometimes 1.1 0.7;1.6 1.5 0.9;2.6
Often 0.9 0.7;1.3 1.4 0.9;2.2
Always 1.3 1.0;1.7 1.5 1.0;2.4
Strained teacher-student relationship < 0.001 0.052c
Never 1.0 - 1.0
-Sometimes 1.4 0.7;3.0 1.6 0.7;3.5
Often 1.6 0.7;3.4 1.8 0.8;4.0
Always 2.3 1.0;5.0 2.0 0.8;5.0
Block 4
Water intake during classes 0.077 0.052d
Yes 1.0 - 1.0
-No 0.7 0.5;1.0 0.7 0.4;1.0
Rhinitis/sinusitis < 0.001 0.007d
No 1.0 - 1.0
-Yes 1.5 1.21;1.8 1.4 1.1;1.8
Pharyngitis < 0.001 0.005d
No 1.0 - 1.0
-Yes 1.7 1.4;2.1 1.7 1.2;2.4
a Adjusted for variables p < 0.20 in Block 1.
b Adjusted for variables p < 0.20 in Block 2 and variables p < 0.20 in Block 1.
c Adjusted for variables p < 0.20 in Block 3, variables p < 0.20 in Block 2 and variables p < 0.20 in Block 1.
d Adjusted for variables p < 0.20 in Block 4, variables p < 0.20 in Block 3, variables p < 0.20 in Block 2 and variables p <
The authors declare that there are no confl icts of interest. 1. Butler JE,Hammond TH, Gray SD. Gender-related
differences of hialuronic acid distribution in the human vocal fold. Laryngoscope. 2001;111(5):907-11. DOI:10.1097/00005537-200105000-00029
2. Dragone MLOS, Reis R, Sichirolli S, Behlau MS. Desgaste vocal do professor: um estudo longitudinal. Rev Bras. Soc Fonoaudiol. 1999;3(5):50-7.
3. Ferreira LP, Giannini SPP, Figueira S, Silva EE, Karmann DF, Souza TMT. Condições de produção vocal de professores da prefeitura municipal de São Paulo. Disturbios Comun. 2003;14(2):127-34.
4. Fuess VLR, Lorenz MC. Disfonia em professores do ensino municipal: prevalência e fatores de risco. Rev Bras Otorrinolaringol. 2003;69(6):807-12. DOI: 10.1590/S0034-72992003000600013
5. Gatti BA, Barreto ESS. Professores do Brasil: impasses e desafi os. Brasília: UNESCO; 2009.
6. Jardim R, Barreto SM, Assunção AA. Condições de trabalho, qualidade de vida e disfonia entre docentes. Cad Saude Publica. 2007;23(10):2439-2. DOI:10.1590/S0102-311X2007001000019
7. Jardim R, Barreto SM, Assunção AA. Disfonia: defi nição de caso e prevalência em professores. Rev Bras Epidemiol. 2007;10(4):625-36. DOI: 10.1590/ S1415-790X2007000400020.
8. Palheta Neto FXP, Rebelo Neto OB, Ferreira Filho JSS, Palheta ACP, Rodrigues LG, Silva FA. Relação entre as Condições de Trabalho e a Autoavaliação em Professores do Ensino Fundamental. Arq Int Otorrinolaringol (Impr). 2008;12(2):230-38.
9. Roy N, Merril RM, Thibeault S, Parsa RA, Gray SD, Smith EM. Prevalence of voice disorders in teachers and the general population. J Speech Lang
Hear Res. 2004;47(2):281-93. DOI:10.1044/1092-4388(2004/023)
10. Russel A, Oates J, Grenwood KM. Prevalence of voice problems in teachers. J Voice. 1998;12(4):467-79. DOI:10.1016/S0892-1997(98)80056-8
11. Simberg S, Sala E, Vehmas K, Laine A. Changes in the prevalence of vocal symptoms among teachers during a twelve-year period. J Voice. 2005;19(1):95-102. DOI:10.1016/j.jvoice.2004.02.009
12. Simões M, Latorre MRDO. Prevalência de alteração vocal em educadoras e sua relação com auto-percepção. Rev Saude Publica. 2006;40(6):1013-8. 10.1590/S0034-89102006000700008
13. Smith E, Gray SD, Dove H, Kirchner L, Heras H. Frequency and effects of teachers voice problems. J Voice. 1997;11(1):81-7.DOI:10.1016/S0892-1997(97)80027-6
14. Smith E, Kirchner HL, Taylor M, Hoffman H, Lemke JH. Voice problems among teachers: differences by gender and teaching characteristics. J Voice. 1998;12(3):328-34. DOI:10.1016/S0892-1997(98)80022-2
15. Vilkman E. Ocupational safety and health aspects of voice and speech professions. Folia Phoniatr Logop. 2004;56(4):220-53. DOI:10.1159/000078344
16. Thibeault SL, Merrill RM, Roy N, Gray SD, Smith EM. Occupational risk factors associated with voice disorders among teachers. Ann Epidemiol. 2004; 14(10):786-92. DOI:10.1016/j. annepidem.2004.03.004
17. Yiu EM, Chan RMM. Effect of hidration and vocal rest on the vocal fatigue in amateur karaoke singers. J Voice. 2003;17(2):216-27. DOI:10.1016/S0892-1997(03)00038-9