Original Article
Artigo Original
Susana Pimentel Pinto Giannini1 Maria do Rosário Dias de Oliveira Latorre2 Léslie Piccolotto Ferreira3
Descritores
Distúrbios da Voz Escalas Questionários Medidas em Epidemiologia
Avaliação de Programas e Instrumentos de Pesquisa
Pesquisa Métodos Keywords
Voice Disorders Scales Questionnaires Epidemiologic Measurements Evaluation of Research Programs and Tools Research Methods
Correspondence address: Susana Pimentel Pinto Giannini Avenida Nhandu, 334, Saúde, São Paulo (SP), Brasil, CEP: 04059-000. E-mail: [email protected]
Received: 02/18/2015
Accepted: 06/04/2015
Study carried out at the Graduate Studies Program in Speech-Language Pathology and Audiology, Pontifícia Universidade Católica de São Paulo – PUC-SP – São Paulo (SP), Brazil.
(1) Hospital do Servidor Público Municipal, Municipality of São Paulo – HSPM-PMSP – and Department of Education and Rehabilitation of Communication Disorders, Pontifícia Universidade Católica de São Paulo – PUC-SP – São Paulo (SP), Brazil.
(2) Department of Epidemiology, School of Public Health, Universidade de São Paulo – USP – São Paulo (SP), Brazil.
(3) School of Speech-Language Pathology and Audiology and Graduate Studies Program in Speech-Language Pathology and Audiology, Pontifícia Universidade Católica de São Paulo – PUC-SP – São Paulo (SP), Brazil. Conlict of interests: nothing to declare.
Condition of Vocal Production-Teacher
questionnaire: comparison of responses
on Likert scale and visual analog scale
Questionário Condição de Produção Vocal –
Professor: comparação entre respostas
em escala Likert e em escala visual analógica
ABSTRACT
Purpose: To compare the responses related to vocal symptoms in two versions of the Vocal Production Condition – Teacher (CPV-T) questionnaire, with responses on a Likert scale and a Visual Analog Scale (VAS), in order to evaluate which is the best measurement method. Methods: A cross-sectional observational study was conducted with teachers with voice disorders during the period from July 2011 to July 2012. All teachers answered the CPV-T in two versions: with answers on a 4-point Likert scale and on a 50-mm VAS. The answers related to vocal symptoms dimension were analyzed. Results: Most of the symptoms showed good (hoarseness, high-pitched voice, unstable voice, weak voice, effort when speaking, throat clearing, burning throat, and pain when speaking) or regular concordance (loss of voice, failing voice, low-pitched voice, vocal fatigue, dry throat, lump in the throat, secretion in the throat, pain when swallowing, dificulty swallowing, and dry cough). Conclusion: The CPV-T questionnaire with answers on Likert scale proved to be more suitable than the VAS owing to the ease of understanding and interpretation, in addition to facilitating the input of answers for the researcher. Therefore, the Likert scale was chosen for the CPV-T, considering it to be validated as the method to measure the answers. The dimension of vocal aspects evaluated in the present study, the Voice Disorder Screening Index (ITDV), can be used in epidemiological studies to estimate the prevalence of vocal symptoms and in the Speech-Language Pathology and Audiology clinic routine or in monitoring teachers throughout their careers.
RESUMO
INTRODUCTION
Research in the professional use of voice began in the clini-cal practice by the demand from workers who use their voice intensely in their professional activities and develop vocal symptoms. The 1980s saw the irst Brazilian studies in Speech-Language Pathology and Audiology, with descriptions of pre-ventive measures and clinical case reports, which indicated a relationship between voice disorders and some occupations(1).
By the late 1990s, this perception is shared by Speech-Language pathologists who work with professionals from various seg-ments and realize the need for knowledge about the reality of these professionals’ activities(2).
In order to identify the professional use of vocal in different contexts, a group of Speech-Language Pathologists and doctors in the area began to elaborate, in 1998, a questionnaire in order to survey epidemiologic data related to voice and professional activities(3). The population chosen initially was teachers, for
representing a large number of workers and being the profes-sional category most affected by voice disorders(4).
The questionnaire prepared, “Vocal Production Condition – Teacher” (Condição de Produção Vocal – Professor, or CPV-P, in Portuguese), was originated based on the complaints of teach-ers during clinical care and became an important tool to char-acterize the vocal proile of teachers, in addition to the working conditions in schools. Initially applied in teachers from the city of São Paulo(5), it gave rise to several surveys conducted
in São Paulo and other Brazilian states, also conducted with other professional categories, with the necessary adjustments(6).
From its creation, it has undergone several adaptations and validation processes. Speciically regarding the category of vocal aspects, reproducibility studies were carried out(7), and
a screening tool for voice disorders was developed, the “Voice Disorder Screening Index” (Índice de Triagem de Distúrbio
de Voz [ITDV]), which has high sensitivity for the mapping of
voice disorders in teachers through self-report of the presence of 12 vocal symptoms(8). Participants reporting ive or more
symptoms should be referred to the otorhinolaryngology and Speech-Language Pathology and Audiology in order to undergo a more speciic assessment for diagnosis.
The ITDV was incorporated into the CPV-P, and its cur-rent version consists of 62 questions divided into the following categories: sociodemographic data (identiication of the inter-viewee and professional status), aspects of the teaching activity (characteristics of the school environment and of the teacher’s work organization), vocal aspects (vocal use, habits, and life-style), and vocal symptoms through the ITDV.
Regarding the answers, the main change was proposed by Simões and Latorre(9), in a study on the prevalence of voice
disorders in daycare teachers, which, initially, were “yes” and “no” and were then transferred to a Likert scale (never, rarely, sometimes, always, and I do not know), which extended the possibilities for analysis of the results.
This study constitutes one more step in the systematiza-tion, construct consolidasystematiza-tion, and validation of the CPV-P, by comparing responses related to vocal symptoms in two scales, Likert and Visual Analog Scale (VAS), which consists of a
linear scale in millimeters (mm), with or without constant divi-sion marks along the axis(10). It is used in nursing, especially
for determining the intensity of the patient’s pain and its evo-lution, to analyze the effectiveness of the procedures used(11).
In the ield of voice, some studies propose the use of VAS for voice evaluation(12,13).
This study, therefore, aimed to compare the responses related to vocal symptoms in two versions of the CPV-T questionnaire, with responses on a Likert scale and a VAS, in order to evalu-ate which is the best measurement method.
METHODS
This is a cross-sectional observational study. All teachers from municipal schools in the city of São Paulo with voice dis-orders who started Speech-Language therapy at Hospital do Servidor Público Municipal de São Paulo between July 2011 and July 2012 were invited to participate. All patients received information about the study’s purpose and clariications on illing out the questionnaires. The study was approved by the Research Ethics Committee of Hospital do Servidor Público Municipal de São Paulo (221/2010) and by the Research Ethics Committee of Pontifícia Universidade Católica de São Paulo (321/2011), and the teachers who agreed to participate signed an informed consent form. To maintain the conidentiality of identities, their names were not included in the database but only an identiication number.
The participants answered the CPV-P questionnaire in two versions: with answers on a four-point Likert scale (never, rarely, sometimes, and always) and on a VAS with a 50-mm ruler (extreme left represents “never” and the extreme right, “always”, as shown in Figure 1).
The procedure was performed individually at the time they were called for therapy, before the therapy process began. Initially, the participants responded to the questionnaire in its classic version with answers on a Likert scale, with the instruction to answer according to the degree they judged adequate: never, rarely, sometimes, or always. Soon after, the same questionnaire was presented, with answers on a VAS and the instruction to trace a vertical line on the grading point they judged adequate between never and always. The average time of completion for the two questionnaires was 20 minutes.
In both scales, only the issues related to self-reported symptoms were analyzed: hoarseness, loss of voice, fail-ing voice, shortness of breath while talkfail-ing, high-pitched voice, low-pitched voice, unstable voice varying between high- and low-pitched voices, weak voice, effort when speaking, vocal fatigue, dry throat, huskiness, lump in the throat, sandy throat, sore throat, secretions in the throat, pain when speaking, pain when swallowing, difficulty swallowing, dry cough, and cough with phlegm. Each symptom was analyzed
never always
in two categories: present and absent, and was considered present when the answer was sometimes/always on the Likert scale or greater than 1.5 mm on the VAS.
The data collected were entered twice, and the databases were compared (validate) through the Epi Info software (ver-sion 7.0). After checking the data for consistency, the statis-tical analyzes were performed using SPSS (version 10.0). Descriptive analysis was performed, and the kappa test was applied for the description of the correlation of responses between the two versions of the instrument. The kappa results were considered according to the following criteria: perfect correlation = equal to 1.00; excellent correlation = from 0.81 to 0.99; good correlation = from 0.61 to 0.80; regular correla-tion = from 0.41 to 0.60; tolerable correlacorrela-tion = from 0.21 to 0.40; weak correlation = from 0.00 to 0.20; and poor correla-tion = less than 0.00(10). In addition, boxplots were prepared to
compare, graphically, the distribution and dispersion of certain symptoms in both types of responses.
RESULTS
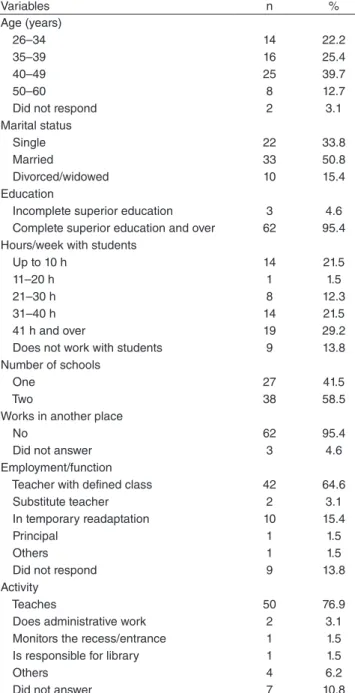
Study participants were 65 teachers. Most were aged between 40 and 60 years (52.4%), were married (50.8%), were university graduates (95.4%), worked more than 30 hours per week (50.7%), in teaching activity (76.9%), for an average of 16.42 years, with standard deviation (SD) of 8.11 years, with a deined class (64.6%), and acted in two schools (58,5%). The distribution of the sample according to sociodemographic and professional characteristics is detailed in Table 1.
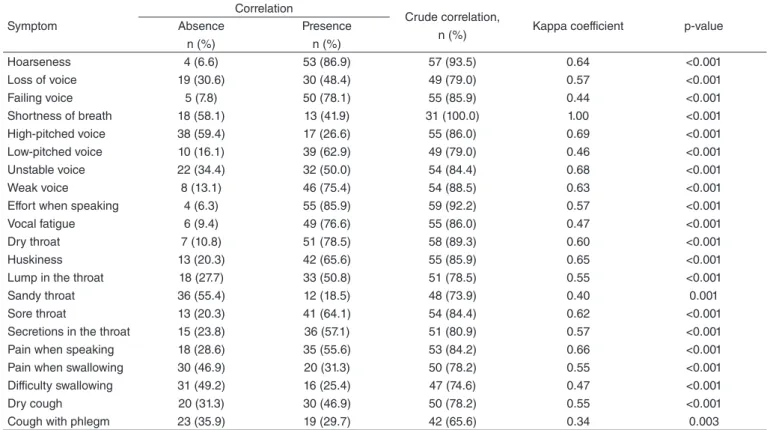
Table 2 shows the reliability measures of vocal symptoms in both response formats. There was signiicant correlation for all symptoms.
Most symptoms showed good (kappa = 0.61–0.80: hoarse-ness, high-pitched voice, unstable voice, weak voice, effort when speaking, huskiness, sore throat, and pain when speaking) or regular correlation (kappa = 0.41–0.60: loss of voice, failing voice, low-pitched voice, vocal fatigue, dry throat, lump in the throat secretions in the throat, pain when swallowing, dificulty swallowing, and dry cough). The breathlessness symptom showed perfect correlation (kappa = 1.00) and sandy throat and cough with phlegm showed tolerable correlation (kappa = 0.21–0.40).
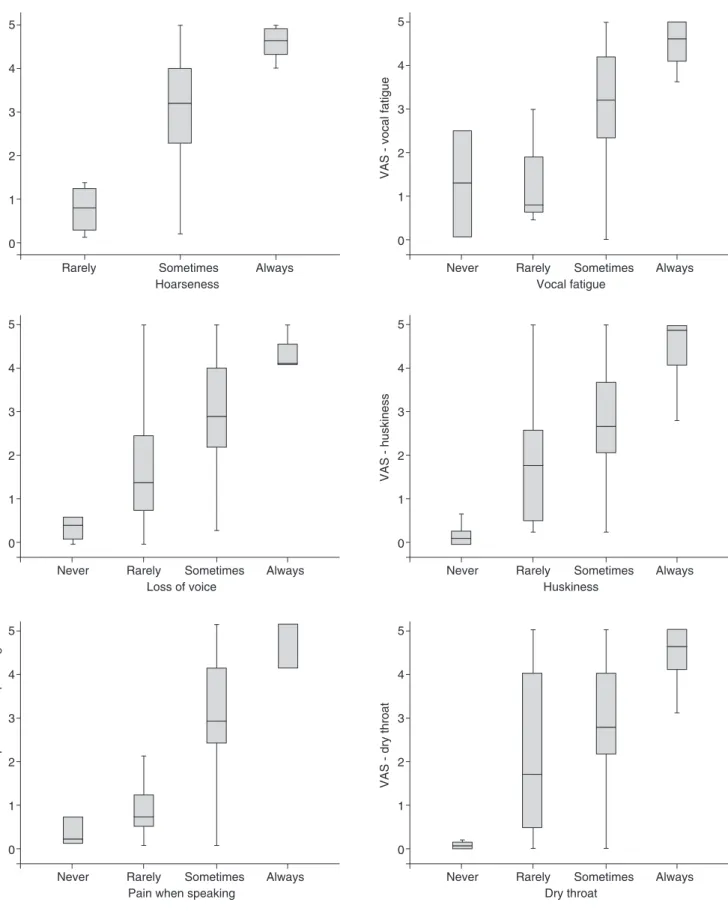
Figure 2 shows the dispersion in the VAS points of the responses in the Likert scale for the symptoms of hoarseness, loss of voice, vocal fatigue, huskiness, pain when speaking, and dry throat.
The graphs in Figure 2 show that the median of responses increase according to the severity of the symptoms, and the median of the points in the ruler are similar to the answers “never” and “rarely,” except for the symptom “vocal fatigue”. However, the variability of the measurements on the ruler (min-imum and max(min-imum answers) is very large in the intermediate answers “rarely” and “sometimes,” between 0 and 50 mm, i.e., the full extent of the ruler. It is noteworthy that no participant marked the answer never for hoarseness, which is expected considering that they were undergoing early Speech-Language therapy for presenting a voice disorder.
DISCUSSION
Because they result from the interaction of personal and social factors, voice disorders are a dynamic and functional manifestation, and, therefore, the measurement of vocal symp-toms is a complex issue.
This study aimed to compare two ways to evaluate the responses to vocal symptoms in the CPV-P questionnaire: one in a Likert scale and the other in a VAS. It intended to evaluate the best measurement criteria and to advance in construct con-solidation and instrument validation. In seeking the best way to measure these subjective perceptions, it was considered, at irst, that the responses on the ruler could contemplate the nuances of the subjects’ responses and be a better measurement method.
Table 1. Sample distribution according to sociodemographic and functional variables
Variables n %
Age (years)
26–34 14 22.2
35–39 16 25.4
40–49 25 39.7
50–60 8 12.7
Did not respond 2 3.1
Marital status
Single 22 33.8
Married 33 50.8
Divorced/widowed 10 15.4
Education
Incomplete superior education 3 4.6
Complete superior education and over 62 95.4 Hours/week with students
Up to 10 h 14 21.5
11–20 h 1 1.5
21–30 h 8 12.3
31–40 h 14 21.5
41 h and over 19 29.2
Does not work with students 9 13.8
Number of schools
One 27 41.5
Two 38 58.5
Works in another place
No 62 95.4
Did not answer 3 4.6
Employment/function
Teacher with defined class 42 64.6
Substitute teacher 2 3.1
In temporary readaptation 10 15.4
Principal 1 1.5
Others 1 1.5
Did not respond 9 13.8
Activity
Teaches 50 76.9
Does administrative work 2 3.1
Monitors the recess/entrance 1 1.5
Is responsible for library 1 1.5
Others 4 6.2
The results show good correlation in both forms of measure-ment of vocal symptoms, especially those that give the respon-dent a clear deinition, such as shortness of breath, hoarseness, or huskiness, and showed better consistency in the responses. However, it is noticeable that this correlation is observed in extreme responses (never and always). The great variability of grade values measured by the ruler in the categories “rarely” and “sometimes” points out the individual’s dificulty in quan-tifying a subjective phenomenon, even though the concept was clearly deined. This issue is aggravated when analyzing the symptoms with a greater degree of subjectivity in their deini-tion, such as sandy throat or cough with phlegm, which showed a poorer degree of correlation.
During the administration of the questionnaire, a high degree of dificulty was observed by several participants in under-standing how they should respond in a continuous line with no divisions. Many chose to register their responses nearer to 0 = “never” or “always” = 5, disregarding the ruler’s interme-diary space, which may have favored the presence of responses at odds with what the participant would like to have answered. With answers through the Likert scale, all participants readily answered the questions using all of the grades.
This fact is highlighted in a study with children, which points to a systematic bias in questionnaires using answers on a VAS by the high percentage of records at the ends of the ruler, unlike that seen in the Likert scale responses, in which respon-dents make use of intermediate responses more frequently(14).
The authors add that the answers on a Likert scale had fewer blank questions than on the VAS and consider that the least
amount of losses is an important indicator for the feasibility of application of an instrument.
Similarly, an Australian study comparing the response in VAS and Likert scale to a question on anxiety points out that, although both forms have provided reliable prediction measures, 11% of respondents incorrectly completed the VAS responses, which limited its usefulness(15). Another study
comparing the answers on a seven-point Likert scale with a VAS in a questionnaire to assess quality of life in chronic lung disease highlights that, although the two choices of answer presentation methods show comparable responsive-ness, the Likert scale has ease of administration, while the VAS has greater variability of responses(16). In Brazil, a study
comparing two forms of measuring of the Voice Activity and Participation Proile (VAPP), on a VAS and numerical scale(17), highlighted that respondents verbally expressed their
preference for responding on a Likert scale, considering it easier to understand. The authors point out that, without the support of categories or division, some people feel insecure when illing out the instrument. Furthermore, there is a dif-ference between the use of a VAS in self-assessment proto-cols and in analyses carried out by professionals trained to use consistently a visual scale.
The studies cited point to the crucial question of measure-ment in epidemiological surveys. A major dificulty in research is to prepare and evaluate an instrument for achieving the pro-posed objective(10), which is aggravated by the object in
ques-tion, vocal symptoms, a subjective perceptual phenomenon of complex quantiication.
Table 2. Reliability measures of vocal symptoms in the Vocal Production Condition – Teacher questionnaires on a Likert scale and on a Visual Analog Scale
Symptom
Correlation
Crude correlation,
n (%) Kappa coefficient p-value
Absence n (%)
Presence n (%)
Hoarseness 4 (6.6) 53 (86.9) 57 (93.5) 0.64 <0.001
Loss of voice 19 (30.6) 30 (48.4) 49 (79.0) 0.57 <0.001
Failing voice 5 (7.8) 50 (78.1) 55 (85.9) 0.44 <0.001
Shortness of breath 18 (58.1) 13 (41.9) 31 (100.0) 1.00 <0.001
High-pitched voice 38 (59.4) 17 (26.6) 55 (86.0) 0.69 <0.001
Low-pitched voice 10 (16.1) 39 (62.9) 49 (79.0) 0.46 <0.001
Unstable voice 22 (34.4) 32 (50.0) 54 (84.4) 0.68 <0.001
Weak voice 8 (13.1) 46 (75.4) 54 (88.5) 0.63 <0.001
Effort when speaking 4 (6.3) 55 (85.9) 59 (92.2) 0.57 <0.001
Vocal fatigue 6 (9.4) 49 (76.6) 55 (86.0) 0.47 <0.001
Dry throat 7 (10.8) 51 (78.5) 58 (89.3) 0.60 <0.001
Huskiness 13 (20.3) 42 (65.6) 55 (85.9) 0.65 <0.001
Lump in the throat 18 (27.7) 33 (50.8) 51 (78.5) 0.55 <0.001
Sandy throat 36 (55.4) 12 (18.5) 48 (73.9) 0.40 0.001
Sore throat 13 (20.3) 41 (64.1) 54 (84.4) 0.62 <0.001
Secretions in the throat 15 (23.8) 36 (57.1) 51 (80.9) 0.57 <0.001
Pain when speaking 18 (28.6) 35 (55.6) 53 (84.2) 0.66 <0.001
Pain when swallowing 30 (46.9) 20 (31.3) 50 (78.2) 0.55 <0.001
Difficulty swallowing 31 (49.2) 16 (25.4) 47 (74.6) 0.47 <0.001
Dry cough 20 (31.3) 30 (46.9) 50 (78.2) 0.55 <0.001
Figure 2. Boxplot with points scattered over the ruler (0–5 mm) for the responses on the Likert scale (never, rarely, sometimes, and always) to the symptoms of hoarseness, loss of voice, vocal fatigue, huskiness, pain when speaking, and dry throat
VAS - hoarseness
Hoarseness Rarely
0 1 2 3 4 5
Sometimes Always
VAS - vocal fatigue
Vocal fatigue Rarely
0 1 2 3 4 5
Sometimes Always Never
VAS - huskiness
Huskiness Rarely 0
1 2 3 4 5
Sometimes Always Never
VAS - loss of voice
Loss of voice Rarely
0 1 2 3 4 5
Sometimes Always Never
VAS - dry throat
Dry throat Rarely 0
1 2 3 4 5
Sometimes Always Never
VAS - pain when speaking
Pain when speaking Rarely
0 1 2 3 4 5
In addition to the discussion of the methodological aspects involved in data collection, the dificulty in the registration pro-cess is also highlighted. The construction of the VAS database is also a laborious process, since, before typing, the researcher need to measure the responses given to each question with a ruler, which can add a bias. In this study, to minimize possible error, two researchers made this measurement, and an average of the two measures was calculated. The whole process increases the time of development of the database and involves an addi-tional professional in this phase. With the Likert scale, typing can be done directly without need for concern with this bias.
CONCLUSION
The CPV-P questionnaire with answers on a Likert scale was more appropriate in relation to the responses given on a VAS for its ease of understanding and interpretation by the respondents, in addition to facilitating the recording of answers for the investigator.
For these reasons, the recommendation is to maintain the responses to the CPV-P questionnaire on a Likert scale, con-sidering it validated as the way of measuring responses in the category of vocal aspects. The instrument is suitable for use in epidemiological studies to survey sociodemographic and environmental aspects, as well as those related to the teaching activities, the vocal use, habits, and lifestyle, in question dis-tributed in its ive categories, and it also allows the estimation of the prevalence of vocal symptoms through the vocal aspects category, now constituted by ITDV. The CPV-P is also recom-mended as a screening tool for voice disorders, through ITDV, as a routine procedure in public and private services, and for the monitoring of teachers throughout their career.
*SPPG, MRDOL, and LPF contributed to the project design, data analysis and interpretation, drafting of the article, critical review regarding the intellectual content, and the inal approval of the version to be published.
REFERENCES
1. Pinto AMM, Furck, MAE. Projeto saúde vocal do professor. In: Ferreira LP, organizador. Trabalhando a voz: vários enfoques em Fonoaudiologia. São Paulo: Summus; 1988. p. 11-27.
2. Dragone MLS, Ferreira LP, Giannini SPP, Simões-Zenari M, Vieira VP, Behlau M. Voz do professor: uma revisão de 15 anos de contribuição fonoaudiológica. Rev Soc Bras Fonoaudiol. 2010;15(2) 289-96. 3. Fabron EMG, Nemr NK, Giannini SPP. Seminários de Voz da
PUC-SP: análise da trajetória entre os anos de 1993 a 2009. Distúrb Comun. 2010;22(3):241-9.
4. Behlau M, Zambon F, Guerrieri AC, Roy N. Epidemiology of voice disorders in teachers and nonteachers in Brazil: prevalence and adverse effects. J Voice. 2012;26(5):665.e9-18.
5. Ferreira LP, Giannini SPP, Figueira S, Silva EE, Karmann DF, Thomé de Souza TM. Condições de produção vocal de professores da rede do município de São Paulo. Distúrb Comun. 2003;14(2):275-308. 6. Ferreira LP, Giannini SPP, Latorre MRDO, Zenari MS. Distúrbio de voz
relacionado ao trabalho: proposta de um instrumento para avaliação de professores. Distúrb Comun. 2007;19(1):127-37.
7. Ferreira LP, Esteves AAO, Giannini SPP, Latorre MRDO. Reprodutibilidade (teste-reteste) de sintomas vocais e sensações laringofaríngeas. Distúrb Comun. 2012;24(3):389-94.
8. Ghirardi AC, Ferreira LP, Giannini SP, Latorre MR. Screening Index for Voice Disorder (SIVD): development and validation. J Voice. 2013;27(2):195-200.
9. Simões M, Latorre MRDO. Prevalência de alteração vocal em educadoras e sua relação com a auto-percepção. Rev Saúde Pública. 2006;40(6):1013-8. 10. Pereira MG. Epidemiologia: teoria e prática. Rio de Janeiro: Guanabara
Koogan; 2005.
11. Bevilacqua AA, Tuan C, Pereira D, Carvalho J, Renata M, Maciel P, Silva V, Paterno J. Os efeitos da acupuntura auricular em cefaléia tensional primária. In: XII Encontro Latino Americano de Iniciação Cientíica e VIII Encontro Latino Americano de Pós-Graduação; 2008. Anais. Disponível em: http://www.inicepg.univap.br/cd/INIC_2009/anais/ arquivos/RE_0775_1272_01.pdf
12. Simberg S, Laine A, Sala E, Rönnemaa AM. Prevalence of voice disorders among future teachers. J Voice. 2000;14(2):231-5.
13. Yamasaki R, Leão S, Madazio G, Padovani M, Azevedo R, Behlau M. Correspondência entre Escala Analógico-Visual e a Escala Numérica na Avaliação Perceptivo-Auditiva de Vozes. In: 16º Congresso Brasileiro de Fonoaudiologia. Rev Soc Bras Fonoaudiol [online]. Suplemento; 2008. [cited 2015 jun 23]. Disponível em http://www.sbfa.org.br/portal/ anais2008/resumos/R1080-2.pdf
14. van Laerhoven H, van der Zaag-Loonen HJ, Derkx BH. A comparison of Likert scale and visual analogue scales as response options in children’s questionnaires. Acta Pædiatr. 2004;93(6):830-5.
15. Davey HM, Barratt AL, Butow PN, Deeks JJ. A one-item question with a Likert or Visual Analog Scale adequately measured current anxiety. J Clin Epidemiol. 2007;60(4):356-60.
16. Guyatt GH, Townsend M, Berman LB, Keller JL. A comparison of Likert and visual analogue scales for measuring change in function. J Chronic Dis. 1987;40(12):1129-33.